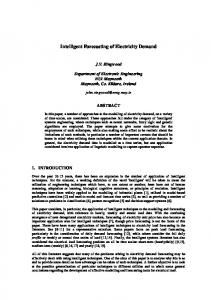
Forecasting Electricity Demand in Developing Countries: A Study of Household Income and Appliance Ownership Michael A. McNeil Environmental Energy Technologies Division Lawrence Berkeley National Laboratory Building 90-4000 Berkeley, California 94720 Telephone: 831-427-2098/510-486-6885 Fax: 510-486-6996 Email:
[email protected] Virginie E. Letschert Environmental Energy Technologies Division Lawrence Berkeley National Laboratory Building 90-4000 Berkeley, California 94720 Telephone: 510-486-7683/510-486-6885 Fax: 510-486-6996 Email:
[email protected]
Keywords Appliance ownership, developing countries, residential, refrigerator, saturation
Abstract Increase in the rate of appliance ownership1 with rising incomes is a major driver of the growth of residential electricity consumption in developing countries. Macroeconomic parameters such as GDP growth, while useful in forecasting residential electricity use, may fail to take into account the determinants of appliance use at the household level, such as total market penetration of primary appliances among certain classes, subsequent ordering and climate dependency of secondary products, the dynamics of economic growth and income distribution, urbanization and rural electrification. A detailed, multi-country investigation of the relationship between household income and appliance ownership is therefore valuable for predicting future residential energy consumption, as well as evaluating strategies for mitigation of its environmental impacts. This paper describes an analysis of recent survey data from six countries (Brazil, Mexico, Nicaragua, Panama, Peru and South Africa) yielding data on income and appliance ownership for a large sample of households. We use an econometric parameterisation to model the relationship between income and ownership for each country, and for each appliance for which data are available. This model accounts for economic variability in households in different countries due to variation in development of local markets, and makes a determination of the order of successive appliance purchases and corresponding income levels. In addition, the paper presents the results of using noneconomic parameters (such as climate, degree of urbanization and electrification rate) as a means of explaining variability between countries. Finally, we evaluate the use of the household-level model along with macroeconomic and other parameters in order to predict national ownership rates.
Introduction In an era when global greenhouse gas emissions and other environmental concerns related to energy consumption are of increasing concern, forecasting the growth of energy consumption is more important than ever. Energy consumption growth in developing countries is particularly important, for two reasons. First, while growth in per capita consumption in rich countries shows signs of slowing(Waide 1997), consumption in countries with rapidly growing economies is accelerating. For example, in Asia, electricity consumption growth exceeded 10% (Rumsey 1995) by the early 1990s, due to urbanization, the rise of manufacturing, and the emergence of a new middle class.
1 The term ’saturation’ is often used as the average number of appliances owned by each household. In this paper we use ’ownership rates’, to avoid confusion with market saturation, which indicates universal ownership.
1
As a result, much of global consumption growth in the next decades will come from these countries. Secondly, many developing countries already face a problem in meeting demand due to lack of capital to build capacity, improve efficiency of delivery, and the need to import expensive fuel from abroad. This paper focuses on patterns of growth in the residential sector generally, and household electricity consumption more specifically. Household electricity consumption growth in low-income countries is driven largely by increases in connection to electricity grids, and in increased consumption due to ownership of household appliances. The latter is in turn driven by increases in household income. The current analysis is an investigation of using empirical data to build a foundation of bottom-up energy estimates. Hopefully, further research in this direction will lead to an ability to forecast consumption growth in the residential sector with a solid theoretical basis for modeling. The success of this effort will depend on the reliability of cross-country extrapolation, and the robustness of the model. In modelling household appliance ownership trends, we recognize that this is only one (albeit significant) contributor to growth in overall household consumption. In addition to the use of major appliances, as incomes grow, the size of products may grow, and the consumption of smaller appliances becomes significant. On the other hand, products in developed countries tend to be more efficient, partly as a result of focused government efficiency programs. These trends are likely to display a similar structure of dependency on income, therefore we hope that a deeper understanding of the basic relationship will allow for extrapolation to related trends in the future. Our strategy is to start with household level data sources, to see if a meaningful relationship can be established between the income of each household, and their ability and choice to purchase appliances. This approach takes into account the distribution of income, which is significant for two reasons. First, in countries where income is poorly distributed, average income may be relatively high due to a significant amount of wealth concentrated among the richest segment of the population. Lower income segments may nonetheless remain below the threshold where ownership of major appliances is possible. Secondly, growth in appliance ownership is largely driven by the number of households entering the middle class, rather than overall GDP growth. An example of this is India, where growth in the middle class segment has resulted in appliance growth of 11% between 1998 and 2002(Euromonitor 2004), while economic GDP growth was only about 6% during the same period (World Bank Data). In addition to the dependency on household incomes, we investigate potential macroeconomic and development variables in order to explain cross-country variation in this relationship. These variables are used to construct a plausible model which would allow other investigators to estimate and forecast appliance ownership for countries for which household-level data is not available. In addition, we present cursory results on the relative ownership of secondary appliances, to gain insight into the structure of an “appliance ladder” for developing countries. Refrigeration is a major appliance in the sense of the utility it provides to residences. It is also, along with lighting, a major consumer of electricity in households. We focus on refrigerator ownership for these reasons, and because this product avoids some of the analysis complications of climate-dependency, which are critical in heating and air conditioning.
Data Sources Country-specific investigations of residential consumption have typically included extensive surveys to provide detailed data regarding ownership and use patterns of appliances. Some examples of this type of project include investigations in Venezuela (Figueroa 1993), Ghana (Constantine 1999), Cameroon (Tatiétsé 2002) and India (Pachauri 2004), to name just a fraction. These studies give a detailed picture of the components of household energy consumption, and take into account the particularities of each country, economically, culturally, and demographically. They are often targeted towards a certain segment of the population (urban or rural), and may focus on more affluent households likely to use a variety of appliances. In general, however, they characterize the range of consumption patterns according to broad income levels. Our strategy is to supplement these important findings by attempting to provide data that allows for a consistent evaluation across countries, and to use the most representative household sample possible. Finally, in order to gather sufficient data for as many countries as possible, we focused on publicly available datasets. For these reasons, we decided to pursue an analysis based on general census or development surveys. The first set of survey datasets we acquired were available for download and free of charge as part of the World 2 Bank Living Standards Measurement Study . The World Bank clearing house contains about 40 surveys from 30 different countries, with surveys from some countries available for several different years. The surveys selected for this study are summarized in Table 1.
2
http://www.worldbank.org/lsms/ 2
Table 1 – Household Survey Data Sources Brazil Contributing Institution
Appliances Surveyed Refrigerator AC Water Heater Washing Machine Dryer Stove Color TV B/W TV Radio
Panama
Peru
Panamanian Instituto Nacional Fundação Instituto Instituto Nacional Nicaraguan National Ministry of de Estadística Brasileiro de de Estadística e Institute for Statistics Planning and Geografía e Geografia e Informática and Census (INEC) Economic Policies Informática Estatística
Year of Survey 1996-97 2001 4388 4079 Number of Samples Electrification Estimation Lighting Type Lighting Type Urbanization
Mexico
Nicaragua
Yes
Yes
X X
X X
X X X X
X X X X X
X
South Africa Southern Africa Labour Development Research Unit
2000 1997 1994 1993 4946 8931 3532 2312035 1 Connection Lighting Type Lighting Type Connection Size of Yes Yes Yes Community2 X
X X
X
X X
X
X
X X X
X X X
X X X
X
X X X X
1
Mexican data were extracted from a very large sample queried directly from the website of the Central American Population Center http://censos.ccp.ucr.ac.cr/ 2 Communities of 2000 persons or less were considered rural Living standards surveys have the advantage that usually a significant effort has been made by the implementing institution (national census or statistics ministry) to ensure a representative sample. On the other hand, they do not concentrate on appliance ownership, so this data is often incomplete. While total household income was provided in some cases, in others it was reconstructed from various sources, including multiple job histories for each family member, non-salary financial assistance, and pensions. Datasets were selected primarily on the basis of completeness of data. Surveys that did not ask for refrigerator ownership were rejected, as were surveys that did not assess household income. Household incomes were calculated in the local currency, converted to U.S. dollars according to the nominal exchange rate in the year of the survey, and adjusted to 2003 dollars using the U.S. consumer price index (CPI). An alternative to this method is to use exchange rates that have been adjusted to purchase price parity (PPP). This adjustment is designed to account for the lower cost of most products and services, which may not be adequately affected by exchange rates. We found, however, that the use of PPP adjusted exchange rates created unreasonably high equivalent incomes, leading to low ownership rates for high equivalent incomes in some cases. We believe therefore that PPP adjustment may not be suitable for relatively expensive durable goods like refrigerators (which are often purchased in dollars in many of the countries in our sample). Additionally, in countries with a small market for appliances, these products are likely to be imported, and thereby are priced according to a global, rather than local market.
Relationship Between Ownership and Income For low-income households in developing countries, a refrigerator constitutes a major purchase. A brand new unit could cost several months of household income. The availability and price of used products will certainly have an impact, therefore. While some anecdotal evidence for actual prices paid may be available or inferred, in general this data is difficult to obtain. In any case, it is clear that many poor households would purchase a refrigerator were it not cost prohibitive. Additional factors which affect ownership are electrification and urbanization. We discuss these as national fit parameters below. Use of these parameters requires care, since there is a strong correlation between each of them with income, on both the household and national level. Figure 1 shows the relationship between household income and refrigerator ownership for the six countries for which we obtained data. It is immediately apparent that there is a strong correlation between income and refrigerator ownership. Ownership at the very low income levels is below 50% for every country studied, while for the wealthier countries, market saturation can clearly be seen at incomes of over about $1000 per month.
3
Figure 1 – Relationship between Refrigerator Ownership and Household Income Refrigerator Ownership vs. Household Income 100% 90%
Ownership Rate
80% 70% 60% Mexico Mexico Model Brazil Brazil Model Nicaragua Nicaragua Model Panama Panama Model South Africa South Africa Model Peru 1994 PeruModel
50% 40% 30% 20% 10% 0% 0
500
1000 1500 Monthly Income (2003 $US)
2000
The second feature that is immediately apparent from Figure 1 is that the relationship between income and refrigerator ownership is not uniform across countries. In the most extreme case, less than half of Nicaraguan households with an income in the range from 700 to 1000 dollars per month own a refrigerator, compared to over 90% for Brazilian and Mexican households in the same income range. In order to parameterize the relationship and the variability between countries, we develop a logit model, which is the simplest and most widely used choice model. An excellent description of the derivation and application of the logit formula can be found in (Train 2003). In our case, the function describes a simple binary choice: either the household chooses to purchase a refrigerator, or not. The relationship is given by
S = S
max
×
(1
− exp
(− α I ))β
where α and β are parameters determined for each country, and Smax is the maximum theoretical ownership rate. Since refrigerator ownership is not expected to be highly climate dependent, and multiple ownership is not considered, we assume Smax = 1 for all countries. The constant of proportionality with income is α, which can be taken to include dependency on local product prices, etc. The shape of the curve is modified by the additional exponent parameter, β, which can be understood as describing other non-economic barriers to ownership for lowincome families. Table 2 shows the results of a least squares fit performed separately for each country. Table 2 –Logit Model for Refrigerator Ownership vs. Household Income Brazil
α β
South Africa
Mexico
Nicaragua
Panama
Peru
0.0020
0.0019
0.0007
0.0014
0.0015
0.0020
0.531
0.453
0.880
0.459
1.825
1.751
(Σ(x-x')) /N
0.009
0.005
0.011
0.007
0.010
0.013
R2
0.903
0.920
0.886
0.904
0.912
0.907
1/2
The expression (Σ(x-x'))1/2/N calculates the average difference between the data points and the model. The quality of fit estimated in this way ranges from 0.5% to 1.3% for each data point. R2 values are all close to 0.9. For Nicaragua, the parameter α is less than half that of other countries, indicating that refrigerators are either much more expensive in that country or (more likely), the refrigerator market has not developed significantly there to make the purchase of one an obvious choice to those households that can just afford one. The exponent β is quite high for South Africa and Peru, paramaterizing the fact that in these countries, ownership rates remain low for households of low to moderate income, but rise rapidly above a certain threshold. This is shown graphically in Figure 1, as 4
ownership for incomes below the 200-300 dollar bin are comparable to those in Nicaragua, whereas for the highest incomes, rates approach those of the higher income countries. The results of the data and fit to the model indicate a dependency other than household income that influences purchases, and it is reasonable to assume that these external variables are features of the national development situation. Two obvious candidate variables are urbanization rates and electrification levels. In addition, the overall level of income impacts the maturity of the market for appliances. For example, Mexico and Brazil both have for some time had a large domestic market for refrigerators, and both have developed a large degree of domestic production. This has a direct impact on the price and availability of appliances, which otherwise would be imported. More subtly, domestic production is likely to increase the mass-marketing of appliances, create a large market for used appliances, and generally affect the perception of the desire and necessity of these appliances. On average, for each level of household income, Mexican households are the most likely to own a refrigerator. Mexico also ranks highest in our list of countries in terms of household income, degree of urbanization, and percentage of electrification. Table 3 summarizes the relationship of these parameters to refrigerator ownership for all countries. Table 3 – Comparison of Refrigerator Ownership Rates Country Mexico Panama Brazil Peru South Africa Nicaragua
Income $US (2003) 1901 1390
Urb. % 75 56
Elec. % 95 69
Ownership % 71 54
Relative Ownership Reference -26%
1332 536
74 63
92 67
76 38
-4% -35%
786 334
51 56
56 61
40 18
-36% -43%
To illustrate this dependency, countries are listed in descending order of average household income of the survey sample. Relative ownership is defined as the difference with Mexico, averaged over all income bins, in contrast to national average ownership rate (also shown), which is dependent on the income distribution. Average household income is clearly a strongly determining factor, since Nicaragua, by far the poorest country in the sample shows dramatically less refrigerator ownership for the same income bins as the other countries. Brazilian ownership levels are quite close to Mexican ones, as this country has similarly high levels of electrification, and has a largely urban population. Panama, on the other hand, has a lower ownership rate, despite its high income. Finally, rates in Peru and South Africa are similar, apparently due to the fact that, although South Africa’s income is higher, urbanization and electrification rates are lower.
Determination of Global Model Parameters As shown in the previous section, refrigerator ownership can be reasonably modeled with a two-parameter function, but these must be determined for each country separately in order to provide sufficient modeling accuracy. In this section, we develop a parameterization which is generic for all countries, but takes macroeconomic and development variables as an input. A global parameterization is necessary for modeling ownership in countries for which household level data is not available, and for forecasting dependencies on macroeconomic development. In developing a global parameterisation, we keep in mind the advantage of employing variables for which data is readily available for a wide range of countries. The first variable investigated is national income level. Due to the unequal distribution of wealth, average incomes can be misleading. If the highest income households have a very high income compared to the lower quintiles, average national income can be pushed higher, while the percentage of people positioned for appliance ownership remains small. Distribution of income is shown in Figure 2.
5
Figure 2 - Distribution of Income Estimated Household Monthly Income by Quintile At Time of Survey 10000
2003 Dollars
1000
Lowest Quintile 2nd Quintile 3rd Quintile 4th Quintile 5th Quintile
100
10
1 Brazil - 1997
Mexico - 2000
Nicaragua - 2001
Panama - 2000
Peru - 1994
South Africa 1993
Source: World Bank
We hypothesize that the market is primarily affected by the general affluence of the bulk of the population. There are a variety of ways of paramaterizing this. We choose to use the average income of the third quintile of the population. Roughly speaking, half of the population enjoys this income or greater. Percentage of income held by quintile is publicly available for most countries (World Bank, Development Data Group) and therefore is a convenient modeling parameter. This can be combined with estimates of national income (GNI) to give an estimate of income of each quintile according to
Iq = 5 x GNISurveyYear x Pq Average income per household is derived from total Gross National Income(World Bank Data) in the year of the survey in constant dollars, with the number of persons per household taken from the survey data, q is the quintile index (from 1 to 5) and Pq is the percentage of income held by each quintile. It should be noted that the average income GNI and income distribution in this case is taken from World Bank estimates rather than the survey itself. In the case that the survey is not wholly representative in terms of income distribution, the World Bank data should give a more accurate picture of the level of wealth of the upper half of the population. In addition to national income levels, we expect that urbanization and electrification will have a strong influence on the ownership rate of low-income households. We note again that electrification, urbanization and income are all highly correlated. The lowest income households tend to be in rural areas, and these are also the most likely to lack connection to electric utilities. Therefore, there is some flexibility in arranging the parameters, but also there is some danger that successively adding parameters does not significantly improve the distinguishing power of the model. This correlation is reduced by the relation between parameters in the definition of rural electrification. Assuming that all urban households are electrified, an estimate of rural electrification is given by
RE = 1 −
1− E E −U = , 1−U 1−U
where E and U are is the national electrification and urbanization rates, respectively. In order to provide a model with country-independent parameters, we transform the variables α and β according to the country dependent variable relationships:
α → α (I3) = a I3 γ and β → β (RE) = b REδ where I3 is the income of the third quintile, and RE is the national electrification rate. The full econometric relation is then given by:
6
O = O
(I , I 3 , a , γ
,b,δ
)=
O
max
(
(aI
× 1 − exp
γ 3
× I
))
(bRE )δ
In making this transformation, we have eliminated the use of two independent parameters for each country in favor of new country variables (national income and rural electrification, in combination with two new countryindependent parameters. In mathematical terms, the effect of the transformation is to reduce twelve independent model parameters to four. Table 4 – Single- and Multi- Country Logit parameterisation of Refrigerator Ownership vs. Income Single Country Fit Country
Brazil 0.0023 0.557 0.009
Mexico 0.0016 0.333 0.006
Nicaragua 0.0006 0.811 0.009
Panama 0.0012 0.766 0.009
South Africa 0.0018 1.725 0.008
Peru 0.0018 1.567 0.009
0.900
0.913
0.887
0.898
0.912
0.907
Ι3
0.0016 0.32 0.24 -0.63 Brazil 0.740 0.921 0.696 0.887
Mexico 0.747 0.947 0.790 1.249
Nicaragua 0.561 0.608 0.106 0.148
Panama 0.562 0.690 0.293 0.900
South Africa 0.508 0.665 0.105 0.795
Peru 0.631 0.665 0.093 0.700
α(I3) β(RE) 1/N sqrt(Σ(x-x'))
0.0016 0.41 0.015
0.0017 0.37 0.007
0.0010 1.33 0.019
0.0016 0.70 0.030
0.0015 1.34 0.012
0.0015 1.45 0.018
R2
0.899
0.913
0.890
0.907
0.907
0.902
α β 1/N sqrt(Σ(x-x')) R2 Multi-Country Fit A B
γ δ Country U
Ε RE
The multi-country fit is performed by simultaneously minimizing the mean square deviation for all countries. In order to directly compare the shape of the curve in the single country vs. multi-country fit, Table 4 repeats the results from the single country fit, and lists the equivalent variables α and β, which are now a function of nationallevel variables. In general, the use of these variables explains the differences in income dependence and the overall shape of the curve described by the exponent. In particular, we can now interpret the very low value of α for Nicaragua as a result of the extreme poverty of this country, for which no significant market for refrigerators has been established, thus leading to low ownership levels even for households of relatively high income. On the other hand, Peru and South Africa are wealthier overall, but suffer from low rural electrification rates, thus suppressing ownership particularly at low incomes, as described by the exponent parameter β. Average deviation between model and data for each country is in the 1-2% range, with Panama being the least accurately modeled with an error of almost 3%. These errors are in absolute units, that is, a deviation of 2% implies that ownership rates modeled at 50% may actually be in the 48-52% range.
Forecast of Ownership Trends Construction of a global model allows for a rough projection of future ownership trends, which may be used as the foundation for a bottom-up assessment of growth in residential energy consumption. A backcast is first performed according to recent trends in per capita Gross National Income, assuming that the distribution of income given by the household surveys and the household size remain constant. Then, a forecast can be made using definite assumptions for growth in average income and rural electrification. The formula for average national ownership is
O = 0 . 2 ∑ O (I q , I 3 , a , γ , b , δ
)
where the sum is over income quintile, and Iq is now the average household income in each quintile.
7
Figure 3 –Refrigerator Ownership Rate Forecast to 2020 Projected Refrigerator Ownership Rate
100% 90% 80% 70% 60% 50% 40%
Brazil Mexico
30%
Nicaragua Panama
20%
Peru South Africa
10% 0% 1990
1995
2000
2005
2010
2015
2020
Figure 3 shows the results of the forecast, assuming a growth rate of 5% per annum in all countries, for both income and rural electrification. The parameters used for the forecast are rough, and do not take into account the different prospects for economic development in each country. Nevertheless, they may give some useful insight into one scenario for appliance stock growth. Some qualitative developments are apparent. First, the countries with moderate income, but lower electrification rates should experience a dramatic increase in ownership rates, nearly catching up to the richer countries by 2015-2020. Development in Nicaragua will also be quite rapid as incomes rise, but by the end of the forecast, incomes will still not be of the levels for which refrigerator ownership is nearly universal.
Other Appliances In order to fully forecast residential energy consumption trends, other appliances must also be considered. The survey data collected in our research was not detailed or complete enough to allow a full bottom-up accounting of appliance energy, but it does give some indication of the relative prevalence of particular energy-consuming products. Figure 4 shows the ownership rates of televisions, refrigerators, washing machines and air conditioners, along with the electrification rate of the survey sample. Figure 4 – Saturation Rates of Other Appliances 100% 90% 80% 70% 60% 50% 40% 30% 20% 10% 0% BRAZIL
Electrification
MEXICO
Television
NICARAGUA
Refrigerator
8
PANAMA
PERU
Washing Machine
SOUTH AFRICA
Air Conditioner
For the most part, the results are as one would expect. The rate of television ownership generally approaches the electrification rate3. There is a significant gap between the television and refrigerator rates, especially in the poorer countries. Washing machines can be seen as the next major appliance. There is quite a variation in the ratio of washing machine to refrigerator ownership, from 6% for Nicaragua to 66% for Panama. Air conditioning rates were available for Brazil, Nicaragua and Panama. Air conditioning is of particular interest in the study of energy growth in developing countries, as it is both an expensive and energy-intensive appliance. In addition, recent trends indicate annual growth in air conditioning in rapidly developing countries such as India at up to 20% (Economist 2004). Unfortunately, the limited data available on air conditioning was insufficient to allow for a meaningful analysis.
Conclusions This paper has presented an attempt to provide a generic model for appliance ownership in developing countries which may be useful in the development of multi-country forecasts of energy consumption in the residential sector. This approach differs from studies which either: take a top-down approach in the relationship of economic development to energy consumption (Reister 1987, Taddiqi 1994), or present detailed case studies of individual countries(Constantine 1999, Figueroa 1993, Pachauri 2004, Tatiétsé 2002). Many studies have been done towards bridging this gap for the industrialized country case, but the literature is sparse for developing countries. Our approach tries to contribute by providing the econometric framework from which further improvements can be made with more research into the great diversity of climatic, economic and cultural influences at work throughout the developing world. We believe that the results of modeling refrigerator ownership in developing countries using survey data is a good first step towards a more robust quantitative methodology, but its accuracy for any particular country is limited by its generic nature, which cannot duplicate the accuracy of a detailed case study. In addition, the accuracy of forecasts will depend on the availability of reliable predictions of economic growth, income distribution and rural development. Of course, accuracy will also depend on the robustness of the model we have put forward in this paper. To conclude, therefore, we suggest research that would most improve the current analysis. These are: Additional country datasets – A set of six countries is probably close to the minimum to produce the necessary variation to develop a global model. Data on more countries is highly desirable, especially in the middle income range, and covering several regions. Time-trend analysis – An implicit assumption in our model is that products do not become more attractive over time, and that there is no lag time between income growth and development of markets. Clearly, global markets for some products will have developed over the time gap between the time of the oldest and most recent survey (almost a decade). These effects can be investigated by comparing datasets from single countries in different years – datasets for multiple years are known to be available for many countries. More appliances – In principle, the same type of model as we have described for refrigerators is appropriate for other major appliances, but data is lacking in this area. A data search should be performed to develop independent models for laundry equipment, audio-visual equipment, water heating and heating and cooling appliances. The modelling of heating and cooling equipment will necessitate a parameterisation of climate variability between countries. Adjusted Income – We used estimates of income based on actual exchange rates, although we are aware that this does not necessarily represent the true purchasing power in each country. Purchase price parity (PPP) adjustment may also not be wholly appropriate, however, for modeling of major appliance purchases, especially in areas where imported products are common. A more accurate adjustment parameter should be developed to correctly equalize the ability to purchase products across countries.
References S. Constantine, A. D., S. Hakim, J.E. McMahon and G. Rosenquist (1999). Ghana Residential Energy Use and Appliance Ownership Survey. Lawrence Berkeley National Laboratory. Berkeley, CA. The Economist (2004). India Consumer Goods: Mixed potential for household goods., Economist Intelligence Unit. Euromonitor (2004). Domestic Electrical Appliances in India. Market Research Report. 3
In one case (Peru), the ownership rate of televisions actually exceeds the electrification rate. This is likely due to ambiguity in reporting electrification. Some households may not report a utility connection and/or may not use electricity primarily for lighting, but may have some connection to electricity which they use to power a television. 9
M.J. Figueroa and J. Sathaye (1993). Household Energy Use in Urban Venezuela: Implications from Surveys in Maracaibo, Valencia, Mérida, and Barcelona-Puerto La Cruz. Lawrence Berkeley National Laboratory. Berkeley, CA. S. Pachauri (2004). "An analysis of cross-sectional variations in total household energy requirements in India using micro survey data." Energy Policy 32(15): pp 1723-1735. D. B. Reister (1987) ”The Link Between Energy and GDP in Developing Countries” – Energy 12 (6), pp 427-433. P. Rumsey and T. Flanigan (1995). Asian Energy Efficiency Success Stories, International Institute for Energy Conservation. S. Taddiqi (1994) ”Implications for Energy and Climate-Change Policies of Using Purcharsing-Power-Parity-Based GDP”. Energy 19 (9) pp 975-981 T. T. Tatiétsé, P. Villeneuve, J. Ngundam and F. Kenfack (2002) Contribution to the analysis of urban residential electrical energy demand in developing countries” – Energy 27 (2002) , pp 591-606. K. Train, (2003). Discrete Choice Methods with Simulation, Cambridge University Press. P. Waide, B. Lebot and M. Hinnells (1997). "Appliance Energy Standards in Europe." Energy and Buildings 26(1): pp 45-67.
10