Forecasting Internet Traffic by Neural Networks Under Univariate and Multivariate Strategies Paulo Cortez1 , Miguel Rio2 , Pedro Sousa3 and Miguel Rocha3 1
2
Department of Information Systems/R&D Algoritmi Centre University of Minho, 4800-058 Guimar˜aes, Portugal
[email protected] http://www.dsi.uminho.pt/˜pcortez Department of Electronic and Electrical Engineering, University College London Torrington Place, WC1E 7JE, London, U.K.
[email protected] 3 Department of Informatics, University of Minho, 4710-059 Braga, Portugal {pns, mrocha}@di.uminho.pt
Abstract. By improving Internet traffic forecasting, more efficient TCP/IP traffic control and anomaly detection tools can be developed, leading to economic gains due to better resource management. In this paper, Neural Networks (NNs) are used to predict TCP/IP traffic for 39 links of the UK education and research network, under univariate and multivariate strategies. The former uses only past values of the forecasted link, while the latter also uses the traffic from neighbor links of the network topology. Several experiments were held by considering hourly real-world data. The Holt-Winters method was also tested in the comparison. Overall, the univariate NN approach produces the best forecasts for the backbone links, while a Dijkstra based NN multivariate strategy is the best option for the core to subnetwork links.
1 Introduction Internet traffic prediction is a key issue for understanding communication networks and optimizing resources (e.g. adaptive congestion control and proactive network management), allowing a better quality of service [1–3]. Moreover, traffic forecasting can help to detect anomalies (e.g. security attacks, viruses or an irregular amount of SPAM) by comparing the real traffic with the forecasts [4, 5]. TCP/IP traffic prediction is often done intuitively by network administrators, with the help of marketing information (e.g. future number of costumers) [1]. Yet, this may not be suited for serious day-to-day network administration and the alternative is to use Operational Research and Computer Science methods. In particular, the field of Time Series Forecasting (TSF), deals with the prediction of a chronologically ordered variable, where the goal is to model a complex system as a black-box, predicting its behavior based in historical data [6]. The TSF approaches can be divided into univariate and multivariate, depending if one or more variables are used. Multivariate methods are likely to produce better results, provided that the variables are correlated [7].
62 Several TSF methods have been proposed, such as the Holt-Winters [6] and Neural Networks (NN) [8, 3]. Holt-Winters was developed for series with trended and seasonal factors and more recently a double seasonal version has been proposed [9]. In contrast with the conventional TSF methods (e.g. Holt-Winters), NNs can predict nonlinear series. In the past, several studies have proved the predictability of network traffic by using similar methods. For instance, the Holt-Winters was used in [4, 10] and NNs have also been proposed [11, 5, 3]. However, these studies only considered univariate (or single link) data, thus not making use of the topology network. By using data from more than one link, there is a potential for better predictions. This study will use recent hourly data from the United Kingdom Education and Research Network (UKERNA) network. The network includes a backbone made up of 8 core routers that transport data through 21 regional subnetworks. In this paper, we will explore NNs and two multivariate approaches for data selection: using all direct neighbor links and selecting the most probable neighbor that is expected to influence the predicted link. The latter strategy is based in a novel heuristic that uses the Open Shortest Path First (OSPF) [12] protocol and Dijkstra algorithm. These approaches will be compared with the NN univariate case and also the classic Holt-Winters method. Furthermore, we will predict all UKERNA core to core and core to subnetwork links, in a total of 39 connections.
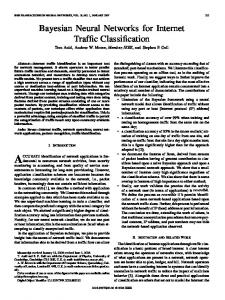
2 Internet Traffic Data This work will analyze traffic data (in Mbit/s) from the UK academic network backbone (UKERNA)4 , which includes eight core routers and 21 subregional networks. Figure 1 plots the respective direct graph, where bdd, sdd and cdd denote the links within the backbone core routers, core to subnetwork and subnetwork to core, respectively (d is a digit number). The data collection was based in the Simple Network Management Protocol (SNMP), which quantifies the traffic passing through every network interface with reasonable accuracy [13]. SNMP is widely deployed by every Internet Service Provider/network and the collection of this data does not induce any extra traffic on the network. In this work, we will adopt an hourly scale, denoting a short-term forecasting that is often used to for optimal control or detection of abnormal situations [14]. The data was recorded from 12 AM of 14th June 2006 to 12 AM of 23th July 2006. In total, there are 936 hourly observations for each link. The OSPF is the the most commonly used intra-domain routing protocol [12]. Under this protocol, every link contains a weight that is assigned by the network administrator. The Dijkstra algorithm is used to find the shortest paths between any two nodes of the network and these paths are then used by the routers to direct traffic. Most of the UKERNA OSPF weights are set to 10 and the few exceptions are listed in Figure 1. For instance, the OSPF weight between the core routers of Glasgow and Edinburgh is 100 (links b09 and b18); and the shortest path between Warrington and Edinburgh includes the links b07 and b18. 4
http://www.ja.net
63 UHI
s19
Clydenet
FatMAN
subnetwork
EastMAN
s03
s04
c19 s07 c04 c07 c03 s12 100 c01 s01 AbMAN NIRAN 150 c12 b09 b18 Glasgow Edinburgh b17 b07 NNW s13 100 100 c13 s14 NorMAN C&NLMAN s02 c02 b16 b08 c14 112 c20 s20 c21 s21 YMMAN NWMAN Warrington b15 b06 Leeds b04 b14 s06 MidMAN s11 EMMAN 111 c11 100 c06 b05 b13 s05 EastNET c05 s18 c18 c08 TVN s08 Reading b01 KentMAN London b12 100 c09 100 100 SWMAN s15 LMN s09 c15 b10 b03 backbone link s16 c16 SWERN1 100 core router
SWERN2
Bristol s17
b11 b02
c10
c17
Cosham s10 LeNSE
Fig. 1. The schematic of the UK academic Internet network.
As an example, the traffic of two neighbor links, Warrington-Glasgow (b07) and Glasgow-Clydenet (s05), is plotted in Figure 2. In both graphs, there are influences of two seasonal components due to the the intraday and intraweek cycles.
800
110 100
700
weekly cycle 90
weekly cycle
daily cycle
daily cycle
80
500
Traffic (Mbits/s)
Traffic (Mbits/s)
600
400
300
70 60 50 40
200 30 100
20
0
10 0
100
200
300
400
500
Time (hours)
600
700
800
900
0
100
200
300
400
500
600
700
800
900
Time (hours)
Fig. 2. The IP traffic for b07 (Warrington-Glasgow, left) and s03 (Glasgow-Clydenet, right) links.
64
3 Forecasting Methods A Time Series Forecasting (TSF) model assumes that past patterns will occur in the future. Let yt = (y1t , . . . , ykt ) denote a multivariate series, where yij is the jth chronological observation on variable i and k is the number of distinct time variables (k = 1 when a univariate setting is used). Then [7]: ybpt = F (y1t−1 , . . . , y1t−n , . . . , ykt−1 , . . . , ykt−n ) ept = ypt − ybpt
(1)
where ybpt denotes the estimated value for the pth variable and time t; F the underlying function of the forecasting model; and ept is the error (or residual). The overall performance of a model is evaluated by a global accuracy measure, namely the Root Mean Squared Error (RMSE) and Relative RMSE (RRMSE), given in the form [15]: qP P +N 2 RM SEp = i=P +1 epi /N (2) RRM SEp = RM SEp /RM SEypt × 100 (%) where P is the present time; N is the number of forecasts; and RM SEypt is the RM SE given by the simple mean prediction. The last metric (RRM SE) will be adopted in this work, since it has the advantage of being scale independent, where 100% denotes an error similar to the mean predictor (ypt ). Due to the temporal nature of this domain, a sequential holdout will be adopted for the forecasting evaluation. Hence, the first T R = 2/3 of the series will be used to fit (train) the forecasting models and the remaining last 1/3 to evaluate (test) the forecasting accuracies. Also, an internal holdout procedure will be used for model selection, where the training data will be further divided into training (2/3 of T R) and validation sets (1/3 of T R). The former will be used to fit the candidate models, while the latter will be used to select the models with the lowest error (RM SE). After this selection phase, the final model is readjusted using all training data. 3.1 Neural Networks Neural Networks (NNs) are innate candidates for forecasting due to their nonlinear and noise tolerance capabilities. Indeed, the use of NNs for TSF began in the late eighties with encouraging results and the field has been growing since [8, 14, 11, 3]. The multilayer perceptron is the most popular NN used within the forecasting domain [8, 11]. When adopting this architecture, TSF is achieved by using a sliding time window5. A sliding window is defined by the set of time lags used to build a forecast. For instance, given the univariate time series 1,2,3,4,5,6 and sliding window {1, 2, 4}, the following training examples can be built: 1, 3, 4 → 5 and 2, 4, 5 → 6. In a multivariate setting, k sliding windows are used: {L11 , . . . , L1W1 }, . . . , {Lk1 , . . . , LkWk }, where Lij denotes a time lag for the ith variable. In this work, a fully connected multilayer network with one hidden layer of H hidden nodes and bias connections will be adopted (Figure 3). The logistic activation 5
This combination is also named Time Lagged Feedforward Network (TLFN) in the literature.
65 Multivariate Series y1t time window 1
... y kt time window k
...
Input Layer y
j
1t−L11
...
y1t−L 1W1 ... ...
...
Hidden Layer wi,j +1
i +1 ...
+1
Output ypt
y kt−Lk1 ... ykt−L
kW k
Fig. 3. The multilayer perceptron architecture for multivariate time series forecasting.
function is applied on the hidden nodes and the output node uses a linear function [16]. In past work [3], this architecture outperformed conventional univariate methods such as Holt-Winters and ARMA models. The overall model is given in the form: P Pk PWs (3) ybpt = wo,0 + I+H r=1 yst−Lsr wi,j ) i=I+1 f ( s=1 where wd,s is the weight from node s to d; (if d = 0 then it is a bias connection); j ∈ {1, . . . , I} is an input node; o is the output node; and f the logistic function ( 1+e1−x ). Before training, all variables are scaled with a zero mean and one standard deviation. Then, the initial NN weights are randomly set within [−0.7, +0.7] [17]. Next, the training algorithm is applied and stopped when the error slope approaches zero or after a maximum of E epochs. Since the NN cost function is nonconvex (with multiple minima), N R runs are applied to each neural setup, being selected the NN with the lowest mean error [16]. After training, the NN outputs are rescaled to the original domain. Under this setting, the NN performance will depend on the number of hidden nodes (H), the selection of the k variables used in the multivariate model and the time window used for each variable. All these parameters can have a crucial effect in the forecasting performance. Feeding a NN with uncorrelated variables or time lags may affect the learning process due to the increase of noise. A NN with 0 hidden neurons can only learn linear relationships and it is equivalent to the classic Auto-Regressive (AR) model. By increasing the number of hidden neurons, more complex nonlinear functions can be learned but also it increases the probability of overfitting to the data and thus loosing the generalization capability. Since the search space for these parameters is high, heuristic procedures will be used during the model selection step. Three strategies are proposed for the variable selection: – Single-Link NN (SLNN), the simple univariate model where the predictions are based on the past values of the current link (p); – All Direct Neighbor Link NN (ADNN), based on p plus the previous traffic observed in all direct neighbor links that influence p; and – Dijkstra-Assisted NN (DANN), based on p plus the neighbor that is expected to influence more the predicted link under the OSPF protocol. First, the Dijkstra algo-
66 rithm is used to compute the shortest OSPF paths between all nodes of the network. Then, the subset with all paths that include p as an internal or end link is selected. Finally, the heuristic selects the most common6 direct preceeding neighbor of p in the subset. Regarding the multivariate methods, DANN selects only k = 2 variables, while ADNN uses a higher number of links (from 3 to 7). For instance, when forecasting the ReadingTVN (p=s18) traffic, the ADNN variable set is {s18,b05,b01}7 (Figure 1). There are 16 OSPF paths ending at TVN that include b05 and only 11 paths that go through b01. Hence, DANN will select the former (i.e. {s18, b05}). Based on previous univariate IP traffic forecasting work [3], a small range of hidden nodes will be tested, with H ∈ {0, 2, 4, 6}. Also, three sliding windows, based on the daily (K1 = 24) and weekly (K2 = 168) cycles, will be considered: w1 = {1, 24, 25}, w2 = {1, 168, 169} and w3 = {1, 24, 25, 168, 169}. In [3], this sliding window setup obtained high quality results. When a multivariate model is used, then the same window is applied to all links. 3.2 Holt-Winters Methods The Holt-Winters (HW) [6] is a popular univariate forecasting technique from the family of Exponential Smoothing methods. The predictive model is based on some underlying patterns such as a trend or a seasonal cycle (K1 ), which are distinguished from random noise by averaging the historical values. Its popularity is due to advantages such as the simplicity of use, the reduced computational demand and the accuracy of the forecasts, specially with seasonal series. The general model is defined by: yt Level St = α Dt−K + (1 − α)(St−1 + Tt−1 ) 1 Trend Tt = β(St − St−1 ) + (1 − β)Tt−1 Seasonality Dt = γ Sytt + (1 − γ)Dt−K1 ybpt = (St−1 + Tt−1 ) × Dt−K1
(4)
where St , Tt and Dt stand for the level, trend and seasonal estimates, K1 for the seasonal period, and α, β and γ for the model parameters. When there is no seasonal component, the γ is discarded and the Dt−K1 factor in the last equation is replaced by the unity. More recently, this method has been extended to encompass two seasonal cycles (K1 and K2 ) [9]. In this work, four HW variants will be tested in the model selection phase: n – non seasonal (K1 = 1); d – daily seasonal (K1 = 24); w – weekly seasonal (K1 = 168); and D – double seasonal (K1 = 24 and K2 = 168).
4 Experiments and Results The experiments were conducted off-line (i.e. after the data was collected) using the RMiner [18], an open source library for the R statistical environment [19]. In particular, 6 7
In case of a draw (which rarely occurs), the heuristic simply selects one of the contenders. The link c18 is not considered, since its origin (TVN) matches the link destination.
67 the RMiner uses the nnet package [17] to implement the NNs. The NNs were trained with E = 100 epochs of the BFGS algorithm [20], from the family of quasi-Newton methods and the number of runs was set to N R = 10. The HW initial values (e.g. level estimate) were set by averaging the early observations [9] and the internal parameters (e.g. α) were optimized using a 0.05 grid search for the best training error (RM SE). Since the intention is to compared univariate and multivariate approaches, only the links with preceding neighbors will be predicted, i.e., all sdd and bdd, in a total of 39 connections. The selected forecasting models for each method are shown in Table 1. For the HW, the weekly cycle is the most common model (w) and the double seasonal variant is never used. The weekly effect (w2 ) is also the most common case for strategy ADNN. In contrast, the majority of the SLNN and DANN methods use the double seasonal model (w3 ). Regarding the NN architectures, in general only linear models are selected. The 15 nonlinear exceptions (H > 0) are listed in the table. These results confirm the notion that short term IP traffic can be modeled by small networks. The forecasts with the selected models were performed on the test sets (with 312 elements) for all links shown in Table 1. Thirty runs were applied for the NNs and the results are shown as the mean RRM SE with the respective 95% t-student confidence intervals. The range of the best RRM SE values is high, showing that some links are much harder to predict than others (e.g. 14.1% for b10 versus 82.5% for s02). Overall, the HW is the worst strategy, since it is the best method for only 2 links (b05 and b14). Regarding the backbone links, the univariate approach (SLNN) is the best NN choice in 10 cases, followed by the ADNN (best in 7 links), while the DANN outperforms the other methods for only one link (b17). This scenario changes when considering the core to subnetwork links (sdd), where the DANN is the best method (with 12 wins), while both SLNN and ADNN achieve statistically significant lowest errors in 4 cases. For demonstrative purposes, the left of Figure 4 presents the average DANN traffic forecasts for the first 60 hours of the s03 series. In this case, a high quality fit is achieved, since the two curves are close. The observed (x-axis) versus the predicted values for a given run (y-axis) is also shown. In the figure, the forecasts (points) are near the diagonal line, which denotes the perfect forecast. Another relevant issue is related with the computational complexity. The proposed solution is very fast and can be used in real-time. For the example, with a Pentium Dual Core 3GHz processor, the DANN model selection phase took 12 seconds, while the 30 runs of the final NN training and testing required only 2.2 seconds.
5 Conclusions This work analyses the efficiency of several Neural Network (NN) approaches when applied to predict hourly TCP/IP traffic, collected from the United Kingdom Education and Research Network (UKERNA). In particular, three strategies were tested: SLNN – univariate approach based on past patterns from the current link; ADNN – which also includes the past values from all direct neighbors; and DANN – a novel approach that includes only one link neighbor, whose selection is based on the Dijkstra algorithm and OSPF protocol. Also, a comparison was made with the Holt-Winters (HW) method, which is popular for seasonal series.
68 Table 1. The forecasting RRM SE errors and selected models (in brackets). Link SLNN ADNN DANN HW b01 24.8±0.0 (w3 ) 23.9±0.0 (w2 ) 25.0±0.0 (w3 ) 25.2 (w) b02 63.2±0.0 (w1 ) 89.5±0.0 (w2 ) 63.4±0.0 (w1 ) 68.7 (n) b03 22.1±0.0 (w3 ) 22.1±0.0 (w2 ) 22.2±0.0 (w3 ) 27.8 (d) b04 21.3±0.0 (w3 ) 21.5±0.0 (w2 ) 22.2±0.0 (w2 ) 25.2 (w) b05 34.1±0.0 (w3 ) 34.7±0.0 (w2 ) 35.7±0.0 (w2 ) 34.0 (w) b06 86.6±2.7 (w1 , H=4) 58.1±0.0 (w1 ) 58.4±0.0 (w3 ) 69.0 (w) b07 19.7±0.0 (w3 ) 30.6±0.0 (w3 ) 20.3±0.0 (w3 ) 25.1 (w) b08 40.7±0.0 (w2 ) 40.7±0.0 (w2 ) 41.2±0.0 (w2 ) 44.3 (w) b09 56.5±0.0 (w2 ) 57.2±0.0 (w2 ) 57.5±0.0 (w2 ) 67.5 (w) b10 14.1±0.0 (w3 ) 17.7±0.0 (w2 ) 15.4±0.0 (w3 ) 15.0 (w) b11 54.1±0.0 (w3 ) 57.3±0.9 (w3 , H=2) 54.3±0.0 (w2 ) 58.0 (n) b12 62.7±5.9 (w2 , H=2) 36.1±0.0 (w1 ) 74.6±0.0 (w3 ) 45.4 (w) b13 30.5±0.0 (w3 ) 31.2±0.0 (w2 ) 30.6±0.0 (w3 ) 31.7 (w) b14 19.5±0.0 (w3 ) 19.4±0.0 (w3 ) 19.5±0.0 (w3 ) 19.0 (w) b15 79.9±0.0 (w3 ) 78.7±0.0 (w2 ) 80.4±0.0 (w3 ) 87.0 (n) b16 48.0±1.0 (w2 , H=4) 37.5±0.0 (w2 ) 38.7±0.0 (w3 ) 39.4 (w) 30.1 (w) b17 31.5±0.8 (w3 , H=2) 57.5±3.1 (w1 ) 28.3±0.0 (w3 ) b18 57.3±0.0 (w3 ) 59.2±0.0 (w2 , H=6) 58.4±0.0 (w3 ) 80.8 (w) s01 42.3±0.4 (w2 , H=2) 47.5±2.7 (w2 , H=2) 41.8±0.0 (w2 ) 45.1 (w) s02 82.8±0.0 (w3 ) 85.2±0.0 (w2 ) 82.5±0.0 (w3 ) 91.9 (w) 37.3 (d) s03 33.6±0.0 (w3 ) 34.6±0.0 (w3 ) 32.4±0.0 (w3 ) s04 41.3±0.1 (w2 , H=2) 41.4±0.0 (w2 ) 41.8±0.0 (w2 ) 48.0 (w) 41.6±0.0 (w1 ) 42.0±0.0 (w3 ) 47.5 (w) s05 41.4±0.0 (w3 ) s06 39.6±0.0 (w3 ) 38.3±0.0 (w2 ) 38.2±0.0 (w3 ) 44.1 (w) 42.9±0.0 (w2 ) 51.7 (w) s07 45.1±0.0 (w2 ) 42.8±0.0 (w2 ) s08 27.5±0.0 (w3 ) 28.9±0.0 (w2 ) 28.3±0.0 (w3 ) 34.9 (w) s09 28.6±0.0 (w3 ) 27.3±0.0 (w2 ) 28.3±0.0 (w3 ) 36.5 (w) 38.6±0.0 (w3 ) 33.2 (w) s10 35.9±0.5 (w2 , H=6) 32.8±0.0 (w3 ) s11 68.4±0.0 (w3 ) 69.6±0.0 (w1 ) 71.2±1.2 (w2 , H=2) 74.5 (n) s12 71.8±8.3 (w3 , H=4) 69.0±0.0 (w2 ) 56.7±0.0 (w3 ) 65.4 (w) s13 48.1±0.0 (w2 ) 44.7±0.0 (w2 ) 44.7±0.0 (w2 ) 47.7 (w) 37.9 (w) s14 36.8±0.0 (w3 ) 43.8±0.0 (w1 ) 34.0±0.0 (w2 ) s15 26.5±0.0 (w3 ) 24.9±0.0 (w2 ) 23.6±0.0 (w3 ) 27.2 (w) s16 33.4±0.0 (w3 ) 33.8±0.0 (w2 ) 32.3±0.0 (w3 ) 36.0 (d) s17 28.3±0.5 (w2 , H=2) 26.7±0.0 (w3 ) 25.5±0.0 (w3 ) 32.2 (n) s18 54.2±0.0 (w2 ) 53.2±0.0 (w3 ) 51.9±0.0 (w3 ) 54.7 (n) s19 39.8±0.0 (w2 ) 41.1±0.0 (w3 ) 40.1±0.0 (w2 ) 39.9 (w) s20 64.7±0.2 (w3 , H=2) 65.4±0.0 (w2 ) 61.3±0.0 (w3 ) 70.7 (d) 32.9 (w) s21 34.2±0.3 (w3 , H=2) 40.6±0.0 (w3 ) 32.6±0.0 (w3 ) bold – statistical significance under a pairwise comparison with other NN methods. underline – best model.
A large number of experiments was conducted, with a total of 39 forecasted links. Overall, the NN results are quite competitive, outperforming the HW model in all except two cases. Regarding the univariate versus multivariate comparison, the results
60
69 60 s03 values DANN forecasts
50
55
40
45
40
30
Traffic (Mbits/s)
50
20
35
30
10
25
20 10
20
30 Time (x 1 hour)
40
50
60
10
20
30
40
50
60
Fig. 4. Example of the forecasts (left) and observed versus predicted values scatter plot (right).
differ according to the link characteristics. Within the backbone links, the SLNN is the best option in 10 of the 18 series, while DANN only excels other strategies for one connection (b17 of Figure 1). However, for the core to subnetwork links, the multivariate DANN strategy provides the best forecasts in 12 of 21 cases, while SLNN achieves the best performance in only 4 links. These results may be explained by the nature of the network topology. The core to subnetwork links are peripheral funnels, thus they are more likely to be influenced by one single neighbor. In contrast, the core routers are large carriers, i.e., they direct traffic from/to a larger number of nodes. Since small networks were selected, the NNs are very fast and can be applied in realtime. Thus, the proposed approach opens room for producing better traffic engineering tools and methods to detect anomalies in the traffic patterns. This can be achieved without producing any extra traffic in the network and with minimal use of computation resources, since this work was designed assuming a passive monitoring system. In future work, the comparison will be extended to other forecasting techniques (e.g. ARMA models [21]). Moreover, the proposed approach will be applied to traffic demands of specific Internet applications, such as Voice over Internet Protocol (VoIP). Another promising direction is to explore incomplete information scenarios. For instance, to see if it is possible to forecast the backbone link traffic using only the subnetwork to core connections, i.e., without knowing the past values of the predicted links.
Acknowledgements This work is supported by the FCT project PTDC/EIA/64541/2006. We would also like to thank Steve Williams from UKERNA for providing us with part of the data used in this work.
70
References 1. K. Papagiannaki, N. Taft, Z. Zhang, and C. Diot. Long-Term Forecasting of Internet Backbone Traffic. IEEE Trans. on Neural Networks, 16(5):1110–1124, September 2005. 2. V. Alarcon-Aquino and J. Barria. Multiresolution FIR Neural-Network-Based Learning Algorithm Applied to Network Traffic Prediction. IEEE Trans. on Systems, Man and Cybernetics - Part C, 36(2):208–220, 2006. 3. P. Cortez, M. Rio, M. Rocha, and P. Sousa. Internet Traffic Forecasting using Neural Networks. In Proceedings of the IEEE 2006 International Joint Conference on Neural Networks, pages 4942–4949, Vancouver, Canada, 2006. 4. B. Krishnamurthy, S. Sen, Y. Zhang, and Y. Chen. Sketch-based Change Detection: Methods, Evaluation, and Applications. In Proc. of Internet Measurment Conference (IMC’03), Miami, USA, October 2003. ACM. 5. J. Jiang and S. Papavassiliou. Detecting Network Attacks in the Internet via Statistical Network Traffic Normality Prediction. Journal of Network and Systems Management, 12:51–72, 2004. 6. S. Makridakis, S. Weelwright, and R. Hyndman. Forecasting: Methods and Applications. John Wiley & Sons, New York, USA, 1998. 7. G. Reinsel. Elements of Multivariate Time Series Analysis. Springer, San Francisco, CA, second edition, 2003. 8. A. Lapedes and R. Farber. Non-Linear Signal Processing Using Neural Networks: Prediction and System Modelling. Tech. Rep. LA-UR-87-2662, Los Alamos National Laboratory, USA, 1987. 9. J. Taylor, L. Menezes, and P. McSharry. A Comparison of Univariate Methods for Forecasting Electricity Demand Up to a Day Ahead. Int. Journal of Forecasting, 21(1):1–16, 2006. 10. Q. He, C. Dovrolis, and M. Ammar. On the Predictability of Large Transfer TCP Throughput. In Proc. of SIGCOMM’05, Philadelphia, USA, August 2005. ACM. 11. H. Tong, C. Li, and J. He. Boosting Feed-Forward Neural Network for Internet Traffic Prediction. In Proc. of the IEEE 3rd Int. Conf. on Machine Learning and Cybernetics, pages 3129–3134, Shanghai, China, August 2004. 12. T.M. ThomasII. OSPF Network Design Solutions. Cisco Press, 1998. 13. W. Stallings. SNMP, SNMPv2, SNMPv3 and RMON 1 and 2. Addison Wesley, 1999. 14. X. Ding, S. Canu, and T. Denoeux. Neural network based models for forecasting. In Proc. of Applied Decision Technologies Conf. (ADT’95), pages 243–252, Uxbridge, UK, 1995. 15. I.H. Witten and E. Frank. Data Mining: Practical Machine Learning Tools and Techniques with Java Implementations. Morgan Kaufmann, San Francisco, CA, second edition, 2005. 16. T. Hastie, R. Tibshirani, and J. Friedman. The Elements of Statistical Learning: Data Mining, Inference, and Prediction. Springer-Verlag, NY, USA, 2001. 17. W. Venables and B. Ripley. Modern Applied Statistics with S. Springer, 4th edition, 2003. 18. P. Cortez. RMiner: Data Mining with Neural Networks and Support Vector Machines using R. In R. Rajesh (Ed.), Introduction to Advanced Scientific Softwares and Toolboxes, IAEng publishers, Singapore, In Press. 19. R Development Core Team. R: A language and environment for statistical computing. R Foundation for Statistical Computing, Vienna, Austria, 2007. ISBN 3-900051-00-3. 20. M. Moller. A scaled conjugate gradient algorithm for fast supervised learning. Neural Networks, 6(4):525–533, 1993. 21. G. Box and G. Jenkins. Time Series Analysis: Forecasting and Control. Holden Day, USA, 1976.