I.J. Education and Management Engineering, 2017, 1, 36-45 Published Online January 2017 in MECS (http://www.mecs-press.net) DOI: 10.5815/ijeme.2017.01.04 Available online at http://www.mecs-press.net/ijeme
Framework for Targeting High Value Customers and Potential Churn Customers in Telecom using Big Data Analytics Inderpreet Singh a, Sukhpal Singh b a
b
Engineer- Product Development, Mahindra Comviva, Gurgaon- 122001, Haryana, India Computer Science and Engineering Department, Thapar University-147001, Patiala, Punjab, India
Abstract Since the more importance is played on customer’s behavior in today’s business market, telecom companies are not only focusing on customer’s profitability to increase their market share but also on their potential churn customers who could terminate the relation with the company in near future. Big data promises to promote growth and increase efficiency and profitability across the entire telecom value chain. This paper presents a framework for targeting high value customers and potential churn customers. Firstly, customers are segmented on basis of RFM (Recency-Frequency-Monetary) analysis and finally customers in each segment are targeted by various offers on basis of their similar characteristics. Index Terms: Customer Segmentation, Telecom, Big Data Analytics, RFM Analysis, Data Mining, Customer Value. © 2017 Published by MECS Publisher. Selection and/or peer review under responsibility of the Research Association of Modern Education and Computer Science.
1. Introduction Customer equity plays an important role in today’s environment. Many organizations are now focusing on analyzing the big data related to customer for improving profitability and market share [3]. Due to rise in complexity and competition in current business scenario, organizations need to develop activities that are innovative to capture the needs of customer and retention [11]. Service providers that are trying to compete in the cutthroat world of telecom services – where more and more subscribers rely on over-the-top players as providers of value-added services – are focused on increasing revenues, reducing churn, reducing opex, and enhancing the customer experience [18]. Big data is phrase for data sets that are so huge and complicated, making it difficult to process by traditional data processing applications. The size of these data sets is increasing day by day making it harder to store, analyze and unleash its full potential [17]. * Corresponding author: Tel.: +919855500543 E-mail address:
[email protected]
Framework for Targeting High Value Customers and Potential Churn Customers in Telecom using Big Data Analytics
37
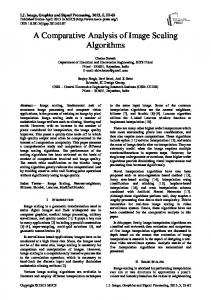
During recent years, smart phones have become our universal and most itinerant computing resource. The transformations in smart phones have made it prone to wide range of applications [1]. At present every operator is looking for various ways of leveraging data to increase the revenues and market share [19] [20]. But they want to take care of unstructured data along with the structured data to understand the consumer behavior. So that they could gain competitive edge in the market. Gartner forecasted mobile data growth to reach at 52 million terabytes in 2015 i.e. an increase of 59 percent from the year 2014 [2]. More than 600 million tweets are produced on Twitter on each day [21]. About 800 million members of Facebook are active on daily basis. Imagine the data produced by their posts, comments or chats [23]. Most operators run analysis on their internal data to raise the efficiency of their networks, do the customer segmentation and get profit [22]. But the main challenge that they face is how to combine the enormous amount of information to increase the profits across entire industry, from customer satisfaction to product development and sales etc. [4]. The objective of this paper is to provide a framework to telecom companies for getting competitive edge in the market by identifying not only their high value customers but also potential churn customers. In this paper, firstly we group the customers in various segments on basis of structured and unstructured data sets. Then finally, we target the customers in high value and potential churn segment. The customers in different segments are targeted on basis of different offers made specifically for them. The paper is organized as follows. Section 2 presents related work. The various types of data sets needed and how to tap them is explained in the section 3, 4 and 6. The section 7 explains what the RFM (RecencyFrequency-Monetary) analysis is and it is done on the collected data as mentioned in section 8.Then, finally section 9 explains the methods to target the high value and potential churn customers found through the RFM analysis done in previous sections. Section 10 presents conclusion and future scope of the paper. 2. Related Work In [12], authors discussed about the system which selects eligible users for predefined promotion and then analyzing the Caller Detail Records, while rapidly escalating subscriber base. In our paper, we are analyzing customers on various data sets and then targeting the high value and potential churn segment of the customers. In [13], authors explains the big data platform for processing and visualization of large data files for telecom companies. In addition to this they also have designed Distributed File Descriptor (DFD) for passing information between the modules of platform i.e. Domain Specific Language (DSL), Parallel Processing/Analyzing Platform for Big Data and an Integrated Result Viewer. While in [14], authors proposed the practical application of data mining in customer segmentation under the data environment of telecommunication industry. They have done on basis of cluster analysis. In [15], authors addresses the Social position of each customer in a network and Equivalence approaches. Social position which is evaluated by finding the centrality of a node identified through a number of connections. While regular equivalence analysis seeks to classify customers as churners and non-churners based on the patterns. Finally in [16], authors explains how both decision tree and neural network techniques can deliver accurate churn prediction models by using various data sets. 3. Structured And Unstructured Data By Structured data we mean data that can be allocated to particular fields and can be handled by computing resources [4]. It has great degree of organization, so it can be inserted into relational databases very smoothly (Fig. 1). The perfection of its structure makes compilation easy and fast task. Whereas by unstructured data we mean the data that has irregularities and ambiguities making it difficult to handle by traditional resources. Unstructured data doesn’t fits into data models defined prior. The significant amount of data comes from unstructured data category and it’s the tough task for any organization to make use of this unstructured data
Framework for Targeting High Value Customers and Potential Churn Customers in Telecom using Big Data Analytics
38
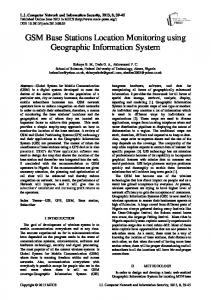
along with the structured data to get better insights of consumers in the market (Fig. 2).
Fig.1. Structured Data and Unstructured Data [5]
Fig.2. Structured Data and Unstructured Data [5]
4. Various Types Of Data Needed To make profile of each and every consumer telecom companies need to gather various types of data, so that segmentation on consumer market can be performed efficiently. And based on this segmentation we can target the customers with various types of offers suitable for his or her needs. The set of structured data that we need to make costumer profile is as mentioned in the below table (Table 1.), Table 1. Set of Structured Data Structured Data S.No Data Needed
Purpose Of Data
1
Name
Basic Information
2
Age
3
Income
4
Number Of Minutes Used
5
Number Of Messages
6
International Calls
7
Internet Data Usage
Differentiate Consumer on basis of sex Differentiate consumer profiles on basic high income, average income and low income Total Duration Of calls, used for targeting on basis of call plans Details of messages sent and received, used for targeting on basis of message packs Total Duration of international calls, used for targeting on basis of International Call Plans Details of data used, used for targeting on basis of data packs
Framework for Targeting High Value Customers and Potential Churn Customers in Telecom using Big Data Analytics
39
Along with the set of structured data we also need set of unstructured data to make customer profile. Thus, helping us in making creative insights of consumer market. So, the set of unstructured data that we need to make costumer profile is as mentioned in Table 2. Table 2. Set of Unstructured Data Unstructured Data S.No Data Needed 1
Call centre interaction
2 3 4
Geo spatial XDR-extended data records Social Media Data
Purpose Of Data Details customer complaints and feedback i.e. How much satisfied is the customer is To target particular geography in the city captures data of purchase and download of apps etc. To study consumer behaviour from social network
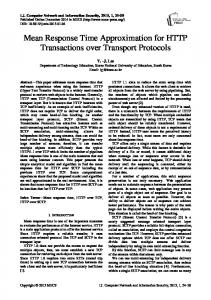
5. Need To Address 3V Challenge Doug Laney [6] was first to characterize 3V’s of big data. These are variety, volume and velocity. In other words, high variety, volume and velocity are the parameters of data that characterize it as a big data (Fig. 3). The size of data set can range from few petabytes to many Exabyte’s.
Fig.3. 3V’s of Big Data
5.1. Variety The first characteristic of data is the growing need to use variety of data, i.e. now data represent number of data domains and types. And given the large range of data types it is difficult to integrate the data for its use in analysis. Like we have to integrate both the structured and unstructured data on basis of which we will be analyzing the consumer market. 5.2. Volume Volume is most associated with the big data. 90% of world’s data ever generated was generated in past two years [7]. If this trend continues then by 2020, data generated will be three times than the data generated till 2011. This huge volume of data presents biggest challenge to conventional information structures. Hence companies find it difficult to store this much large volume of data.
40
Framework for Targeting High Value Customers and Potential Churn Customers in Telecom using Big Data Analytics
5.3. Velocity The speed at which data is generated, stored, analyzed and visualized is represented by velocity of data. In this era, data is being created at the real time and the problem faced by the companies is to give real time solutions to this data. 6. How To Get Data- Structured And Unstructured The general problem faced by the companies is to tap the unstructured data. While the structured data can be collected and stored easily in well-defined data model e.g. RDBMS, unstructured data doesn’t has any particular format. In case of telecom operators, the structured data can be easily collected from the customer information form, which the customer fills when he gets registered. And the structured data like number of minutes used, amount of internet data used can be easily collected from the transaction resources which operators usually have in form of databases. Unstructured data like geo spatial information can be taken from two sources. The first one is by satellite i.e. GPS (Global Positioning System).GPS provides precise location and time information in all types of weather conditions. And other one is by Wi-Fi Positioning System as within buildings GPS doesn’t work well because of obstructions in the line of sight with the satellites [10]. Wi-Fi Positioning System is used where GPS is inadequate. So, by getting information from two sources operator will be precise in determining the exact location of customer. Social media data could be fetched through Twitter API’s or customer post on Facebook page of telecom operator etc. 7. RFM Analysis RFM analysis guide the organization to analyze the customer value on basis of which organization can predict which customers are likely to respond as well as that will not respond to their offer. Each customer is evaluated on basis of recency, frequency and monetary value in RFM analysis. In simple words, RFM is technique of marketing analysis which is used to examine which customers are best ones by examining how recent customer has made purchase (Recency), how much often they purchase (Frequency) and how much he or she spends (Monetary). It is based on market law that ―80% of business comes from 20% of your customers‖. The three inputs that make the RFM scores are Recency- What was the time when the customer had made purchase with your organization. A customer who recently contacts your organization is more likely to accept another interaction. Frequency-How often does this customer make purchases with your organization. It can predict the schedule of purchases which will be made by customer in future. Monetary-How much total amount customer spend on your organization products in the given time period. Customers are then given the ratings on the basis of these three input parameters. The higher the RFM analysis score, the higher is the customer value for your organization. Now telecom operators can generate RFM scores individually for the various parameters. After that, they can use these scores not only to retain the higher value customers but also to gain the potential churn customers back. 8. Calculating RFM Score To calculate RFM scores we have divided the three input parameters to five subcategories. Initially we have
Framework for Targeting High Value Customers and Potential Churn Customers in Telecom using Big Data Analytics
41
found the scores of recency and frequency inputs and then combine these scores with the third input i.e. monetary to get overall RFM analysis score. The various subcategories under the input variables are: 8.1. Recency (Number of days) Here we have divided the customers into different recency categories (Table 3.) according to the number of days since the last transaction. With R1 as customers who have not made transaction with the organization since 121 or more days and R5 as customers who have made transaction with the organization within 30 days or less etc. Table 3. Evaluation Criteria for Recency Score
R5
R4
R3
R2
R1
=121
8.2. Frequency (Number of times) In this we have divided the customers into different frequency categories (Table 4.). According to the total number of times he or she has made transaction with the organization within last 6 months. F1 as customers who have made less than or equal to 2 transactions in last 6 months and F5 as customers who have made greater than or equal to 11 transactions in last 6 months. Table 4. Evaluation Criteria for Frequency Score
F1 =11
8.3. Monetary(In INR) In this we have divided the customers into different monetary categories (Table 5.) according to the total amount that he or she has paid for transactions with the organization within last 6 months. F1 as customers who have paid less than or equal 100 (INR) transactions in last 6 months and F5 as customers who have paid greater than or equal 10000 (INR) transactions in last 6 months. Here, INR- Indian Rupee. Table 5. Evaluation Criteria for Monetary Score M1
M2
M3
M4
M5
=10000
Calculating RF scores (Table 6.),
42
Framework for Targeting High Value Customers and Potential Churn Customers in Telecom using Big Data Analytics
Table 6. Evaluation Creteria for RF(Recency-Frequency) Score Frequency Rank
F1
F2
F3
F4
F5
R1
R1F1
R1F2
R1F3
R1F4
R1F5
R2
R2F1
R2F2
R2F3
R2F4
R2F5
R3
R3F1
R3F2
R3F3
R3F4
R3F5
R4
R4F1
R4F2
R4F3
R4F4
R4F5
R5
R5F1
R5F2
R5F3
R5F4
R5F5
Recency
On the basis of RF scores calculated above, we are calculating the RFM scores (Table 7.), Table 7. Evaluation Criteria for RFM Score
9. Customer Segmentation And Targeting Them 9.1. Customer Segmentation Customer segmentation involves dividing a customer base into the different subsets where customers of specific subset have similar interest and spending habits [8]. On basis of RFM scores as calculated above we can divide the customers into two segments. High Value Customers These are the clients on which operator’s profitability depends. Without them operator will lose its share in
Framework for Targeting High Value Customers and Potential Churn Customers in Telecom using Big Data Analytics
43
the telecom market and competitive advantage. These clients are paid proper care and attention from the operator. Potential churn Customers Potential churn customers are those customers that can cease or end their relation with the operator. The total cost (1) associated with these potential churn customers if they cease their relationship is Total Cost (Customer Churn) = Lost Revenue + Marketing Cost
(1)
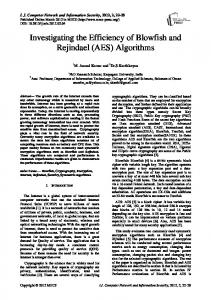
Lost revenue is the revenue that these customers could generate, had they not ceased their relationship with operator. Marketing cost is the cost associated with the replacement of these customers with new ones [9]. 9.2. Targeting the customers By calculating the RFM score, individually for the case of total time spent on calls and internet data pack’s total data. We have recognized the high value customers as well as potential churn customers. But in today’s world most of the persons get pack of telecom operator services which include both call rate and internet data amount. Sudden exceptions to this are the persons who only use operator services for Internet or Calls not both of them. So, to target customers (Table 8.) on basis of these things we need to look at both the RFM scores of total time of calls and amount of internet data. Table 8. Criteria to Target Customers
Total time of calls
Rank +
Internet Data + High
Mid
-
Mid
Low
High- Customers using large internet data and spending much time on calls. Mid- Customers using both mediocre internet data and spending time on calls. Low- Customers using less internet data and spending less on calls. High users can be targeted by the use of loyalty points and personalized offers specially designed for them, as they are the key for the telecom operator’s competitive edge in the market, for the mid or mediocre users operators can give offers based on combination of both call rates and data pack and for the low users operators can give offers that tend to cause these users to use more services provided by the operators e.g. free local calls to same telecom operator mobile numbers at late night etc. For potential churn customers i.e. ―Low‖ mentioned in Table 8, combine RFM score with the unstructured data like social media data and call center feedback data to predict them very accurately. Potential churn customers should also be considered seriously by the telecom operators due to revenue and marketing cost associated with both of them. So, telecom operator must give offers like free talk time and data pack for specific time period e.g. 200MB data for 3 days, in order to retain them. 10. Conclusion And Future Work
Framework for Targeting High Value Customers and Potential Churn Customers in Telecom using Big Data Analytics
44
This paper discussed the approach that how could telecom operators can collect the data, analyze it and segment their customers to gain competitive advantage in the market. Customer segmentation not only helps the telecom operators to know their high value customers on which their profitability and market share depends, but also to recognize the potential churn customers who are likely to cease their relationship with the operator. It also discusses the methods to target these high value customers and potential churn customers. Big data used effectively has the potential to revolutionize the way telecom operators build, run and market their services. The presented framework can be used to help the telecom operators in analytics related practices. Some open issues that need special attention in future research are, Approach to integrate above framework with the real time analytics to target customer on basis of location, time etc. in real time. To make versatile model for telecom sector that can be used to target customers on basis of different conditional inputs.
References [1] [2] [3] [4] [5] [6] [7] [8] [9] [10] [11]
[12]
[13]
[14]
[15]
Goggin, G. Cell phone culture: Mobile technology in everyday life. Routledge, (2012). ―Gartner Forecasts 59 Percent Mobile Data Growth Worldwide In 2015". 2016. Gartner.Com. http://www.gartner.com/newsroom/id/3098617. Acker, O., Blockus, A. and Pötscher, F. "Benefiting from big data: A new approach for the telecom industry." Strategy&, Analysis Report (2013). Baars, H. and Kemper, H.G. "Management support with structured and unstructured data—an integrated business intelligence framework." Information Systems Management 25, no. 2 (2008): pp 132-148. The Executive’s Guide to Big Data & Apache Hadoop written by Robert D. Schneider; Page9. Laney, D. "3D data management: Controlling data volume, velocity and variety." META Group Research Note 6 (2001): pp 70. Data, Big. "for better or worse: 90% of world’s data generated over last two years." SCIENCE DAILY, May 22 (2013). "What Is Customer Segmentation? - Definition from WhatIs.com." SearchSalesforce. Accessed August 20, 2016. http://searchsalesforce.techtarget.com/definition/customer-segmentation. "Customer Churn Software: Prediction, Prevention & Analysis | Optimove". 2016. Optimove. http://www.optimove.com/learning-center/customer-churn-prediction-and-prevention. Li, B., Mumford, P., Dempster, A.G. and Rizos, C. "Secure User Plan Location (SUPL): concept and performance," GPS Solutions, vol. 14, pp. 153, (2010). Chuang, H.M. and Shen, C.C. "A study on the applications of data mining techniques to enhance customer lifetime value—based on the department store industry." In 2008 International Conference on Machine Learning and Cybernetics, vol. 1, pp. 168-173. IEEE, (2008). Jayawardhana, P., Perera, D., Kumara, A. and Paranawithana, A "Kanthaka: Big Data Caller Detail Record (CDR) Analyzer for Near Real Time Telecom Promotions." In 2013 4th International Conference on Intelligent Systems, Modelling and Simulation, pp. 534-538. IEEE, (2013). Şenbalcı, C., Altuntaş, S., Bozkus, Z. and Arsan, T. "Big data platform development with a domain specific language for telecom industries." In 2013 High Capacity Optical Networks and Emerging/Enabling Technologies, pp. 116-120. IEEE, (2013). Shi, J.Y. and Li, L.L. "The Research of Data Mining in Telecom Data Warehouse." In System Science, Engineering Design and Manufacturing Informatization (ICSEM), 2010 International Conference on, vol. 2, pp. 239-242. IEEE, (2010). Shobha, G. "Social network classifier for churn prediction in telecom data." In Advanced Computing
Framework for Targeting High Value Customers and Potential Churn Customers in Telecom using Big Data Analytics
[16] [17] [18] [19] [20] [21] [22]
[23]
45
and Communication Systems (ICACCS), 2013 International Conference on, pp. 1-7. IEEE, (2013). Hung, S.Y., Yen, D.C. and Wang. "Applying data mining to telecom churn management." Expert Systems with Applications 31, no. 3 (2006): pp. 515-524. Singh, S. and Chana, I. ―EARTH: Energy-aware autonomic resource scheduling in cloud computing.‖ Journal of Intelligent & Fuzzy Systems Vol. 30, no. 3 (2016): pp. 1581-1600 Singh, S. and Chana, I. ―Resource provisioning and scheduling in clouds: QoS perspective.‖ The Journal of Supercomputing Vol. 72, no. 3 (2016): pp. 926-960. Singh, S. and Chana, I. "QoS-aware autonomic resource management in cloud computing: a systematic review." ACM Computing Surveys (CSUR) Vol. 48, no. 3 (2016): pp. 42. Singh, S. and Chana, I. ―QRSF: QoS-aware resource scheduling framework in cloud computing‖, ―The Journal of Supercomputing‖, [Springer], Vol. 71, no. 1, pp: 241-292, 2015. Ahmed T. "Cloud Computing a Solution for Globalization", International Journal of Education and Management Engineering (IJEME), Vol.6, No.4, pp.30-38, 2016.DOI: 10.5815/ijeme.2016.04.04. Herrera J. M., González J. V. and Fillad L.L. "Web System Proposal for Control and Monitoring Fleets", International Journal of Education and Management Engineering (IJEME), Vol.6, No.1, pp.1-10, 2016.DOI: 10.5815/ijeme.2016.01.01. Kolo K.D., Adepoju S.A. and Alhassan J.K.,"A Decision Tree Approach for Predicting Students Academic Performance", International Journal of Education and Management Engineering (IJEME), Vol.5, No.5, pp.12-19, 2015.DOI: 10.5815/ijeme.2015.05.02.
Authors’ Profiles Inderpreet Singh has obtained the Degree of Bachelor of Engineering in Computer Science from Thapar University, Patiala. Presently, he is working as an Engineer-Product Development in Mahindra Comviva, Gurgaon. He has done certifications in PostgreSQL, Cloud Computing and Python Fundamentals. His research interests include Analytics, Data Mining, Predictive Modeling and Cloud Computing.
Sukhpal Singh joined Computer Science and Engineering Department of Thapar University, Patiala, India, in 2016 as Lecturer. Dr. Singh obtained the Degree of Master of Engineering in Software Engineering from Thapar University, as well as a Doctoral Degree specialization in ―Autonomic Cloud Computing‖ from Thapar University, Dr. Singh received the Gold Medal in Master of Engineering in Software Engineering. Dr. Singh is a DST Inspire Fellow [2013-2016] and worked as a SRF-Professional on DST Project, Government of India. He has done certifications in Cloud Computing Fundamentals, including Introduction to Cloud Computing and Aneka Platform (US Patented) by ManjraSoft Pty Ltd, Australia and Certification of Rational Software Architect (RSA) by IBM India. His research interests include Software Engineering, Cloud Computing, Operating System and Databases. He has more than 30 research publications in reputed journals and conferences.
How to cite this paper: Inderpreet Singh, Sukhpal Singh,"Framework for Targeting High Value Customers and Potential Churn Customers in Telecom using Big Data Analytics", International Journal of Education and Management Engineering(IJEME), Vol.7, No.1, pp.36-45, 2017.DOI: 10.5815/ijeme.2017.01.04