and high power density, it is constructive to combine the fuel cell with an ...... between converter's output voltage and battery's OCV: (a) bus voltage (b) load.
Fuel Cell Distributed Generation: Power Conditioning, Control and Energy Management by
Hani Fadali
A thesis presented to the University of Waterloo in fulfillment of the thesis requirement for the degree of Master of Applied Science in Electrical and Computer Engineering
Waterloo, Ontario, Canada, 2008
©Hani Fadali 2008
Author’s Declaration I hereby declare that I am the sole author of this thesis. This is a true copy of the thesis, including any required final revisions, as accepted by my examiners. I understand that my thesis may be made electronically available to the public.
ii
Abstract Distributed generation is expected to play a significant role in remedying the many shortcomings in today’s energy market. In particular, fuel cell power generation will play a big part due to several advantages. Still, it is faced with its own challenges to tap into its potential as a solution to the crisis.
The responsibilities of the Power
Conditioning Unit (PCU), and thus its design, are therefore complex, yet critical to the fuel cell system’s performance and ability to meet the requirements. To this end, the dc-dc converter, considered the most critical component of the PCU for optimum performance, is closely examined. The selected converter is first modeled to gain insight into its behavior for the purpose of designing suitable compensators. MATLAB is then used to study the results using the frequency domain, and it was observed that the converter offers its own unique challenges in terms of closed-loop performance and stability. These limitations must therefore be carefully accounted for and compensated against when designing the control loops to achieve the desired objectives. Negative feedback control to ensure robustness is then discussed. The insertion of a second inner loop in Current Mode Control (CMC) offers several key advantages over single-loop Voltage Mode Control (VMC). Furthermore, the insertion of a Current Error Amplifier (CEA) in Average Current Mode Control (ACMC) helps overcome many of the problems present in Peak Current Mode Control (PCMC) whilst allowing much needed design flexibility. It is therefore well suited for this application in an attempt to improve the dynamic behavior and overcoming the shortcomings inherent in the converter. The modulator and controller for ACMC are then modeled separately and combined with the converter’s model previously derived to form the complete smallsignal model. A suitable compensation network is selected based on the models and corresponding Bode plots used to assess the system’s performance and stability. The resulting Bode iii
plot for the complete system verifies that the design objectives are clearly met. The complete system was also built in MATLAB/Simulink, and subjected to external disturbances in the form of stepped load changes. The results confirm the system’s excellent behavior despite the disturbance, and the effectiveness of the control strategy in conjunction with the derived models. To meet the demand in many applications for power sources with high energy density and high power density, it is constructive to combine the fuel cell with an Energy Storage System (ESS). The hybrid system results in a synergistic system that brings about numerous potential advantages. Nevertheless, in order to reap these potential benefits and avoid detrimental effects to the components, a suitable configuration and control strategy to regulate the power flow amongst the various sources is of utmost importance. A robust and flexible control strategy that allows direct implementation of the ACMC scheme is devised. The excellent performance and versatility of the proposed system and control strategy are once again verified using simulations. Finally, experimental tests are also conducted to validate the results presented in the dissertation. A scalable and modular test station is built that allows an efficient and effective design and testing process of the research.
The results show good
correspondence and performance of the models and control design derived throughout the thesis.
iv
Acknowledgments First and foremost I would like to thank Allah for giving me the drive, ability and patience to seek the completion of this dissertation. I would also like to thank my parents and brothers for their continued and loving support throughout my years at university. I would like to express my sincere gratitude to my supervisor, Dr. Ehab El-Saadany, for the opportunity, his encouragement, patience and faith in my abilities through my undergraduate years and extended graduate studies. I also thank my colleagues and professors in the Power Distribution System Group for the many open forums for discussion and exchange of knowledge. My thanks go out as well to Dr. Michael Fowler and the students in the chemical engineering department, especially Matt Stevens, for their assistance in the laboratory while performing the experimental research. Finally, I would like to thank Mr. David Mewdell and Smith + Andersen for their interest, support and investing their time and money in me. My appreciation goes out to NSERC as well for their financial assistance.
v
To my Family.
vi
Table of Contents
Author’s Declaration ........................................................................................................ ii Abstract............................................................................................................................. iii Acknowledgments ............................................................................................................. v Dedication ......................................................................................................................... vi Table of Contents ............................................................................................................ vii List of Figures.................................................................................................................... x List of Tables ................................................................................................................... xii List of Acronyms ............................................................................................................ xiii Chapter 1 Introduction..................................................................................................... 1 1.1
Background ......................................................................................................... 1
1.2
Distributed Generation........................................................................................ 2
1.3
Fuel Cells ............................................................................................................ 4 1.3.1 Various Types of Fuel Cell Technologies ........................................................ 5 1.3.2 Basic Operation of Proton Exchange Membrane Fuel Cell ............................. 7 1.3.3 Operating Characteristics ................................................................................. 8 1.3.4 Power Conditioning........................................................................................ 10
1.4
Motivation and Objectives................................................................................ 12
1.5
Outline............................................................................................................... 15
Chapter 2 DC-DC Boost Converter .............................................................................. 22 2.1
Introduction....................................................................................................... 22
2.2
Boost Operation ................................................................................................ 23
2.3
Power Converter Dynamic Modeling ............................................................... 25 2.3.1 Introduction .................................................................................................... 25 vii
2.3.2 State-Space Modeling..................................................................................... 26 2.4
Assessment........................................................................................................ 40
Chapter 3 Average Current Mode Control .................................................................. 42 3.1
Introduction....................................................................................................... 42 3.1.1 Closed-Loop Control ...................................................................................... 45 3.1.2 Current Mode Control Implementations ........................................................ 47
3.2
Modeling Average Current Mode Control........................................................ 49 3.2.1 Introduction .................................................................................................... 49 3.2.2 Principles of Operation................................................................................... 50 3.2.3 Modeling Method ........................................................................................... 52 3.2.4 Complete Small-Signal Model and Characteristics........................................ 54
3.3
Feedback Loop Compensation.......................................................................... 59 3.3.1 Introduction .................................................................................................... 59 3.3.2 Compensating Networks ................................................................................ 59 3.3.3 Designing the Optimum Control Loops ......................................................... 62
3.4
Simulations ....................................................................................................... 73
3.5
Assessment........................................................................................................ 76
Chapter 4 Hybrid Power System................................................................................... 78 4.1
Introduction....................................................................................................... 78
4.2
Energy Storage Systems ................................................................................... 79
4.3
Topology ........................................................................................................... 81 4.3.1 Introduction .................................................................................................... 81 4.3.2 Active Hybrid Configuration.......................................................................... 82 4.3.3 Fuel Cell Dc-Dc Boost Converter .................................................................. 85 4.3.4 Battery Characteristics ................................................................................... 86
4.4
Control Strategy ................................................................................................ 87 4.4.1 Introduction .................................................................................................... 87 4.4.2 Control Objectives.......................................................................................... 88
4.5
Simulations ....................................................................................................... 91 viii
4.6
Assessment........................................................................................................ 96
Chapter 5 Experimental Results.................................................................................... 98 5.1
Introduction....................................................................................................... 98
5.2
Experimental Set-up.......................................................................................... 98 5.2.1 Hybrid Test Station ...................................................................................... 100
5.3
Experimental Results ...................................................................................... 104 5.3.1 Converter Modeling...................................................................................... 104 5.3.2 Fuel Cell Dynamics ...................................................................................... 106 5.3.3 Hybrid Dynamics ......................................................................................... 108
5.4
Assessment...................................................................................................... 111
Chapter 6 Conclusions.................................................................................................. 112 6.1
Contributions................................................................................................... 114
Appendix A State-Space Matrices for Boost Converter Dynamic Model ............... 115 Appendix B Additional Simulations Results for Hybrid System.............................. 118 References...................................................................................................................... 120
ix
List of Figures Figure 1.1: Basic PEMFC operation.................................................................................. 8 Figure 1.2: Fuel cell system efficiency and power as a function of current for the Ballard Nexa Power Module. ................................................................................................ 10 Figure 1.3: Thesis flow chart. .......................................................................................... 21 Figure 2.1: Basic dc-dc boost converter topology ........................................................... 24 Figure 2.2: Two circuit states for boost converter: (a) switch is on (b) switch is off. ..... 27 Figure 2.3: Dc-dc converter topology for dynamic modeling. ........................................ 33 Figure 2.4: Two switched circuit models of bi-directional converter: (a) bottom (boost) switch on (b) top (buck) switch on. .......................................................................... 34 Figure 2.5: Bode plot for duty cycle-to-output voltage transfer function........................ 37 Figure 2.6:
Bode plot for duty cycle-to-output voltage transfer function: proposed
converter taking into account the components’ parasitics versus ideal converter with no parasitics. ............................................................................................................. 38 Figure 2.7: Bode plot for duty cycle-to-inductor current transfer function. .................... 39 Figure 3.1: Main control schemes for dc-dc converters: a) Voltage Mode Control; b) Current Mode Control............................................................................................... 44 Figure 3.2: Boost converter schematic with ACMC........................................................ 51 Figure 3.3: Small-signal model of ACMC....................................................................... 54 Figure 3.4: Bode plot for current loop-gain and phase .................................................... 57 Figure 3.5: Bode plot for control-to-output transfer function.......................................... 58 Figure 3.6: Current compensator and modulator. ............................................................ 62 Figure 3.7: Root locus plot for duty cycle-to-output voltage transfer function. .............. 66 Figure 3.8: Bode plot for current loop compensator........................................................ 67 Figure 3.9: Root locus plot for control-to-output voltage transfer function . .................. 68 Figure 3.10: Voltage compensator implementation......................................................... 69 Figure 3.11: Bode plot for input-to-output voltage transfer function. ............................. 70 Figure 3.12: Simulated boost converter: (a) topology (b) control loop. ........................ 74 Figure 3.13: Simulated boost converter’s response to a load current step: (a) load current x
supplied by converter (b) bus voltage. ..................................................................... 75 Figure 4.1: Fuel cell connected directly to battery. ......................................................... 82 Figure 4.2: Active hybrid configuration 1: load connected to battery............................ 83 Figure 4.3: Active hybrid configuration 2: load connected to fuel cell. ......................... 84 Figure 4.4: Model of experimental boost converter with fuel cell. ................................. 86 Figure 4.5: Relationship between battery’s SOC and OCV for Genesis batteries .......... 87 Figure 4.6: Equivalent circuit for approximation of battery’s OCV in normal operating range.......................................................................................................................... 87 Figure 4.7: Simulated hybrid system: (a) schematic (b) control loop............................ 92 Figure 4.8: Simulated hybrid system’s response to step load change: (a) bus voltage (b) load current (c) battery current (d) fuel cell current.................................................. 93 Figure 4.9: Simulated hybrid system consisting of two fuel cells. .................................. 94 Figure 4.10: Simulated hybrid system’s response to step load change: (a) bus voltage (b) fuel cell currents........................................................................................................ 95 Figure 5.1: Function generator and oscilloscope. ............................................................ 99 Figure 5.2: Test station. ................................................................................................. 102 Figure 5.3: Test station wiring diagram......................................................................... 103 Figure 5.4: Fuel cell Labview interface. ........................................................................ 104 Figure 5.5: Bode plot for input-to-output voltage transfer function: experimental versus theoretical results. ................................................................................................... 106 Figure 5.6: Experimental fuel cell’s response to step load change................................ 107 Figure 5.7: Experimental hybrid system’s response to step load change. ..................... 109 Figure 5.8: Experimental hybrid system’s response to step load change: zoom in. ...... 110 Figure B.1: Simulated hybrid system’s response to step load change with mismatch between converter’s output voltage and battery’s OCV: (a) bus voltage (b) load current (c) battery current (d) fuel cell current…………………………………....119
xi
List of Tables Table 1.1: Comparison of fuel cell with various conventional distributed generation technologies. ............................................................................................................... 3 Table 1.2: Summary of various fuel cell technologies ...................................................... 6 Table 2.1: Converter power components for dynamic analysis....................................... 34 Table 3.1: Converter’s power components for simulation............................................... 74 Table 5.1: Test station components. .............................................................................. 100
xii
List of Acronyms AC ACMC AFC
Alternating Current Average Current Mode Control Alkaline Fuel Cell
CCM CEA CHP CMC
Continuous Conduction Mode Current Error Amplifier Combined Heat and Power Current Mode Control
dB DC DCM
Decibel Direct Current Discontinuous Conduction Mode
ESR ESS
Equivalent Series Resistance Energy Storage System
LHP LHV
Left-Hand Plane Lower Heating Value
MCFC
Molten Carbonate Fuel Cell
NMP
Non-Minimal Phase
OCV OEM
Open-Circuit Voltage Original Equipment Manufacturer
PAFC PCMC PCU PD PEMFC PID PWM
Phosphoric Acid Fuel Cell Peak Current Mode Control Power Conditioning Unit Proportional-plus-Derivative Proton Exchange Membrane Fuel Cell Proportional-plus-Integral-plus-Derivative Pulse-Width Modulation
RHP
Right-Hand Plane
SOC SOFC
State Of Charge Solid Oxide Fuel Cell
VEA VMC VRLA
Voltage Error Amplifier Voltage Mode Control Valve Regulated Lead Acid xiii
Chapter 1 Introduction
1.1
Background
Environmental concern is now driving the use of renewable and clean energy. The electric energy demands are ever increasing, yet with limited transmission lines, many obstacles for new capacity and steady progress in power deregulation and utility restructuring have all contributed to distributed generation becoming ever more popular. Fuel cell power generation is expected to play a big part due to several advantages, such as reusability of exhaust heat, high efficiency, low environmental pollution, fuel diversity and modularity. Fuel cells are generally characterized by the type of electrolyte they use, resulting in five major types of fuel cells in current technology for use in the industry. The Proton Exchange Membrane Fuel Cell (PEMFC) in particular is being rapidly developed as the main power source in many applications due to its high energy density, low operating temperature, and rigid yet simple structure. Nevertheless, the fuel cell has its own challenges in order to meet the demand for high energy efficiency and availability. The fuel cell’s far from ideal operating characteristics as a conventional power source necessitate the use of a suitable Power Conditioning Unit (PCU) to process its output power. The challenge for the PCU is to maximize the fuel cell’s overall performance, power output, quality and efficiency from a low-voltage, high-current, slow-responding source. Unless efficient means can be found to transfer the energy from the fuel cell to
1
where it is requested, its potential will be untapped.
1.2
Distributed Generation
Distributed generation represents a small-scale electric power source connected directly to the utility’s distribution network, and provides electric power at a site closer to the customers, rather than through lengthy transmission lines spanning from central power stations. The capacity scale of distributed generators range from several kilowatts to the 50 megawatts range. With the deregulation and liberalization in the market, the number and capacity of small to medium scale distributed generators is expected to increase significantly in the near future [1,2]. Many factors have affected the ability to supply energy economically and reliably, thereby sparking a change in the way the market had traditionally operated. Money is the common denominator of the problems as is commonly the case, with the associated high cost of fuel, as well as labor, equipment, land and borrowing money to maintain and upgrade the electric utility supply.
Environmental and regulatory action has also
contributed, resulting in delay of construction permits and expensive air quality treatment required to meet the standards.
The aforementioned has also led to the lack of
maintaining and construction of nuclear stations. All the above is further complicated by the basic fact that electric energy cannot be stored, and the installed capacity must meet the demand at all times, thereby requiring that the capacity be sized large enough to meet the peak demand that is only requested for a few hours of the day, for a few months of the year. Distributed generation can provide alternative solutions to the energy crisis that are more cost-effective, environmentally friendly, and with higher power quality and reliability than conventional solutions. Its services include standby generation, peak shaving, base2
load generation, or cogeneration. For businesses, distributed generation can reduce peak demand charges, overall energy use and emissions, and ensure good power quality and reliability. For large utilities and power producers, distributed generation can augment overall system reliability, avoid large investments in transmission lines upgrades and the associated transmission losses, closely match capacity increases to demand growth, and supply demand more efficiently in remote areas. Various technologies are available for distributed generation, such as internal combustion engines/generators, micro/mini-turbines and of course fuel cells amongst others. A brief overview of some conventional technologies is shown in Table 1.1 for comparison purposes [3]. Table 1.1: Comparison of fuel cell with various conventional distributed generation technologies.
Size (MW) OEM ($/kWh) Electric Efficiency (%)
Diesel
Micro-
Mini-
Engine
Turbine
Turbine
0.05 – 6
0.03 – 0.5
0.5 – 10
Fuel Cell
0.001- 3
0.005 – 0.015 0.004 – 0.010 0.003 – 0.008 0.002 – 0.015 33 – 43
18 – 32
21 – 40
40 – 60
80 – 90
200 – 350
250 – 600
60 – 350
Overall Efficiency (%)2
80 – 85
80 – 85
80 – 90
80 - 85
Availability (%)
90 – 93
90 – 98
90 – 98
> 95
0.023
0.023
0.028
0.084
(LHV)
1
Usable CHP Temp. (Degrees C)
Footprint (Sq m/kW) 1
Electric Efficiency Lower Heating Value (LHV): net electric output at LHV
2
Overall Efficiency: the sum of the electric and thermal outputs assuming Combined
Heat and Power (CHP)
3
1.3
Fuel Cells
Steady progress in market deregulation and new legislations in terms of environmental constraints and greenhouse gas emissions have created a significant opportunity for distributed generation.
Rising public awareness for ecological protection and
continuously increasing energy consumption, coupled with the shortage of power generation due to constraints imposed on new construction have further resulted in a steady rise in interest in renewable and clean power generation. Fuel cell technologies are expected to play a significant role in overcoming the many challenges faced by the power market to satisfy the ever-increasing energy needs [4,5,6]. Fuel cells offer numerous advantages over conventional power plants to help them achieve that goal and widespread adoption, such as: •
High efficiency, even at part-load
•
Few moving parts resulting in quiet operation, higher reliability, lower maintenance and longer operating life
•
Fuel diversity
•
Zero or low emission of greenhouse gases
•
Combined Heat and Power (CHP) capability, without the need for additional systems (i.e., low temperature fuel cells can provide district heating while high temperature fuel cells can provide high-quality industrial steam)
•
Flexible, modular structure
•
Increased energy security by reducing reliance on large central power plants and oil imports
Fuel cells also provide several advantages over renewable technologies, such as wind turbines and photovoltaic power generation. These include the ability to be placed at any site in a distribution system without geographic limitations to provide optimal benefit, and they are not intermittent in nature.
4
1.3.1 Various Types of Fuel Cell Technologies
Several different types of fuel cells exist, each using a different chemistry.
The
technologies are generally characterized by the type of electrolyte they use, which also determines their operating temperature. Aqueous electrolytes are limited to temperatures below 200°C due to their high water vapor pressure and/or rapid degradation at high temperatures [7]. The operating temperature further affects the type of fuel that can be used. Low-temperature fuel cells with aqueous electrolytes are mostly restricted to the use of hydrogen as the fuel. In high-temperature fuel cells, other hydrocarbons may be used due to the inherently faster electrode kinetics. There are five major types of fuel cells being commercially developed. Among these five, Alkaline Fuel Cells (AFC) are the oldest design and have been used in the NASA space program since the 1960s [8]. Nevertheless, it is very expensive and susceptible to contamination, thus requiring hydrogen and oxygen in their purest form as even the smallest amounts of dirt would destroy the cell.
They are well suited to closed
environments containing their own supplies of hydrogen and oxygen, such as space travel and submarine engines. Proton Exchange Membrane Fuel Cells (PEMFC) have good power density and response time, and are considered the most promising technology, thus being developed for use in various applications. Phosphoric Acid Fuel Cells (PAFC) are very tolerant to impurities in the fuel steam and very similar to the PEMFC in terms of construction. However, due to poor ionic conduction, it is comparatively larger and weighty resulting in increased cost [8]. The phosphoric acid also effloresces irreversibly (i.e., becomes powdery) when the temperature sinks below 42°C and the cell becomes unusable. Still, its high operating temperature makes it well suited for co-generation. Solid Oxide Fuel Cells (SOFC) also operate at high temperature and use a ceramic material as electrolyte, resulting in a complete solid-state design and can operate without a reformer. The high temperature however also affects the reliability of the system. Finally, Molten Carbonate Fuel Cells (MCFC) operate at slightly lower temperature than the SOFC, which in turn reduces the need for exotic materials and thus also the price. Their high quality heat also makes them well suited for CHP applications. 5
A
summary of the various fuel cell technologies is shown in Table 1.2. Table 1.2: Summary of various fuel cell technologies Type
Electrolyte
PEMFC
Solid Polymer
Charge
Operating
Carrier
Temperature
H+
~ 80°C
Fuel
Pure H2
(e.g. Nafion)
Efficiency
Power Range/
(System)
Application
35 – 45%
Automotive, CHP
(tolerates CO2)
(5 – 250 kW), portable
AFC
PAFC
Aqueous
OH-
Pure H2
~ 100°C
35 – 65%
< 5 kW, niche
Potassium
markets (military,
Hydroxide
space)
Phosphoric
H+
Pure H2
~ 200°C
Acid
40 – 45%
CHP (200 kW)
50 – 60%
2 kW – MW
(tolerates CO2, ~1% CO)
SOFC
Solid Oxide
O2-
~ 1000°C
Electrolyte
MCFC
Lithium &
2−
CO 3
H2, CO, CH4, hydrocarbons
range, CHP and
(tolerates CO2)
stand-alone
H2, CO, CH4,
~ 650°C
50 – 60%
2 kW – MW
Potassium
hydrocarbons
range, CHP and
Carbonate
(tolerates CO2)
stand-alone
The PEMFC is chosen due to its high power density, which is an order of magnitude higher than other types of fuel cells with the exception of the AFC [1,9]. This is partially a result of the intense research and development in this fuel cell technology over the last decade.
It also has a lower operating temperature, allowing for fast start-up and has a
simple and composite structure, resulting in relatively high durability. Finally, compared to the other fuel cell technologies, the PEMFC has the ability to rapidly adjust to power demand changes.
6
1.3.2 Basic Operation of Proton Exchange Membrane Fuel Cell
A fuel cell is an electrochemical device that continuously converts chemical energy into electric energy with some heat, as long as the fuel and oxidant are supplied. This process, along with the various components, is illustrated in Figure 1.1 for the PEMFC. Most fuel cells in use today utilize hydrogen and oxygen as chemicals.
Gaseous
hydrogen is the most popular due to its high reactivity when suitable catalysts are used, its ability to be produced from hydrocarbons and its high energy density for storage. Similarly, the most common oxidant is gaseous oxygen as it is readily and economically available from air and is easily stored. At the anode (negative electrode), hydrogen is oxidized to provide electrons and hydrogen ions. Hydrogen ions travel from the anode to the cathode via an electrolyte. However, because the electrolyte is a non-electronic conductor, the electrons can only flow from the anode to the cathode (positive electrode) via the external circuit. At the cathode, oxygen reacts with the incoming electrons and the hydrogen ions to produce water. The equations for the reactions are given in (1.1). Another familiar electrochemical device is the battery. The difference between fuel cells and batteries is that in batteries all the chemicals are stored inside, which means that they eventually vanish and the battery must be thrown away or recharged. On the other hand, a fuel cell will operate continuously as long as it is supplied with fuel. Still, of course, its lifetime is practically limited due to degradation such as corrosion and malfunction of components.
7
Catalyst
Catalyst
Oxygen from Air Hydrogen from Tank
Proton Exchange Membrane Exhaust
Electrical Current
Figure 1.1: Basic PEMFC operation. Anode :
H 2 → 2 H + + 2e −
Cathode : 1 / 2O2 + 2 H + + 2e − → H 2O Overall :
H 2 + 1 / 2O2 → H 2O
(1.1)
1.3.3 Operating Characteristics
As the fuel cell is operated to supply electrical energy, various mechanisms lead to ‘irreversible’ losses that further cause its output voltage to fluctuate. There are three main causes for the losses: 1) Activation losses 2) Ohmic losses 3) Concentration losses These losses cause the cell voltage to be less than the ideal potential, and each are dominant at different current densities. Activation losses are dominant at low currents to overcome electronic barriers in order to transfer electrons to and from the electrodes, and 8
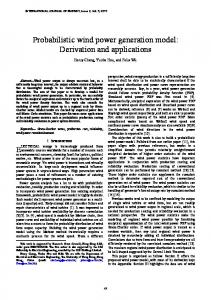
result in a non-linear drop. As the current increases within the normal range, the ohmic losses become more important due to the resistance to the flow of electrons through the electrodes and also include the resistance to the proton flow through the electrolytes. The curve shows a fairly linear characterization through this range. Finally, concentration losses take over at high currents due to the difficulty associated with supplying enough reactant flow to the cell reaction, causing the cell voltage to decrease rapidly. This operating region should obviously be avoided. These various loss mechanisms should be accounted for when deriving the fuel cell model. The net system efficiency and power output as a function of current for the 1.2 kilowatt PEMFC used for experimental demonstration is shown in Figure 1.2. The plot represents the fuel cell operating in its normal range, as illustrated by the reasonably linear curves. One can note the tradeoff between output power, where it is desired to maximize the output of the fuel cell, and efficiency, where higher efficiency can be attained at lower output levels.
This conflict amongst others will be reviewed in Chapter 4 when
developing suitable control strategies that maximize the performance of the system.
9
Figure 1.2: Fuel cell system efficiency and power as a function of current for the Ballard Nexa Power Module.
1.3.4 Power Conditioning
A fuel cell generates direct current (dc) power. This power must be controlled in terms of voltage and current to adequately supply the load. In addition, if it is to supply alternating current (ac) loads, dc-ac inversion is required along with frequency control. Nevertheless, the power conditioning at the dc side prior to inversion is the most critical in terms of effectively meeting the fuel cell’s requirements and managing its operation to meet the load demand. Once the constraints and design objectives are satisfied in terms of regulation and energy management, the dc power may then be inverted using a simple dc-ac inverter with basic control to synchronize with the grid and manage the output active and reactive powers, whilst still achieving improved performance. Previous papers have attempted to bypass this stage in hope of improving cost and reliability. This causes 10
the power sharing to be passively determined between the power sources, the bus voltage to not be regulated and instead follow the battery’s discharge curve [10,11,12]. Moreover, other work has attempted to control the fuel cell current through the long time constant of the hydrogen delivery system [9,13] or even attempt to actively control the sources using derived inverters such as the Z-source [14,15]. Still, tradeoffs exist and inclusion of the dc conversion stage is necessary for superior performance and flexibility, as will be demonstrated. Additionally, for the given application, the converter fulfills important requirements in association with the fuel cell, as will be described in the following paragraph.
Hence, this dissertation will be concerned with the power
conditioning at the dc level. Furthermore, a step-up, or boost converter is chosen for the power conversion for better efficiency by reducing the current, and thus the losses, and also since designing fuel cell stacks for higher voltages is less efficient [9]. With this in mind, the PCU is required to have the following characteristics to supplement the fuel cell’s operation [3, 4, 9]: •
Output voltage regulation at desired value as dictated by specific application
•
Wide input regulation due to fuel cell’s significant output voltage dependency on current
•
Process power to meet load demand in terms of requested voltage and current
•
Protect fuel cell against various disturbances in system, including stepped load changes, which lead to stack lifetime degradation
•
Reduce ripple in current and voltage fed back to fuel cell, which also leads to lifetime degradation
•
Avoid reversal of current polarity under all circumstances
•
High efficiency and reliability
•
Stable operation despite external disturbances
•
Active and accurate power sharing amongst power sources in case of multiple sources operating in parallel
•
Improved system dynamics and output power quality
11
•
Low cost
Although the PCU can be seen as a factor that adds to the cost of the fuel cell power plant and reduces efficiency due to the losses in the solid-state devices, it can also be seen as a way of adding value to the plant by improving the performance, stability, reliability and even the efficiency and cost of the power plant. Still, as fuel cells become more widely used, it is becoming more and more apparent that there is a gap in the power conversion electronics market for the application of fuel cells [16].
1.4
Motivation and Objectives
The deregulation and restructuring of utilities is leading to a massive and rapid industry change with new methods of energy supply. This has opened the door for a wide deployment of distributed generation, in particular fuel cells, to meet the ever-increasing energy demands despite the many constraints and shortcomings in today’s market. Nevertheless, the fuel cell is faced with its own constraints and shortcomings, and research must be performed in this area to overcome these obstacles and tap into the fuel cell’s potential and its deployment as a solution to the current energy crisis. In particular, the fuel cell is limited by its far from ideal operation as a power source, which includes its slower dynamics and poor output voltage regulation.
It is also
sensitive to various disturbances in the system, such as current/voltage ripple and repetitive abrupt load changes.
The design of the PCU to compensate for these
limitations is therefore a major challenge, yet critical to the fuel cell’s overall performance and its applicability, and cannot be overlooked, as is too often the case when performing ‘fuel cell research’. Opportunities to add value to the system through the use of the PCU must also be taken advantage of to improve the system and thus justify the
12
added cost. The PCU is thus chosen as the central topic of this dissertation. Central to the PCU itself and its success is the dc-dc converter that is connected directly to the fuel cell and is therefore the most sensitive to its behavior, which must in turn ensure its safe operation and extended lifetime as well as its adequate performance and ability to meet the demand requirements. Yet, some papers have bypassed this converter stage altogether and use only a dc-ac inverter in an attempt to improve efficiency and reduce complexity and cost. Still, it is more effective to properly and ‘actively’ manage the power flow from the various sources at the dc level using a dc-dc converter rather than allowing the power sharing to be determined passively amongst the sources based on their relative impedance characteristics, as will be further discussed in Chapter 4. Attempting to control the power sharing through the hydrogen delivery system or through the dc-ac inverter offers its own challenges and setbacks as well, and superior performance can only be attained through the inclusion of a dc-dc converter. To this end, a suitable dc-dc converter must first be devised that meets the given constraints for the application. The converter must then be suitably modeled in order to gain insight into its behavior. A wide variety of models exist, many of which are made too complex without any added accuracy, which also hinders the design of the control loops. In this dissertation, a mathematical description is sought that is accurate, yet simple enough to design suitable compensators and provides the opportunity for the use of well-developed control techniques to attain the desired response characteristics. Similarly, a suitable model of the fuel cell that incorporates its dynamics when connected to a switching mode circuit must be used in order to determine the conditions for its interface and analyze the overall performance of the PCU. A suitable control scheme must then be applied to satisfy the load with the requested dynamics despite changes in the system’s parameters. The dc-dc boost converter offers its own challenges in terms of closed-loop performance and stability and thus sophisticated control processes must be developed. Equally important is designing the compensators with the specific application in mind and incorporating the fuel cell’s 13
unique limitations in the process rather than deriving a generic control scheme. The closed-loop control method must still compensate for the system’s deficiencies and meet the objectives for robustness and good performance.
Minimal research has been
performed in the area of deriving suitable models and compensators aimed at the application of fuel cells, and the work presented here bridges the gap between the work performed separately in the two fields. Opportunities to further improve the system’s interface with the load must be investigated in order to efficiently, reliably and cost-effectively satisfy the application’s requirements. The combination of the fuel cell with a secondary source of high power density, such as batteries, has shown the potential to provide many benefits and result in a ‘synergistic’ system where the whole is greater than the sum of its parts. Nonetheless, an effective configuration and control strategy of all power sources is of utmost importance in order to reap these potential benefits and avoid degradation of the components. Intricate control must be implemented that balances the multiple, yet conflicting, design objectives. Moreover, the control scheme should be flexible to not only adhere and overcome the unique constraints of the application at hand, but to also allow extension to various hybrid systems so that it may be widely adopted. There has been no shortage of control strategies implemented in previous works geared towards hybrid systems, however they tend to be doomed by either their simplicity, typically characterized by state machine and rule-based methods, or their complexity, typically characterized by optimization and model predictive control methods. In both the former and the latter it is difficult to meet and balance all the desired objectives in a flexible manner, and instability issues persist, particularly in the former, where there isn’t adequate facility to account for the multiple constraints and compensate for the system’s deficiencies. Here, a flexible control strategy is implemented that continuously adjusts the operating parameters in response to variations in the system. Furthermore, it provides the facility to successfully implement a wide variety of control strategies to meet the various objectives as desired.
14
Finally, all the above must be tested and verified with real components and hardware on top of computer simulations to prove the proposed system’s feasibility and effectiveness for real world applications. Moreover, due to the high cost associated with the apparatus, the experimental set-up should be flexible to allow an efficient design and testing process of all the work related to this field, and offers a much-needed facility for academia as well as the industry to bring forth and develop this important research. In summary, the thesis aims to accomplish the following objectives: 1) Take advantage of the PCU to add value to the fuel cell power plant and tap into its potential to meet the increasing energy demands 2) Devise an effective topology of the PCU to efficiently and reliably meet the load demand with the requested dynamics 3) Devise suitable models of the various components in the PCU to gain insight into their behavior and limitations for the application at-hand 4) Devise suitable compensators by way of the developed models with careful considerations aimed at overcoming the various limitations in the system and satisfying its specific requirements 5) Devise a suitable hybrid control strategy that is flexible and robust in order to maximize the potential benefits of the various sources 6) Build a flexible bench-scale test facility to efficiently test the research 7) Verify the proposed system’s feasibility and effectiveness using real components
1.5
Outline
Chapter 2 discusses the requirements for the power conditioning of electronic systems, and thus the need for dc power supplies. In particular, switch-mode power supplies and their operation are discussed to fulfill the requirements for the given application. The chapter then proceeds to derive a suitable model for the power converter that may be used 15
for control purposes. To this end, the state-space averaging technique is developed and applied for the specific case of the boost dc-dc converter implemented in this work. Important transfer functions are obtained and plotted using MATLAB to gain physical insight into the system’s behavior. Chapter 3 first presents a comparison between the various closed-loop control techniques for dc-dc converters to attain the desired system robustness and performance.
The
advantages and operating characteristics of current mode control, in particular average current mode control, are highlighted in view of the application at hand.
The
fundamental control blocks in control theory are also reviewed such that they may be correctly applied to meet the desired properties of the open loop. A thorough analysis of the boost dc-dc converter’s behavior is then presented in order to accurately develop the sophisticated control processes necessary to overcome its unique challenges to control design. Models for the control loop are derived and combined with the results for the power stage model from Chapter 2 to obtain a complete system model that may be used to design the compensators. Modeling based on the philosophy of attaining expressions that are accurate and lend insight into dominant system behavior, yet practical and simple enough to design with, is preserved. The complete system is analyzed and simulated using MATLAB once again to observe the ability of the developed control strategy to meet the design objectives for the application at-hand and provide the necessary robustness against external disturbances. Chapter 4 explores the opportunity to enhance the fuel cell power plant’s interface and ability to meet the load characteristics for the given applications. The potential benefits of combining the fuel cell with a secondary power source are discussed. Nevertheless, various factors contribute to the success of such a hybrid system. First, the various potential candidates as energy storage systems to complement the fuel cell are compared to determine their suitability.
The configurations of interconnecting the various
components in the system are then examined in order to find a topology that maximizes each component’s output and provides the flexibility to reap all the potential benefits. Finally, the last piece of the puzzle is an effective control strategy, which is critical to the 16
overall system’s efficiency and reliability. Continuing with the previous design philosophy, a control strategy is sought after that achieves all the desired properties while aiming to maintain an ideal compromise between complexity and performance. A list of control objectives is developed, which leads to a configuration that allows direct application of the closed-loop control method derived in Chapter 3. The performance of the system and versatility of the control strategy are then investigated via simulations using MATLAB/Simulink. Chapter 5 presents the experimental work to validate the results obtained throughout the dissertation. An overview of the experimental set-up and components is provided in the first section, where it is intended to construct a modular test station that would allow an efficient design process. The results for the conducted tests are then given in the second section. Appendix A provides the state-space matrices of the dc-dc boost converter’s dynamic model developed in Chapter 2. Appendix B presents simulations results for the hybrid system already presented in Chapter 4. Due to certain component limitations in the experimental setup, the hybrid system is simulated once again with the encountered limitations replicated for comparison and verification purposes. A flow chart for the dissertation highlighting the progression through the chapters is presented in Figure 1.3.
17
(a) Chapter 1 Energy Demand
Distributed Generation
Central Power Plants
Renewable Energy Sources
Conventional
Wind Turbines
Photovoltaic
Fuel Cells
AFC
PAFC
SOFC
MCFC
PEMFC
Related Processes Related Processes Reforming
Power Conditioning
Co-generation
Various Components
Hybrid
DC Power Supply
Chapter 4
Chapter 2
18
DC-AC Inverter
(b) Chapter 2
Chapter 1
DC Power Supply
Linear Regulator
Switch Mode Power Supply
Boost
Requirements Requirements Modeling
Closed Loop Control
Experimental Verification
Chapter 5
Chapter 3
19
Buck
(c) Chapter 3 Chapter 5
Chapter 5
PEMFC
Boost
Dynamic Response
Modeling
Experimental Verification
Experimental Verification
Complete Small-Signal Model
Chapter 2
Modeling
Peak Current Mode Control
Voltage Mode Control
Average Current Mode Control
Current Mode Control
Closed Loop Control
Compensators Design
Chapter 4
(d) Chapter 4 Chapter 3
Chapter 1
Compensators Design
Hybrid Requirements Requirements Energy Storage System
Battery
Supercapacitor/ Ultracapacitor
Configuration
Active
Passive
Flywheel
Control Strategy
Adaptive
Optimization Algorithms
Rule Based
20
Experimental Verification
Chapter 5
(e) Chapter 5
Chapter 1
Chapter 2
Chapter 4
PEMFC
Boost
Hybrid
Dynamic Response
Modeling
Experimental Verification
Experimental Verification
Chapter 3
Figure 1.3: Thesis flow chart: (a) Chapter 1 (b) Chapter 2 (c) Chapter 3 (d) Chapter 4 (e) Chapter 5.
21
Chapter 2 DC-DC Boost Converter
2.1
Introduction
Modern electronic systems require dc power supplies to regulate the output at a given value, reduce ac voltage ripple on the dc output voltage, electrically isolate the output from the input, or achieve multiple outputs that may differ in voltage and currents. In addition, the power supplies are desired to be high-quality, small, light-weight, reliable and efficient. The importance of the latter is two-fold: the cost of the wasted energy and the difficulty in removing the heat generated due to dissipated energy. Linear power regulators, whose principle of operation is based on a voltage or current divider and where the semiconductor devices are operated in their linear (active) region, cannot meet the above objectives in most systems. Furthermore, they are limited to output voltages smaller than the input voltage, and the presence of the transformers and filters brings about a low power density. Thus, their main area of application is at low power levels. At higher power levels, switching regulators are employed that control the on and off states of power electronic semiconductor switches. Due to the low power loss in both states and not requiring the power devices to operate in their active region, high efficiency can be achieved. Also, due to the ability of the switches to operate at high frequency, the transformers and filters can be made smaller and lighter. Since the corner frequency of the output filter is also increased with increased operating frequency, the converters’ dynamic response can also be made faster.
For electrical isolation and
voltage transformation, the use of a high-frequency transformer instead of a linefrequency transformer also drastically decreases the size and weight of the switching regulators compared to the linear power supplies. 22
Dc-dc converters are widely used switch-mode power supplies. The input to these converters is typically an unregulated dc voltage that will fluctuate due to changes in the operating conditions. Switch-mode dc-dc converters are used to convert the unregulated dc input into a controlled dc output at a desired voltage level. The average dc output voltage must be controlled to equal a desired level despite variations in input voltage and output load. This is accomplished through the control of the on and off times of the switches present in the converters. One of the methods of controlling the output voltage is called Pulse-Width Modulation (PWM). It employs switching at a constant frequency and adjusts the on-time of the switch to control the output voltage. The duty-cycle, defined as the ratio of the on-time to the switching time period, is generated by comparing a signal-level control voltage with a repetitive waveform, typically a sawtooth. This control voltage signal is obtained by amplifying the error between the reference signal and the actual signal, the signal referring to either the voltage or current. The frequency of the repetitive waveform establishes the switching frequency, which is in the few kilohertz to a few hundred kilohertz range. Advantages of PWM switched converters include low component count, constant frequency operation, relatively simple control and commercial availability of integrated circuit controllers. The disadvantages result from its high frequency operation, which leads to increased switching losses and electromagnetic interference due to higher-order harmonics.
2.2
Boost Operation
Dc-dc boost or step-up converter, as the name implies, provides a regulated output voltage that is always greater than the input voltage. The boost converter, along with the buck or step-down converter, form the fundamental converter topologies from which most other converter topologies are derived. The boost converter consists of a dc input voltage source Vs, input capacitor Ci, inductor L, controlled switch S, diode D, output
23
filter capacitor Co and output load represented by resistance Rout, as shown in Figure 2.1. L
D
+ Vs
+ S
Ci
Co
Rout
-
vout -
Figure 2.1: Basic dc-dc boost converter topology When the switch is on, the diode is reverse biased, thus isolating the output stage, and the input supplies energy to the inductor while the capacitor discharges into the load. The inductor current ramps up essentially linearly as long as the filter’s corner frequency is much lower than the switching frequency. When the switch is off, the inductor current commutates the diode, thereby turning it on and causing it to conduct, and the output stage receives energy from the inductor as well as from the input. Thus the inductor current ramps down. If it does not reach zero at the end of the switching period when the switch is once again turned on, a Continuous Conduction Mode (CCM) of the inductor current exists in which the transistor and diode are alternately on and off, and operate as a two-position single-pole switch. On the other hand, if the inductor current does reach zero, known as Discontinuous Conduction Mode (DCM), the diode current tries to reverse but cannot, and the diode therefore turns off. There is therefore a third interval where both the transistor and diode are off. Hence, the diode and switch operate as a three-position single-pole switch.
Transition from CCM to DCM occurs when the
converter load current falls below some minimum value. Assuming CCM, the time integral of the inductor voltage over one time-period in steadystate is zero:
Vs t on + (Vs − Vout )t off = 0
24
(2.2)
Dividing both sides by Ts and rearranging the terms gives: Vout T 1 = s = Vs t off 1 − D
(2.3)
Ps = Pout
(2.4)
I out = (1 − D) Is
(2.5)
Assuming a lossless circuit:
Therefore
2.3
Power Converter Dynamic Modeling
2.3.1 Introduction
Power converters must be suitably controlled to supply the requested voltages, currents, or frequency ranges for the load with the constrained dynamics despite changes in the output load and input line voltages. This is accomplished through a negative-feedback control system to obtain the necessary robustness. In order to get rid of the guesswork involved in designing the control loop and meet the performance objectives, it is essential to describe the system mathematically with an accurate model in order to obtain physical insight into its behavior. Furthermore, to use linear feedback control methods based on Laplace transform, Bode plots and root locus, the resulting system must be linear. Classical linear systems control theory can then be applied to determine suitable compensation for the power stage in order to attain the desired steady-state and transient 25
responses. Middlebrook and Cúk developed a state-space averaging technique that results in a linear model of the power stage for small ac signals linearized around a steady-state dc operating point [17]. State-space modeling provides a general and strong basis for dynamic modeling of various systems such as power converters while maintaining an ideal compromise between accuracy and simplicity, thus justifying its widespread adoption [18,19]. The resulting transfer functions can be used to design the linear control loops and computer simulate the steady-state as well as the dynamic behavior of the power converter. The analysis is first developed in general for any dc-dc switching converter, and then demonstrated in detail for the boost converter at hand, in which parasitic effects of the components are also accounted for.
2.3.2 State-Space Modeling
State-space modeling is based on the fact that any PWM converter is a special class of nonlinear system that is switched between two or more linear circuits according to the associated duty ratio. The transient analysis and control design is therefore complicated by the fact that a number of equations must be solved in sequence. The technique of averaging solves this problem by taking a linearly weighted average of each separate set of equations describing the switched network to form a single set of equations for the states and output.
Since the averaging process ‘approximates’ the behavior of the
converter over many cycles, for the approximation to be valid, two main conditions must be satisfied: first the state variables must evolve in an approximately linear manner in all the circuit configurations, and second the switching frequency ripple component of the state variables must be small in comparison with the average component [17]. Both of these conditions are typically satisfied in simple dc-dc converters [19]. The latter condition is equivalent to requiring that the output filter’s cutoff frequency be much lower than the switching frequency. The resulting model is accurate at relatively lower frequencies, and becomes better the more the effective low-pass filter’s corner frequency 26
is below the switching frequency. •
State-Space Averaged Model
As previously discussed, there are usually two modes of operation for dc-dc converters: continuous and discontinuous. For a converter operating in CCM, there are two circuit states: one state when the switch is on and the other when the switch is off, as shown in Figure 2.2. In the case of DCM, an additional circuit state exists. Since CCM is assumed, only a two-switched converter is considered. (a) L + Vs
+ Ci
Co
Rout
-
-
L
(b)
+ Vs
vout
+ Ci
Co
-
Rout
vout -
Figure 2.2: Two circuit states for boost converter: (a) switch is on (b) switch is off.
In each of the two positions of the switch, the system is linear and can be described by state-space equations.
The state variables are the inductor currents and capacitor
voltages. Therefore, considering ideal switches, the following two sets of state-space equations can be written for each circuit state:
27
x& = A1 x + B1u x& = A2 x + B2u
during d ⋅ Ts during (1 − d ) ⋅ Ts
(2.6)
where x is the vector of state variables, ˙ = d/dt, u is the vector of input or control independent sources (source voltage, output current, etc…), A1, B1 and A2, B2 are the respective system matrices and can be derived by applying simple circuit analysis on the two circuits in Figure 2.2. The duty ratio d is the control input that determines the on and off time of the switch, and thus the fraction of the period each cycle that the system spends in each circuit configuration. The key is combining the two sets of state-space equations into a single equivalent set over a complete switching period of the form: x& = A ⋅ x + B ⋅ u
(2.7)
where the equivalent matrices A and B are weighted averages of the actual matrices. Since for a given duty ratio d, the system spends d⋅Ts described by A1 and B1, where Ts is the switching period, and the remaining (1-d)⋅Ts described by A2 and B2, one can write: A = d ⋅ A1 + (1 − d ) ⋅ A2 B = d ⋅ B1 + (1 − d ) ⋅ B2
(2.8)
In the case the output signal required for some transfer function is not one of the state variables, but rather some linear combination of them (e.g., vout in Figure 2.2 if an Equivalent Series Resistance (ESR) for the output capacitor is accounted for), it is necessary to include an output vector y for each of the two-switched networks as well: y = C1 ⋅ x y = C2 ⋅ x
28
(2.9)
The weighted average of the matrix C is done in the same way as for A and B: C = d ⋅ C1 + (1 − d ) ⋅ C2
(2.10)
allowing to replace (2.9) with (2.11):
y =C⋅x
(2.11)
Substituting (2.8) and (2.10) into (2.7) and (2.11) gives: x& = (d ⋅ A1 + d ′ ⋅ A2 ) ⋅ x + (d ⋅ B1 + d ′ ⋅ B2 ) ⋅ u y = (d ⋅ C1 + d ′ ⋅ C2 ) ⋅ x
(2.12)
where d ′ = 1 − d . To get the average or steady-state dc value of the states, the state equation in (2.12) can be set to zero since the state vector under dc conditions is a constant and its derivative is therefore zero:
(D ⋅ A1 + D′ ⋅ A2 ) ⋅ X + (D ⋅ B1 + D′ ⋅ B2 ) ⋅ u0 = 0
(2.13)
where capital letters denote the dc values and subscript ‘0’ denotes the initial value. From (2.13), the state vector for dc conditions is given by: X = − A−1 ⋅ B ⋅ u0
(2.14)
Y =C⋅X
(2.15)
and the dc output voltage is:
29
•
Perturbed State-Space Averaged Model:
Since the converter output y must be regulated through variations in d despite perturbations in the converter's inputs u due to load and power supply variations, the variables must be decomposed into dc steady-state quantities and small ac perturbations: x = X + xˆ u = u0 + uˆ y = Y + yˆ d = D + dˆ
(2.16)
where the lowercase letter represents the variable, the capital letter represents the steadystate value, and the lowercase letter with the hat symbol (‘ˆ’) represents the small ac perturbation. This procedure now formulates the small-signal ac analysis. Substituting the perturbations terms of (2.16) into the system of (2.12) and simplifying, we obtain the following perturbed averaged model: x&ˆ = A ⋅ X + B ⋅ u0 + [( A1 − A2 ) ⋅ X + (B1 − B2 ) ⋅ u0 ] ⋅ dˆ + [( A − A ) ⋅ xˆ + (B − B ) ⋅ uˆ ] ⋅ dˆ 1
2
1
2
(2.17)
Y + yˆ = C ⋅ X + C ⋅ xˆ + (C1 − C2 ) ⋅ X ⋅ dˆ + (C1 − C2 ) ⋅ xˆ ⋅ dˆ
where the following relations were used: dˆ ′ = − dˆ dX =0 dt
(2.18)
The perturbed state-space description of (2.17) becomes nonlinear due to the presence of the product of two independent quantities, mainly xˆ and dˆ . This is a result of the duty
30
cycle, which is the control input, not being an element in the input vector u. •
Linearized State-Space Averaged Model:
Control of the system with nonlinearities is difficult when performance objectives must be met. Under the assumption of small-signal operation, linearization is done through a Taylor series expansion around the points (X, D, Y, u0), and nonlinear terms of higher orders are thrown away, i.e., departures from the steady-state values are negligible compared to the steady-state values themselves,
uˆ