scale accelerated pavement testing has proven to be a valuable tool that fills the gap .... The Accelerated Load Facility (ALF) type was used in this study to apply ...
Full-Scale Accelerated Load Testing of Geosynthetics Reinforced/Stabilized Paved Roads built over Native Soft Subgrade Shadi Hanandeh, Murad Abu-Farsakh, Louay Mohammad, Qiming Chen, and Milad Saghebfar
ABSTRACT Weak soil is a common problem in road construction. Whether it is a temporary access road or a permanent road built over a weak subgrade, an expected large deformation of subgrade can lead to deterioration of the paved surface. Geosynthetics can offer a potential economical solution for stabilizing roads built over weak subgrade soils. In this study, six geosynthetic reinforced test lane sections were constructed at the Pavement Research Facility (PRF) site to investigate the benefits of using geosynthatics to reinforce and stabilize flexible pavement built over weak subgrade soil. The test sections were instrumented with a verity of sensors to help capture the load associated and environmental associated pavement responses. The test results showed that the inclusion of geosynthetics to stabilize subgrade and/or reinforce base aggregate layer can significantly improve the performance of a flexible pavement. Significant reduction of the subgrade rutting was observed when the geosynthatics were placed at base-subgrade interface. The inclusion of geosynthatics helps in reducing the base layer rutting, and thus leads to decreasing the stress concentration over the subgrade.
INTRODUCTION Roads are paved or unpaved surfaces, providing safe and economical transportation. The existence of weak subgrade in pavement construction demands innovative construction techniques in order to increase the durability of pavements. Instead of using lime and cement stabilization materials to stabilize the subgrade, geosynsthics as sustainable materials can be used to reinforce the base and stabilize the subgrade. Previous studies have demonstrated the benefits of using the geosynthetics, especially for pavements construction over weak subgrades. This includes extending the roads’ service life and/or reducing the structural layer thickness (Haas 1984; Barksdale et al. 1989; Al-Qadi 1994; Perkins 1999; Abu-Farsakh et al. 2004; Tang et al. 2008; Chen and AbuFarsakh 2009; Abu-Farsakh and Chen 2011; Abu-Farsakh et al. 2012; Tang et al. 2015; Abu-Farsakh et al. 2015). Fullscale accelerated pavement testing has proven to be a valuable tool that fills the gap between laboratory tests and inservice pavement performance condition, which helps to evaluate the performance of geosynthetics reinforcement pavements (Webester 1993; Al-Qadi 1997; Cancelli 1999; Perkins 2002; Cuelho and Perkins 2014; Tingle 2009; Al-Qadi 2008).With the Mechanistic-Empirical (ME) pavement design gaining popularity in the pavement community the accelerated pavement testing becoming more essential. Recent studies on geosynthetic reinforced pavement applications
GeoAmericas 2016, 3rd Pan-American Conference on Geosynthetics
have focused on quantifying the benefits and incorporating them into ME analysis and design (e.g., Perkins et al. 2009; Chen and Abu-Farsakh 2012). Two types of geosynthetics products were used in this study, a triaxial geogrid and a high-strength woven geotextile. A total of six test lane sections were constructed for this purpose. Each test lane section was instrumented by a variety of sensors to measure the load associated (e.g., stress and strain) and the environmental associated (e.g., water content and temperature) pavement responses that may affect the section performance. 1. 1.1
EXPERIMENTAL PROGRAMM Test Lane Sections and Instrumentation
A total of six test lane sections were constructed over weak subgrade soil of an outdoor site located at the Pavement Research Facility (PRF) of Louisiana Department of Transportation and Development (LA DOTD) in Port Allen, LA. Each test lane section is 24 m (80 ft) long and 4 m (13 ft) wide. Figure 1 presents the layout and cross sections of the six test lanes. Lane 1 and lane 4 were constructed without geosynthetics reinforcements, of which lane 1 was constructed over a non-woven geotextile wrapped sand embankment as a common practice in New Orleans Louisiana. Lane 2 and lane 3 were reinforced by the triaxial geogrid, GG, placed at the base-subgrade interface. For lane 2, an additional layer of geogrid, GG, was installed at the upper one-third of the base. Lane 5 and lane 6, with different base thicknesses were stabilized/reinforced with the high strength geotextiles, GT. The test lane sections were instrumented by a verity of sensors to measure load- and environment-associated pavement responses and performance. More details about the instrumentation are available in Tang et al. (2015).
2'-6" 13'
13'
Unpaved Roadway 13' 13' 13'
13'
Unpaved Roadway
B
13' 2'-6"
4'
Reinforced Concrete Foundation
B
1'
Section 1 Section 2 Section 3 Section 4 Section 5 Section6
13'
Pile
13'
A
A
13'
13'
13'
13'
80'
Pile
50'
Section A-A Reinforced Concrete Foundation
Unpaved Roadway
(a) Plan layout of testing sections
GeoAmericas 2016, 3rd Pan-American Conference on Geosynthetics
(b) Pavement structure of testing sections (section B-B) Figure 1- a: Schematic layout and structure of testing sections (not to scale) Figure 1- b: Cross sections of the six test sections, units in mm.
(a)
(b)
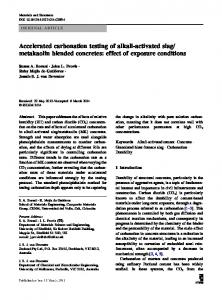
Figure 2: (a) The Dual wheel tire (b) Loading area in test lane 4. 2.
PAVEMENT LAYER MATERIALS
The characterization of subgrade soil at the PRF site was performed on samples collected from the site. The subgrade soil has a liquid limit, LL, of 88% and a plastic index, PI, of 53. The subgrade soil has an optimum moisture content of 35% and maximum dry density of 1,250 kg/m3 (78 lb/ft3), according to the standard Procter test (ASTM D698). This subgrade soil was classified as CH according to the Unified Soil Classification System (USCS), and A-7-6 according to the American Association of State Highway and Transportation Officials (AASHTO) classification system. The crushed limestone has a mean particle size (D50) of 4 mm (0.157 in), a uniformity coefficient (Cu) of 27.7, and a coefficient of curvature (Cc) of 1.3.
GeoAmericas 2016, 3rd Pan-American Conference on Geosynthetics
The maximum dry density, the modified Proctor test (ASTM D1557), was 2,066 Kg/m3 (129 lb/ft3) at an optimum moisture content of 9.4% as shown in Figure 4-2.This crushed limestone is classified as GW and A-1-a according to the (USCS) and the (AASHTO) classification system, respectively. The HMA mix used in the construction of the pavement test sections was 19.0 mm (0.75 in) design level 1 superpave mixture The optimum asphalt binder [classified as PG 76-22M according to the Performance Grade (PG) specification] content was 4.1%. Two geosynthetic products, a triaxial geogrid and a high-strength woven geotextile, are selected for this study and are herein designated as GG and GT. Table 1 presents the physical and mechanical properties of the geosynthetic materials as reported by the manufactures.
Table 1 Physical and mechanical properties of geosynthetics used in this study T, kN/m Reinforcement
GG
Polypropylene
GT
Polypropylene
direction,
bCross
CDb
MDa
1.35c 7.0e
CDb 270d
26.3e
350f
eTensile
strength at 2% strain,
fTensile
Size, mm 40×40×40
1313f
machine direction, cTensile strength at 0.5% strain in radial direction,
0.5% strain in radial direction, 3.
Aperture
Polymer Type MDa
aMachine
J, kN/m
modulus at 2% strain,
gApparent
0.425g bTensile
Modulus at
opening size (AOS).
ACCELERATED LOADING FACILITY
The Accelerated Load Facility (ALF) type was used in this study to apply repeated moving traffic wheel loads. ALF is a testing device that applies unidirectional trafficking to the test sections with a nominal speed of 16.8 km/h (10.5 mph) or 350 passes per hour. ALF has a dual-tire axle consisting of two Michelin XZE-model truck tires. Figure 2 shows a picture of the dual-wheel assembly. ALF has the capacity of applying a normally distributed wander covering a transverse distance of 760 mm (30 in) to simulate real traffic pattern. The wheel path generated by ALF is about 12 m (40 ft).The tests were designed to apply a maximum load of 44 kN (9,750 lb) for the first 110,000 passes, followed by a maximum load of 54 kN (12,050 lb) for additional 100,000 passes, followed by a maximum load of 64 kN (14,350 lb) for last 100,000 passes or until reaching 19 mm (0.75 in) rut depth. Using a wireless laser profilometer, the transverse surface profile of the test sections were measured at select intervals of load repetitions at eight different locations along the wheel path. The pavement responses to the moving loads of ALF were also recorded. Static measurements were taken without the ALF surcharge load to monitor the accumulation of the permanent deformation of the base and the subgrade layers.
GeoAmericas 2016, 3rd Pan-American Conference on Geosynthetics
4. 4.1
TEST RESULTS In-Place Properties
Varies nondestructive devices were deployed to measure the in-situ properties of the
asphalt layer. This includes the
nuclear density gauge, light falling weight deflectometer (LFWD), Portable Seismic Property Analyzer (PSPA) and Pavement Quality Indicator (PQI). For the asphalt layer the LFWD moduli, geogauge moduli, PSPA modulus, PQI density, nuclear density gauge are in the range of 471.4 to 681.4 MPa, 264.97 to 385.64 MPa, 104944.2 to 150932.2 MPa, 2199.87 to 2223.15 kg/m3 and 2075.46 to 2213.22 kg/m3, respectively. The air voids measured by PQI and core samples were ranged from 5.06% to 6.4% and 4.77% to 6.62%, respectively. The nuclear density gauge, light falling weight deflectometer (LFWD), Geogauge, and dynamic cone penetrometer (DCP) were used to measure the density and stiffness/modulus for construction control of the subgrade and base course layers. For the subgrade layer, the dry densities varied from 1,044 to 1,192 kg/m3, with moisture contents ranging from 44 to 52%. The corresponding LFWD moduli, geogauge moduli, and DCP index (DCPI) were in the range of 3 to 6 MPa, 19 to 26 MPa, and 152 to 203 mm/blow, respectively. For the base course layer, the dry densities varied from 1,925 to 2,065 kg/m3, with moisture contents ranging from 6 to 10%. The corresponding LFWD moduli, geogauge moduli, and DCPI were in the range of 50 to 70 MPa, 142 to 237 MPa, and 7.5 to 9.5 mm/blow, respectively. 4.2
Dynamic Behavior to ALF
The pavement dynamic responses to the rolling wheel are very important to study the stress and strain under dynamic loads. Figure 3 shows a typical response of vertical stresses, excess pore water pressure at the top of subgrade layer, and resilient behavior of the base and subgrade layers for lane 6. The pavement resilient responses to moving traffic load can be used to calibrate and verify the mechanistic models for ME analysis and design. 4.3
Surface Permanent Deformation
The permanent deformations for reinforced lane sections were significantly less than the controlled lane section (unreinforced). Figure 4 illustrates the development of rut depth (permanent deformation) with the number of ESALs for the six test lane sections. The accumulations of the total permanent deformations were calculated by subtracting the baseline measurement from the subsequent maximum values of profile measurements. The total permanent deformation for each section shown in Figure 4 is the average of the measurements taken at the six different locations along the wheel path in each section. The lane sections constructed with geosynthetic reinforcement showed less rut depth as compared to the unreinforced lane section with the same number of wheel load applications under the same number of ESALs, indicating the benefits of using geosynthetics in reducing the permanent deformation in pavement structures built over weak subgrade soils. The measured rut depth was 17.4 mm, 11.5 mm, 12.4 mm, 13.8 mm, and 9.9 mm for the lanes 1, 2, 3, 4 and 5, receptively, at 472859.82 ESALs; while lane 6 reached 19.1 mm at 103302.23 ESALs (i.e., lane of 245 mm base thickness reinforced with one layer of high strength geotextile placed at the base-subgrade interface is weaker than the unreinforced control lane 4 with an additional 205 mm base aggregate).
GeoAmericas 2016, 3rd Pan-American Conference on Geosynthetics
(a)
(c)
(b)
(d)
Figure 3: Dynamic responses of pressure cell, piezometer, LVDT and potentiometer under moving traffic load for lane 6: (a) vertical stress; (b) excess pore water pressure lane 6; (c) vertical displacement in Base lane 6; (d) vertical displacement in subgrade for lane 6 Between lane 2 and lane 3, lane 2 reinforced with double layer of geogrids showed better performance (i.e., less deformation) than test lane 3 reinforced with one layer of geogrid. However, lane 5 reinforced with one layer of high strength geotextile placed at the base-subgrade interface showed the least permanent deformation among the six test lane sections.
GeoAmericas 2016, 3rd Pan-American Conference on Geosynthetics
It should be pointed out here that in addition to geosynthetics, the variations in properties of pavement layer materials also affect the performance of the test lane sections.
Figure 4: Accumulated surface permanent deformation 4.4
Permanent Deformation in Base layers and Subgrade
The base layers were instrumented by potentiometers placed at the middle of the base layer to measure both the permanent and elastic responses during select intervals of the ALF traffic. It is assumed here that the mid-height strain represents the average strain of the base layer. Figure 5 presents the development of the base permanent deformation with ESALs, which shows that the control test lane 4 experienced much higher permanent deformation compared to the reinforced test lanes of the same base thickness (i.e., test lanes 2, 3 and 5). Meanwhile, test lane 2 reinforced with double geogrid layers showed significantly less permanent defamation in base layer compared to test lane 3. However, test lane 6 with reduced base thickness, experienced significant higher permeant deformation than the controlled test lane 4 at the same number of ESALs. This is likely due to the fact that the base thickness of lane 6 is 205 mm thinner than the base thickness of lane 4. The subgrade layer was also instrumented with customized LVDT attached at the endd to a 1.0-m (3-ft) long steel rod that was driven into the subgrade soil, and at the subgrade surface a thin disk with a diameter of 5 cm (2 in) was attached onto the contact tip of the LVDT to provide sufficient contact area with the soil.
GeoAmericas 2016, 3rd Pan-American Conference on Geosynthetics
Figure 4: Accumulated base layer permanent deformation Figure 6 depicts the development of subgrade permanent deformations with number of ESALs for test lanes 2, 3, 4, and 6. Unfortunately, the LVDTs installed in test lanes 1 and were out of order. As can be seen from the figure, the control section (test lane 4) experienced a significantly higher permanent deformation than the reinforced test lanes 2 and 3. This suggests that the subgrade layer may have been stabilized by the geosynthetic reinforcement. The placement of geosynthetics at the base-subgrade interface can stabilize the subgrade soil by changing the stress level and redistributing the applied vertical stress at the top of subgrade layer. Significant high deformation was developed in test lane 6 as compared to the other test lanes, which may be due to the thinner base layer thickness of lane 6 (205 mm thinner than the other test lane sections).
Figure 6: Accumulated subgrade permanent deformation
GeoAmericas 2016, 3rd Pan-American Conference on Geosynthetics
5.
SUMMARY AND CONCLUSIONS
Due to the soft nature of Louisiana soil and the presence of high water table, it is very common in Louisiana to build roadways over weak subgrade soils, which creates many design and construction challenges. As an alternative to the traditional method of treating the soft soil with lime or cement, geosynthetics can offer an alternative solution to stabilize subgrade and/or reinforce base of pavements built over soft subgrades. For this purpose, six full-scale unreinforced and geosynthetic reinforced pavement test lane sections were constructed at ALF sited and tested using accelerated rolling wheel loading to evaluate the benefits of using geosynthetics to stabilized/reinforce pavements built over weak subgrades. The test lane sections were instrumented with various sensors to help evaluate the performance of the different test lanes under wheel loading. The test results clearly demonstrated the benefits of geosynthetics in reducing the surface rutting, as well as base and subgrade permanent deformations, of the reinforced test lanes, which can be incorporated into design through extending the service life of pavements and /or reducing the pavement thickness. ACKNOWLEDGMENTS The authors would like to acknowledge the financial support provided by the Louisiana Department of Transportation and Development (State SIO No. 30000135, LTRC Project No. 11-3GT), Tensar International, and TenCate. The personnel at Pavement Research Facility of Louisiana Transportation Research Center (LTRC) provided assistance with the accelerated pavement testing. The authors wish to thank the graduate students at LTRC who helped with installing instruments and in-situ testing. REFERENCES Abu-Farsakh, M., and Chen, Q. 2011, “Evaluation of Geogrid Base Reinforcement in Flexible Pavement Using Cyclic Plate Load Testing.” International Journal of Pavement Engineering, Vol. 12, No. 03, 275-288. Abu-Farsakh, M., Gu, J., Voyiadjis, G., and Chen Q., 2012, “Finite Element Analysis to Evaluate Geogrid Base Reinforcement in Flexible Pavement.” Proceedings of the 91st TRB Annual Meeting, Washington, D.C. Abu-Farsakh M., Hanandeh S., Chen Q., and Mohammad L., 2015 “Evaluation of Geosynthetic Reinforced/Stabilized for Pavement Built over Soft Subgrade Soil Using Cyclic Plate Loading Testing.” Proceedings of Geosynthetics 2015
Conference, February 15-18, Portland, Oregon. Al-Qadi, I., Brandon, T., Valentine, R., Lacina, B., and Smith, T., 1994, “Laboratory Evaluation of Geosynthetic-Reinforced Pavement Sections.” Transportation Research Record 1439, Transportation Research Board, National Research Council, Washington D.C., 25-31. Al-Qadi, I., Brandon, T., and Bhutta, S., 1997, “Geosynthetic Stabilized Flexible Pavements.” Proceedings of the
Geosynthetics '97 Conference, Long Beach, CA, March, 1997, pp. 647-661. Al-Qadi, I., Dessouky, S., Kwon, J., and Tutumluer, E., 2008, “Geogrid in Flexible Pavements: Validated Mechanism.”
Transportation Research Record: Journal of the Transportation Research Board, No. 2045, National Research Council, pp. 102-109.
GeoAmericas 2016, 3rd Pan-American Conference on Geosynthetics
Barksdale, R., Brown, S., and Chan, F., 1989, “Potential Benefits of Geosynthetics in Flexible Pavement Systems.”
National Cooperative Highway Research Program Report No. 315 , Transportation Research Board, National Research Council, Washington D.C. Cancelli, A., and Montanelli, F., 1999, “In-Ground Test for Geosynthetic Reinforced Flexible Paved Roads.” Proceedings
of the Geosynthetics ‘99 Conference, Boston, MA, April, pp. 863-878. Chen, Q., Abu-Farsakh, M., and Tao, M., 2009, “Laboratory Evaluation of Geogrid Base Reinforcement and Corresponding Instrumentation Program.” ASTM Geotechnical Testing Journal, Vol. 32, No. 6, pp. 516-525. Cuelho, E., Perkins, S., and Morris, Z., 2014, “Relative Operational Performance of Geosynthetics Used As Subgrade Stabilization.” Montana Department of Transportation, U.S. Department of Transportation, Federal Highway
Administration, Washington, DC, Report No. FHWA/MT-14-002/7712-251, 328 p. Haas, R., 1984, “Structural Behaviour of Tensar Reinforced Pavements and Some Field Applications.” Proceedings of the
Conference on Polymer Grid Reinforcement in Civil Engineering, Thomas Telford Publishing, London, pp. 166-170. Perkins, S., 1999, “Geosynthetic Reinforcement of Flexible Pavements Laboratory Based Pavement Test Sections.”
Federal Highway Administration Report FHWA/MT-99-001/8138, Montana Department of Transportation, Helena, Montana, USA, 109 p. Perkins, S., 2002, “Evaluation of Geosynthetic Reinforced Flexible Pavement Systems Using Two Pavements Test Facilities.” Federal Highway Administration Report FHWA/MT-02-008/20040, Montana Department of Transportation, Helena, Montana, USA, 120 p. Tang, X., Chehab, G., and Palomino, A., 2008, “Evaluation of Geogrids for Stabilizing Weak Pavement Subgrade.”
International Journal of Pavement Engineering, Vol. 9, No. 5, 413-429. Tang, X., Abu-Farsakh, M., Hanandeh, S., and Chen, Q, 2015, “Performance of Reinforced and Stabilized Unpaved Test Sections Built over Native Soft Soil under Full-Scale Moving Wheel Loads.” Transportation Research Record: Journal
of the Transportation Research Record, No. 2511, Soil Mechanics, pp. 81-89. Tingle, S. and Jersey, R., 2009, “Full-Scale Evaluation of Geosynthetic-Reinforced Aggregate Roads.” Transportation
Research Record: Journal of the Transportation Research Board, No. 2116, pp. 96–107. Webster, S., 1993, “Geogrid Reinforced Base Courses for Flexible Pavements for Light Aircraft: Test Section Construction, Behavior under Traffic, Laboratory Tests, and Design Criteria.” Technical Report GL-93-6, USAE Waterways Experiment Station, Vicksburg, MS, 86 p.
GeoAmericas 2016, 3rd Pan-American Conference on Geosynthetics