In the assessment of speaking, the global spread of English further opens a ... ing on well-developed models of language use (Taylor, 2006, p. 56). ... perspectives of World Englishes, in which phonological âerrorsâ are. 1. 2. 3. 4. 5. 6. 7. 8 .... FCE, 34 in CAE, and 22 in CPE. ..... World Englishes: A resource book for students.
CE:
PE: Suganya NT No. of pages: 12
Dispatch: 3.12.13
1 5 2
Manuscript No.
T E S Q
Journal Code
1 2 3 4 5 6 7 8 9 10 11 12 13 14 15 16 17 18 19 20 21 22 23 24 25 26 27 28 29 30 31 32 33 34 35 36 37 38 39 40 41 42 43 44
Functional Loads of Pronunciation Features in Nonnative Speakers’ Oral Assessment OKIM KANG AND MEGHAN MORAN Northern Arizona University Flagstaff, Arizona, United States doi: 10.1002/tesq.152
I
n the context of global communication, native speaker (NS) norms are no longer considered important in international English (Seidlhofer, 2011). In particular, for those who are concerned about the acceptability of varieties of English, the notion of intelligibility has been a paradigmatic area of argument (Smith & Nelson, 2006). The current belief is that the presence of accent in nonnative speakers’ (NNSs) speech may not necessarily be conflated with the assumption of reduced intelligibility (Harding, 2011). There has also been empirical support that accentedness and intelligibility are independent dimensions of second language (L2) speech (Derwing & Munro, 1997). This conception has generally been reflected in L2 assessment, where speakers’ output in high-stakes tests such as Cambridge ESOL or TOEFL often contains phonological errors yet receives high scores on the delivery. In the assessment of speaking, the global spread of English further opens a debate on the accountability of acceptable norms; that is, whose norms should be employed in the tests. The debate brings up two issues of test fairness: (1) tests being unfair to users of nonprestigious forms of English, if certain inner circle forms are being privileged (Hamp-Lyons & Davies, 2008, p. 26) and (2) fair tests relying on well-developed models of language use (Taylor, 2006, p. 56). Thus far, however, there is little evidence to support or to refute these biased claims (Davies, Hamp-Lyons, & Kemp, 2003, p. 571). Still, the belief in NS ownership remains prevalent for learners, teachers, and educators (Jenkins, 2006, p. 171). The present study adopts a practical and tentative position toward the viewpoint where NS varieties are used as norms in NNSs’ oral assessment (Taylor, 2006, p. 52). It identifies the types of phonological errors, particularly through functional load analysis, that affect raters’ judgments in determining English language oral proficiency. The findings will be discussed from the perspectives of World Englishes, in which phonological “errors” are TESOL QUARTERLY Vol. 0, No. 0, November 2013 © 2013 TESOL International Association
1
1 2 3 4 5 6 7 8 9 10 11 12 13 14 15 16 17 18 19 20 21 22 23 24 25 26 27 28 29 30 31 32 33 34 35 36 37 38 39 40 41 42 43 44
considered as deviations from native speaker norms (Kenkel & Tucker, 1989, p. 202), not as divergence from accuracy or correctness. Note that the native speaker norms here refer to languages widely used by providers of large-scale, high-stakes English proficiency tests such as American and British Standard English (Taylor, 2006, p. 56), but within native speaker varieties of English (e.g., New Zealand English, Australian English), wide variability does exist.
FUNCTIONAL LOADS OF PRONUNCIATION FEATURES In L2 speaking performance, both segmentals and suprasegmentals have been examined for their roles in judgments of accented speech. Then, reflecting the hierarchy of phonemic errors, segmental features are often discussed in terms of functional loads(FL), that is, the rank of segmental contrasts according to their performance in English pronunciation (Brown, 1991, pp. 71–86; Catford, 1987, pp. 89–90). According to the FL theory, some segmental errors are “worse” than others, that is, they are more likely to affect listeners’ comprehension. For example, the interdental fricative (both voiced and voiceless) has a relatively low functional load; therefore, if L2 speakers pronounce they as dey, intelligibility should not be affected. In contrast, the substitution of a /p/ for a /b/ has a higher functional load, meaning that the pronunciation of bit as pit is likely to be more problematic for the listener. This is, in part, due to a higher presence of valid minimal pair combinations for high FL phonemes. Munro and Derwing’s (2006) study similarly showed that high FL errors had large effects on perceptual scales, whereas low FL errors had only minimal impacts. However, this FL approach has been well developed in L2 pronunciation instruction (Brown, 1991), but has not been well utilized in L2 assessment. In the current study, certain errors are classified by FL to determine how phonological errors affected oral assessment across proficiency levels. Segmental features have the ability to severely affect comprehension (Fayer & Krasinski, 1987), but not all segmental errors carry equal weight. We still do not know which segmental features of pronunciation can best differentiate language learners’ proficiency. The current study investigated the impact of particular segmental features on judgments of NNSs’ speech production. Using candidates’ spoken responses in Cambridge ESOL tests, it identified salient pronunciation features that can distinguish Common European Framework of References (CEFR) speaking levels (B1–C2). The present study focuses on pronunciation features as part of a larger project which explores overall linguistic features (e.g., lexical resources, grammatical complexity) and their impact on NNSs’ speaking performance. 2
TESOL QUARTERLY
1 2 3 4 5 6 7 8 9 10 11 12 13 14 15 16 17 18 19 20 21 22 23 24 25 26 27 28 29 30 31 32 33 34 35 36 37 38 39 40 41 42 43 44
METHOD Speech samples This study analyzed 120 speech files from the Cambridge ESOL General English Examinations. The speech data were used in compliance with rules and policies provided by the Institutional Review Board. The Cambridge ESOL General English Examinations are one of the largest English qualification exams in the world. Once candidates pass any of the tests they choose to take, they will receive a certificate that acknowledges proficiency at that level. Cambridge ESOL works within the CEFR from A2–C2, in which A2 is equivalent to the Key English Test (KET), B1 to the Preliminary English Test (PET), B2 to the First Certificate in English (FCE), C1 to the Certificate in Advanced English (CAE), and C2 to the Certificate of Proficiency in English (CPE). Each speech file was approximately one minute long and was taken from the Individual Long Turn section. The study chose four CEFR levels from B1 to C2. There were 32 speakers in PET, 32 in FCE, 34 in CAE, and 22 in CPE. We did not include KET because this level lacks an Individual Long Turn (monologic) response. Each sample came from a student who had passed the respective level of the test. Speakers were from 21 countries (5 Chinese, 6 French, 8 1 Italian, 11 Korean, 16 Spanish, 5 Russian, 1 Brazilian, 2 Swiss, 1 Bulgarian, 3 German, 4 Greek, 2 Japanese, 5 Portuguese, 4 Swedish, 1 Bolivian, 7 Dutch, 1 Austrian, 1 Turkish, 1 Arabic, 1 Colombian, and 1 Estonian).
Data coding This study analyzed the segmental features of Cambridge ESOL testtakers’ speech. After listening to all of the speech files, two analysts (research assistants) noted every time the speech deviated from Standard American English (SAE). They noted the instances when speakers added, deleted, or substituted consonant or vowel sounds. Features which deviated from SAE, such as the absence of a postvocalic retroflex r or the presence of a trilled r, were categorized and analyzed separately than “errors” due to the fact that these are common, and accepted, phonological features of alternative (nonSAE) varieties of English. In addition, analysis of variance (ANOVA) results show that these features did not yield any significant difference across proficiency levels. Ten percent of the speech samples were
3
1 2 3 4 5 6 7 8 9 10 11 12 13 14 15 16 17 18 19 20 21 22 23 24 25 26 27 28 29 30 31 32 33 34 35 36 37 38 39 40 41 42 43 44
analyzed for intercoder reliability for error identification with intraclass correlation coefficients reaching at least .81. Every time the speech sample differed from that of a typical native speaker of SAE, the actual sound produced was noted as well as the target sound. The contrast was then recorded using the International Phonetic Alphabet. For example, a common notation occurred with the target word that. The actual sound produced was dat, with the consonant substitution transcribed as /ð/? /d/ (see Table 1). Vowel and consonant substitutions were classified as major errors, and there were ten other types of features noted: simplification of conso- 3 nant clusters (e.g., expore for explore), linking errors (e.g., Ifi twas instead of if it was), vowel or consonant epenthesis (insertion; e.g., besta for best), vowel or consonant elision (deletion; e.g., irst instead of first), absence of syllable (e.g., sev for seven), dark /l/ (e.g., candows instead of candles), incorrect word stress (e.g. visITing instead of VISiting), gram/sem (in which the error could have been semantic or grammatical instead of phonological; e.g., me mother for my mother), unsure target sounds, multiple errors (in which many errors in a small chunk made it too difficult to analyze the distinct deviations accurately), and instances in which the transcript was different than the sound heard (noted as trans diff). Note that the elision (i.e., the deletion of one or more sounds such as a vowel or a consonant) included only atypical sound omissions as to an SAE variety (e.g., mas in mask). That is, some of the linking word features (e.g., /t/ in fast food) which NSs normally say (Cruttenden, 2008) were not counted as errors in this study. Once all the deviations had been noted and transcribed, the analyst replayed the speech file from beginning to end to check the analysis. We calculated segmental errors as the total number of segmental errors divided by the total number of syllables articulated. We further analyzed segmental errors through the functional load approach, classifying them as high functional load versus low functional load, following Catford (1987). The most frequent examples of phonological substitution identified from the speech files are provided in Table 1. Rankings from 51% to 100% according to Catford’s percentage chart were considered high FL and those 50% or below were considered low FL. Examples of minimal pair sounds that corresponded to low FL segmental errors are ð/d (they vs. dey) and h/f (month vs. monf); examples of high FL segmental errors are p/b (pit vs. bit), and l/r (lock vs. rock).
Data analysis We performed a series of ANOVAs for each of the pronunciation features across the proficiency levels. Results are presented by total 4
TESOL QUARTERLY
Vowels
Low FL
High FL
Low FL
High FL
Consonants
/p/ ? /b/ (person ? berson) /h/ ? /k/ (height ? keight) /f/ ? /h/ (ph[f]one ? hone) /r/ ? /l/ (right ? light) /ð/ ? /d/ (the ? da) /h/ ?/s/ (th[h]ree ? sree) /s/?/z/ (small ? zmall) (soon ? zoon) /v/ ?/f/ (visit ? fisit) /æ/ ? /a/ (ask ? osk)
Word initial
/d/ ? /t/ (bad ? bat) (and ? ant) /t/ ? /k/ (great ? grake) /h/ ? /f/ (with ? wif) /z/?/s/ (is ? iss) (choose ? chuse) / h/ ?/s/ (with ? wis)
/z/ ? /S/ (visits ? vishits) /S/ ? /s/ (fishing ? fissing) /d/ ? /n/ (holding ? holning) /v/ ?/f/ (five ? fife) /ℨ/ ?/j/ (pleas[ʒ]ure ? pleajure) /h/ ? /f/ (something ? somefing) /i/ ? /❘/ (live ? leeve) (sit ? seet) /e/ ? /æ/ (sɛt ? sæt) (them ? tham) /ei/ ? /i/ (rate ? reet) /ai/ ? /i/ (bite ? beet) /ou/ ?/ / (boat ? bot) /ɛ/ ? /I/ (recipe ? ricipe) /ey/ V ? /ɛ/ (take ? tek) / / ? /I/ V (funny ? finny) /u/ ? / / (pool ? pull) 2 /ıc/ ? /i/ V (cheer ? cheed) /ɛ/ ? / / (restaurant ? rustaurant) (adventure ? advunture) (many ? money) / / ? /ow/ (walking ? wolking) (solve ? sowlve)
Word final
Word medial
c
Error types
c
Segmentals
TABLE 1 Frequent Phonological Errors of Phoneme Substitutions (Examples) From Speech Files
1 2 3 4 5 6 7 8 9 10 11 12 13 14 15 16 17 18 19 20 21 22 23 24 25 26 27 28 29 30 31 32 33 34 35 36 37 38 39 40 41 42 43 44
5
1 2 3 4 5 6 7 8 9 10 11 12 13 14 15 16 17 18 19 20 21 22 23 24 25 26 27 28 29 30 31 32 33 34 35 36 37 38 39 40 41 42 43 44
types of errors and errors analyzed by functional load. The study further examined the contribution of segmental features to judgments of NNSs’ oral performance. We performed a multiple regression analysis with the four proficiency levels as a dependent variable and segmental pronunciation features as independent variables.
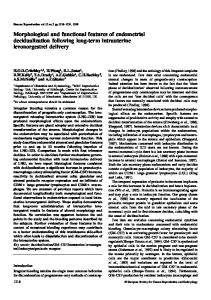
RESULTS When the results of ANOVAs yielded any significant level of difference, we conducted subsequent post hoc analyses. First of all, the total number of segmental errors (consonants and vowels combined) decreased as the proficiency increased (M = .098 in PET, M = .070 in FCE, M = .053 in CAE, and M = .035 in CPE). Mean score comparisons in the post hoc tests were statistically significant between PET and other levels and between FCE and CPE (p < .05). We further analyzed the vowel and consonant substitution errors through the functional load approach. A significant difference was found across proficiency levels in the high functional load errors (F3,111 = 8.65, p = .000 for high FL consonant errors and F3,111 = 12.36, p = .000 for high FL vowel errors), but not in the low load functional errors. The only significant difference in the low functional load errors was in the comparison between the lowest level (B1) and the highest level (C2) in the consonant errors (p = .023). However, no difference across levels was found in the low FL vowel errors. Table 2 shows descriptive statistics for each category of the normalized segmental errors. Figures 1 and 2 illustrate the changes between high FL and low FL error occurrences across the CEFR levels. In consonant errors (Figure 1), the low functional load errors, indicated by the light gray line, do not drop significantly from the low level (PET) to the high level (CAE), but the high functional load errors in the dark line decline substantially.
TABLE 2 Frequency of Segmental Errors Analyzed by Functional Loads
Functional loads (FL)
B1, PET (N = 32) Mean (SD)
B2, FCE (N = 32) Mean (SD)
C1, CAE (N = 34) Mean (SD)
C2, CPE (N = 22) Mean (SD)
High FL consonants Low FL consonants High FL vowels Low FL vowels
.021 .036 .028 .018
.011 .033 .011 .018
.006 .031 .008 .011
.004 .020 .003 .008
6
(.02) (.03) (.02) (.02)
(.01) (.03) (.02) (.01)
(.01) (.03) (.02) (.00)
(.00) (.02) (.01) (.00)
TESOL QUARTERLY
1 2 3 4 5 6 7 8 9 10 11 12 13 14 15 16 17 18 19 20 21 22 23 24 25 26 27 28 29 30 31 32 33 34 35 36 37 38 39 40 41 42 43 44
0.04 0.035 0.03
Errors still produced
0.025 High FL
0.02
Low FL 0.015 0.01 0.005
FIGURE 1. Functional load errors: Consonants.
0.03
0.025
0.02
0.015
0.01
Errors still produce d
HighFL Low FL
0.005
4
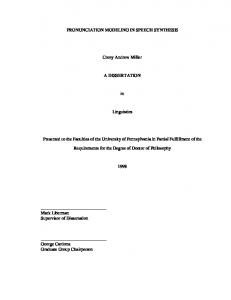
FIGURE 2. Functional load errors: Vowels.
The same pattern occurs with vowel errors. The high FL vowel errors decreased significantly as the proficiency level increased. However, the low FL errors did not show such a pattern. What is interesting in Figures 1 and 2 is that speakers in the highest proficiency level (CPE) still make errors, but these are mostly low FL errors. It is evident that both vowel and consonant errors decrease with proficiency, but drastic changes were shown in high FL errors. Among the ten segmental and syllable variables, only two categories 5 (addition/deletion errors and linking errors) showed a significant difference across the proficiency levels. In some cases, the frequency of errors was not sufficient for an ANOVA analysis. In the case of addition/ deletion errors, the mean error rate was .195 for PET, .008 for FCE, .009 for CAE, and .003 for CPE. Linking word errors decreased from .007 at 7
1 2 3 4 5 6 7 8 9 10 11 12 13 14 15 16 17 18 19 20 21 22 23 24 25 26 27 28 29 30 31 32 33 34 35 36 37 38 39 40 41 42 43 44
the PET level to .006 at the FCE level, .002 at the CAE level, and .002 at the CPE level. The addition variable includes consonant vowel epenthesis or schwa paragogue as in milka for milk, and examples of elision or deletion include roo for room and proceh for process. The study further examined the contribution of segmental features to judgments of NNSs’ oral performance. We performed a multiple regression analysis with the four proficiency levels as a dependent variable and all of the segmental errors as an independent variable. As can be seen in Table 3, the results show that 41% of variance (R2 = .01) in Cambridge ESOL’s four proficiency levels was attributable to segmental pronunciation errors. Among those features (both high FL/low FL vowel and consonant errors, and the ten other 6 segmental errors), three variables (high FL consonants, high FL vowels, and incorrect stress errors) showed statistical significance.
DISCUSSION Overall findings suggest that there are distinctive differences in the frequency of some pronunciation features across CEFR levels (PET, FCE, CAE, CPE) such as addition/deletion errors and linking errors or high FL substitution errors. Clear distinctions can be found between PET (the lowest) and CPE (the highest), but less distinctive patterns between adjacent levels (e.g., FCE and CAE). Note that pronunciation features identified in this study are not discrete for each level, but rather continuous (i.e., gradual changes) across the proficiency levels. That is, there is some fuzziness of distinctions at adjacent levels in pronunciation features, which is unavoidable, if we consider the complexity of the configuration of components in any overall judgment of proficiency (Lee & Schallert, 1997). What is interesting in our findings is that among segmental and syllable errors, significant difference across levels was found mostly in the high FL errors, but not necessarily in the low FL errors. See examples of errors in Table 1. As proficiency increased, high FL errors in both vowels and consonants dropped significantly in each level, but changes of low FL errors were not noticeable. This finding suggests TABLE 3 Linear Regression of Significant Variables on Oral Proficiency Levels Total R2 = .41 High LF consonant errors High LF vowel errors Incorrect stress
8
Standardized coefficient beta .31 .34 .32
Significance
t 3.5 3.8 3.9
.001 .000 .000
TESOL QUARTERLY
1 2 3 4 5 6 7 8 9 10 11 12 13 14 15 16 17 18 19 20 21 22 23 24 25 26 27 28 29 30 31 32 33 34 35 36 37 38 39 40 41 42 43 44
that the functional load approach should inform L2 assessment, not just L2 production instruction, because learners’ errors can be weighed differently in the high-stakes testing context. As can be seen in Figures 1 and 2, high-proficiency speakers (CPE) still produce errors in their pronunciation, but Cambridge ESOL raters considered their speech to be highly proficient. Examples of those errors included /ð/ ? /d/, /h/ ? /f/, /v/ ? /f/, /u/ ? /ʊ/, or /ɪə/ ? /i/. These phonological deviations are the ones that commonly appear across varieties of English worldwide. That is, speakers of the New Englishes are known to produce /ð/ and /h/ in various ways, to distinguish minimally between some short and long vowels, or to pronounce diphthongs as monophthongs (Jenkins, 2009, pp. 27–28). Overall, such varieties may make NNSs’ speech accented, and different from NS norms, but may not essentially affect intelligibility. One of the important findings in this study is to show the contribution of selected segmental features to the oral proficiency assessment. Previous research has already attempted to investigate the impact of suprasegmentals on oral assessment (Kang, Rubin, & Pickering, 2010). The current study makes a complementary contribution to the field by examining salient segmental features in the assessment context. While the 29 suprasegmental variables (which included speech rate, pauses, stress, and intonation) explained about 50% of variance in the speaking test (Kang et al., 2010), the segmental errors explained about 40% of variance in oral assessment. During the past 25 years, pronunciation teachers have emphasized suprasegmentals rather than segmentals in promoting intelligibility, but empirical evidence for this belief has been sparse (Levis, 2005, p. 369). The current findings provide direct evidence to support the contribution of segmental pronunciation deviation to L2 oral proficiency ratings.
CONCLUSION This study contains implications for assessment and pedagogy. As to the former, we now have a better understanding of which phonological features can be expected to improve with proficiency in the current large-scale assessment context. Therefore, this knowledge can be used to enhance the scoring criteria of English assessments’ speaking portions. Not only will the identification of significant features contribute to more empirically based rubrics, but it can also be used to guide rater training and development, which will in turn lead to more accurate, objective scoring of spoken English proficiency. As to the pedagogical implications, this study first provides support for the functional load hypothesis. The errors that are categorized as 9
1 2 3 4 5 6 7 8 9 10 11 12 13 14 15 16 17 18 19 20 21 22 23 24 25 26 27 28 29 30 31 32 33 34 35 36 37 38 39 40 41 42 43 44
high FL are directly associated with the increase of L2 proficiency; that is, as learners’ proficiency increases, their percentage of high FL errors decreases. Thus, to structure empirically supported pronunciation instruction, phonemes with a high FL should be focused on in the classroom over those with a low FL (e.g., /ð/, /h/). In other words, ESL teachers should prioritize pronunciation features in classroom instruction for the purpose of intelligibility. This study also lends support to the idea that certain errors may make speech accented without affecting intelligibility. Such phonological variants produced by high-proficiency speakers were found to share features with those in the New Englishes, which are different from native English norms but have developed through the educational systems in areas where a native variety of English is not the language spoken by most of the population and becomes “nativised” by adopting some language features of its own (Jenkins, 2009, p. 26). The findings imply that English language learners can still have high scores in the high-stakes speaking assessment regardless of their complete conformity to native norms. Future research is called for regarding how core features of World Englishes relate to common errors in NNSs’ oral assessment for each proficiency level. One of the limitations to this study was that the analysis was conducted based on candidates’ levels instead of their individual scores. Thus, although discrimination between the four Cambridge ESOL levels was possible, more nuanced information on individuals’ performance ratings was not accounted for. Also, because the test takers came from such a wide array of first language (L1) backgrounds (which resulted in a small and unequal sample size of each subgroup), no specific L1 analyses were conducted. Further research is needed to investigate the relationship between each of these pronunciation features and L1 backgrounds and to highlight the ones that learners and instructors need to focus on (Swan & Smith, 2001). Next, because this study is part of a larger project, it reports only one aspect of the pronunciation features: segmentals. A wide array of pronunciation features including both segmentals and suprasegmentals on judgments of NNSs’ oral speech can be investigated. Finally, a further study can explore the variability among NSs’ accent varieties because the current study has been limited to NNS’ phonological deviations from NS norms. ACKNOWLEDGMENTS This work was supported by the Cambridge ESOL Funded Research Program Round 2.
10
TESOL QUARTERLY
1 2 3 4 5 6 7 8 9 10 11 12 13 14 15 16 17 18 19 20 21 22 23 24 25 26 27 28 29 30 31 32 33 34 35 36 37 38 39 40 41 42 43 44
THE AUTHORS Okim Kang (PhD) is an assistant professor of applied linguistics at Northern Arizona University. Her research focuses on second language pronunciation, oral language proficiency assessment, speech production and perception, language attitudes, and World Englishes. She is the recipient of the 2013 TOEFL Outstanding Young Scholar Award and the Christopher Brumfit PhD/ EdD Thesis 2009 Award by Cambridge University Press and Journal of Language Teaching. Meghan Moran is a second-year doctoral student in the program of applied linguistics at Northern Arizona University. She received a master’s degree from The Pennsylvania State University in teaching English as a second language in 2008, after which she taught ESOL in a public school in western New York for 2 years. Her interests include language planning and policy, pronunciation, and the intersection between the two.
REFERENCES Brown, A. (1991). Pronunciation models. Singapore: Singapore University Press. Catford, J. C. (1987). Phonetics and the teaching of pronunciation. In J. Morley (Ed.), Current perspectives on pronunciation: Practices anchored in theory (pp. 83–100). Washington, DC: TESOL. Cruttenden, A. (2008). Gimson’s pronunciation of English. London, England: Hodder Education. Davies, A., Hamp-Lyons, L., & Kemp, C. (2003) Whose norms? International proficiency tests in English. World Englishes, 22, 571–584. doi:10.1111/j.1467-971X. 2003.00324.x Derwing, T. M., & Munro, M. J. (1997). Accent, intelligibility, and comprehensibility: Evidence from four L1s. Studies in Second Language Acquisition, 19, 1–16. doi:10.1017/S0272263197001010 Fayer, J. M., & Krasinski, E. K. (1987). Native and nonnative judgments of intelligibility and irritation. Language Learning, 37, 313–326. doi:10.1111/j.1467-1770. 1987.tb00573.x Hamp-Lyons, L., & Davies, A. (2008). The Englishes of English tests: Bias revisited. World Englishes, 27, 26–39. doi:10.1111/j.1467-971X.2008.00534.x Harding, L. (2011). Accent and listening assessment: A validation study of the use of speakers with L2 accents on an academic English listening test. Frankfurt, Germany: Peter Lang. Jenkins, J. (2006). Current perspectives on teaching World Englishes and English 7 as a lingua franca. TESOL Quarterly, 40, 157–181. Jenkins, J. (2009). World Englishes: A resource book for students. London, England: Routledge. Kang, O., Rubin, D., & Pickering, L. (2010). Suprasegmental measures of accentedness and judgments of English language learner proficiency in oral English. Modern Language Journal, 94, 554–566. doi:10.1111/j.1540-4781.2010.01091.x Kenkel, J. M., & Tucker, R. (1989). Evaluation of institutionalized varieties of English and its implications for placement and pedagogy. World Englishes, 8, 8 201–214. Lee, J., & Schallert, D. (1997). The relative contribution of L2 language proficiency and L1 reading ability to L2 reading performance: A test of the 11
1 2 3 4 5 6 7 8 9 10 11 12 13 14 15 16 17 18 19 20 21 22 23 24 25 26 27 28 29 30 31 32 33 34 35 36 37 38 39 40 41 42 43 44
threshold hypothesis in an EFL context. TESOL Quarterly, 31, 713–739. doi:10. 2307/3587757 Levis, J. (2005). Changing contexts and shifting paradigms in pronunciation teaching. TESOL Quarterly, 39, 369–377. doi:10.2307/3588485 Munro, M. J., & Derwing, T. M. (2006). The functional load principle in ESL 9 pronunciation instruction: An exploratory study. System, 34, 520–531. Seidlhofer, B. (2011). Understanding English as a lingua franca. Oxford, England: Oxford University Press. Smith, L., & Nelson, C. L. (2006). World Englishes and issues of intelligibility. In B. B. Kachru, Y. Kachru, & C. L. Nelson (Eds.), The handbook of World Englishes (pp. 428–445). Malden, MA: Blackwell. Swan, M., & Smith, B. (2001). Learner English: A teacher’s guide to interference and other problems. Cambridge, England: Cambridge University Press. Taylor, L. (2006). The changing landscape of English: Implications for language 10 assessment. English Language Teaching Journal, 60, 51–60.
12
TESOL QUARTERLY
Author Query Form Journal: Article:
TESQ 152
Dear Author, During the copy-editing of your paper, the following queries arose. Please respond to these by marking up your proofs with the necessary changes/ additions. Please write your answers on the query sheet if there is insufficient space on the page proofs. Please write clearly and follow the conventions shown on the attached corrections sheet. If returning the proof by fax do not write too close to the paper’s edge. Please remember that illegible mark-ups may delay publication. Many thanks for your assistance.
Query reference Query
1
AUTHOR: The number in parentheses adds up to 86. Did students represent 86 languages from 21 countries?
2
AUTHOR: Please check cheer ? cheed
3
AUTHOR: Should this say 11?
4
AUTHOR: Both Figures 1 and 2 are low resolution. Please resupply at higher resolution. And make sure text boxes in them are big enough to show all text.
5
AUTHOR: See previous query about 10 vs. 11.
6
AUTHOR: See previous query.
7
AUTHOR: Please provide doi if available for Jenkins 2006.
Remarks
8
AUTHOR: Please provide doi if available for Kenkel & Tucker 1989.
9
AUTHOR: Please provide doi if available for Munro & Derwing 2006.
10
AUTHOR: Please provide doi if available for Taylor 2006.
USING e-ANNOTATION TOOLS FOR ELECTRONIC PROOF CORRECTION Required software to e-Annotate PDFs: Adobe Acrobat Professional or Adobe Reader (version 8.0 or above). (Note that this document uses screenshots from Adobe Reader X) The latest version of Acrobat Reader can be downloaded for free at: http://get.adobe.com/reader/ Once you have Acrobat Reader open on your computer, click on the Comment tab at the right of the toolbar:
This will open up a panel down the right side of the document. The majority of tools you will use for annotating your proof will be in the Annotations section, rkevwtgf"qrrqukvg0"YgÓxg"rkemgf"qwv"uqog"qh"vjgug"vqqnu"dgnqy