Functional Programming Algorithms for Constructing 3D Geological Models B.F.J. Kelly1 and B.M.S. Giambastiani1 1
The University of New South Wales Connected Waters Initiative Sydney, NSW, Australia, 2052 Telephone: 61-2-9385-1853 1 Email:
[email protected] 2 Email:
[email protected]
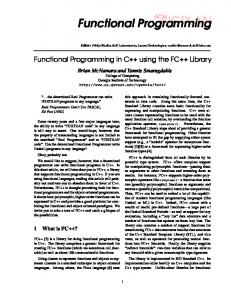
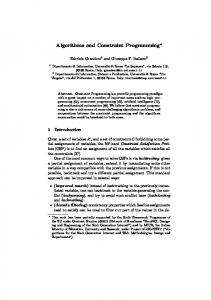
1. Introduction Three dimensional (3D) geological models are commonly used in the petroleum, mining and groundwater sectors for examining structural relationships, volumes and the distribution of properties. These models are built from irregularly spaced data that define fault surfaces or the top, bottom and sides of structural units (formations, period boundaries etc.). Geological data can be collated as lists, making these data amenable to manipulation using functional programming algorithms. Scripts written in functional languages are concise and resemble more closely traditional mathematical notation (Goldberg 1996, Hudak 1989). When the functional programming style is used in a symbolic mathematical program with 3D graphics short scripts can be written for constructing 3D geological models. When teaching the fundamentals of 3D geological model construction symbolic mathematical programs allow students with little or no programming experience to learn how to sort the data, interpolate/extrapolate surfaces over the domain, and build 3D geological models using a set of logical expressions that dictate how the surfaces intersect to represent geological units. Exposing the students to the mathematics and scripting steps provides insights into the exactness and limitations of the models and introduces them to an open ended modelling environment. Two algorithms are presented. The first script projects point measurements (x, y, z, inclination, azimuth) from field or map data along an inclined line to extend the data to form a series of points that define a surface which can subsequently be gridded. The second script performs inverse distance gridding (Yamamoto 1998). These scripts are written using the symbolic programming and visualisation software Mathematica (Wolfram Research, Inc., 2008), which is probably the most widely used functional programming language (Hinsen 2009). The application of the algorithms is demonstrated by constructing a 3D geological structural model of the Maules Creek catchment in NSW, Australia. The data sets consist of a digital elevation model (DEM) (fig. 1), borehole bedrock picks (fig. 1), period geological boundaries digitised from the 1:250000 geological map (the top of the Permian, and Triassic (fig. 2)), and the digitised limit of the Tertiary basalt (fig. 2). Inclination and azimuth details were inferred from the geological map. Elevations were assigned to the digitised map values by defining an approximate function for the DEM (using the Mathematica function Interpolation) and then applying this function to the list of points. This process is described in more detail below.
Figure 1. The DEM sorted into the outcropping rock and alluvium (left) and the combined DEM rock data and borehole bedrock picks (right).
Figure 2. The geological map of Maules Creek (left) and the digitised data in 3D (right).
2. Transforming Lists Mathematica treats everything as an expression. The list {1,2,3} is an expression with a head List and three elements. This could be written List[1,2,3]. Operations can be performed on any expression. There are two functional programming functions that are commonly used: Apply and Map. To sum the elements of the list above the notation Apply[Plus,{1,2,3}] is used. This returns the value 6. A delayed function can be defined f[x_]:= x^2. This function can then be applied separately to each element in the list by mapping the function onto the list, Map[f,{1,2,3}], which returns the new list {1,4,9}. These are the fundamental processes applied in the scripts below.
3. Projection of Field and Map Data Starting at the measurement point (x0,y0,z0) the n-th point (xn,yn,zn) projected along the linear line in the down dip direction is defined by: xn = x0 + Cos(inclination ) × Sin( azimuth ) × n × s y n = y 0 + Cos(inclination ) × Cos( azimuth ) × n × s z n = z 0 − Sin(inclination ) × n × s
(1)
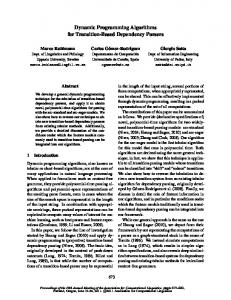
where s is the size of the interval between each point (de Kemp 1998, Bistacchi et al. 2008, Zanchi et al. 2009). A set of points is projected both up and down dip from the field or digitised data using the new function GeoPointProjectLine (Section 9). The results of applying GeoPointProjectLine to the structural top data in fig. 2 are shown in fig. 3.
Figure 3. Projected structural top surface data.
4. Describing Surfaces Using Approximate Functions Haneberg (2004) published a Mathematica script for inverse distance gridding, but it is slower than the algorithm InverseDistanceGrid2D presented in Section 9. The new function InverseDistanceGrid2D takes advantage of the function Nearest and uses no Do loops for faster calculation times. The grid node values Zx,y are estimated via: zi d ip = , N 1 ∑i=1 d p i
∑
N
i =1
Z x, y
(2)
where di is the Euclidian distance between the node and the i-th data point, N is the number of neighbouring points, and p is the power of distance. Within the InverseDistanceGrid2D module the data are interpolated/extrapolated onto a rectangular grid and then the function Interpolation is applied to the grid list to define an approximate function at all locations over the domain. The results of applying InverseDistanceGrid2D to the surface data sets are shown in fig. 4.
Figure 4. Surfaces calculated by applying InverseDistanceGrid2D to the data in fig. 3.
5. Building the 3D Structural Model Once each surface has been defined by an approximate function the volume that represents each geological unit is plotted using the function RegionPlot3D. This function plots a region in the domain where the predicate is True. The predicate is defined using a sequence of relational and logical operators to delineate the region of interest. For example to define the Jurassic region the following predicate is used: z > fTriassic[x,y] && z < fRock[x,y] && z < fMookiThrust[x,y]
where fTriassic, fRock and fMookiThrust are the approximate functions that define the top of the Triassic, the eroded rock surface (DEM + borehole rock picks) and the fault surface that defines the Mooki Thrust. This procedure is applied to each geological unit of interest and then the units are combined into a single image shown in fig. 5.
Figure 5. 3D geological structural model of the Maules Creek catchment. The geological periods are Carboniferous (cream), Permian (blue), Triassic (green), Jurassic (pink), Tertiary basalt (red), and Quaternary alluvium (yellow).
6. Conclusion Symbolic programs like Mathematica provide a simple method to demonstrate data manipulation, interpolation and geological unit representation. By honouring the functional programming paradigm catchment scale 3D geological models can be constructed using short scripts that can be easily interpreted by students with limited programming experience. The models rigorously honour the data, can be used to determine the thicknesses and volumes of the regions of interest, and provide the conceptual framework for further investigations.
7. Acknowledgements The authors would like to thank the Australian Government National Water Commission, and the Cotton Catchment Communities CRC for their financial support.
8. References Bistacchi A, Massironi M, Dal Piaz GV, Dal Piaz G, Monopoli B, Schiavo A, Toffolon G, 2008, 3D fold and fault reconstruction with an uncertainty model: An example from an Alpine tunnel case study. Computers and Geosciences 34(4): 351-372. de Kemp EA, 1998, Three-dimensional projection of curvilinear geological features through direction cosine interpolation of structural field observations. Computers and Geosciences 24(3): 269-284. Goldberg B, 1996, Functional programming languages. ACM Computing Surveys, 28(1):249-251. Haneberg, WC, 2004, Computational Geosciences with Mathematica. Springer-Verlag Berlin Heidelberg. ISBN 3-540-40245-4. Hinsen K, 2009, The promises of functional programming. Computing in Science Engineering, 11(4):86-90. Hudak P, 1989, Conceptual, evolution, and application of functional programming languages. ACM Computing Surveys, 21(3):359-411. Wolfram Research, Inc., 2008, Mathematica edition: version 7.0, Wolfram Research, Inc., Champaign, Illinois. Available from www.wolfram.com Yamamoto JK, 1998, A review of numerical methods for the interpolation of geological data. An. Acad. Bras. Ci., 70(1): 91-116. Zanchi A, Francesca S, Stefano Z, Simone S, Graziano G, 2009, 3D reconstruction of complex geological bodies: Examples from the Alps. Computers and Geosciences, 35(1): 49-69.
9. Functions 9.1 Projection of Field and Map Point Data GeoPointProjectLine converts a point measurement list consisting of the elements {x,y,z,inclination,azimuth} into an extended list of points projected up and down dip. The values of stepin and countin are set to provide an adequate number of additional data over the domain. GeoPointProjectLine[geodatain_, stepin_, countin_]:= Module[{step,projectDown,projectUp,projectionTable}, projectDown = Flatten[N[Table[{ geodatain[[i,2]]+(Cos[geodatain[[i,5]]°]*Sin[geodatain[[i,6]]°]) geodatain[[i,3]]+(Cos[geodatain[[i,5]]°]*Cos[geodatain[[i,6]]°]) geodatain[[i,4]]-Sin[geodatain[[i,5]]°] stepin n}, {i,Length[geodatain]},{n,0,countin}]],1]; projectUp = Flatten[N[Table[{ geodatain[[i,2]]-(Cos[geodatain[[i,5]]°]*Sin[geodatain[[i,6]]°]) geodatain[[i,3]]-(Cos[geodatain[[i,5]]°]*Cos[geodatain[[i,6]]°]) geodatain[[i,4]]+Sin[geodatain[[i,5]]°] stepin n}, {i,Length[geodatain]},{n,0,countin}]],1]; projectionTable = Join[projectUp,projectDown]; Return[projectionTable]]
stepin n, stepin n,
stepin n, stepin n,
Usage: step = 2000; count = 25; dataout = GeoPointProjectLine[data,step,count]
9.2 Inverse Distance Gridding InverseDistanceGrid2D interpolates irregularly spaced data {{x1,y1,z1},{x2,y2,z2},…}
that define the surface onto a rectangular grid {{x1,y1},{x2,y2,},…} and then calculates an approximate function for the surface. The approximate function defines the z estimate over the domain of interest. The domain is defined by the dimensions of the input grid.
InverseDistanceGrid2D[datain_,k_,p_,gridin_]:= Module[{nfunction,nset,xyz,xy,z,d,zestimate,zgrid,zfunction}, nfunction=Nearest[datain[[All,{1,2}]]Jdatain[[All]]]; nset[{x_,y_}]:= nfunction[{x,y},k]; xyz=Map[nset,gridin]; xy=xyz[[All,All,{1,2}]]; z=xyz[[All,All,3]]; d=Table[EuclideanDistance[gridin[[i]],xy[[i,j]]], {i,Length[gridin]},{j,Length[xy[[1]]]}]; zestimate=Apply[Plus,z/d^p,1]/Apply[Plus,1/d^p,1]; zgrid=Table[{gridin[[i,1]],gridin[[i,2]],zestimate[[i]]}, {i,Length[gridin]}]; zfunction=Interpolation[zgrid,MethodJ"Hermite",InterpolationOrderJ3]; Return[zfunction]]
Usage: ksearch = 3; power = 2; grid2D = Flatten[Table[{x,y},{x,xmin,xmax,xspace},{y,ymin,ymax,yspace}],1]; surfacefunction = InverseDistanceGrid2D[sparsedata,ksearch,power,grid2D]
Above sparsedata is the irregularly spaced data that defines the surface, ksearch is the number of nearest neighbour points to use to estimate the grid node value z, power is the power of distance (1, 2, 3, …), and grid2D is the rectangular grid list {{x1,y1},{x2,y2,},…}.