SS symmetry Article
Fuzzy System-Based Face Detection Robust to In-Plane Rotation Based on Symmetrical Characteristics of a Face Hyung Gil Hong, Won Oh Lee, Yeong Gon Kim, Ki Wan Kim, Dat Tien Nguyen and Kang Ryoung Park * Division of Electronics and Electrical Engineering, Dongguk University, 30 Pildong-ro 1-gil, Jung-gu, Seoul 100-715, Korea;
[email protected] (H.G.H.);
[email protected] (W.O.L.);
[email protected] (Y.G.K.);
[email protected] (K.W.K.);
[email protected] (D.T.N.) * Correspondence:
[email protected]; Tel.: +82-10-3111-7022; Fax: +82-2-2277-8735 Academic Editor: Angel Garrido Received: 15 June 2016; Accepted: 29 July 2016; Published: 3 August 2016
Abstract: As face recognition technology has developed, it has become widely used in various applications such as door access control, intelligent surveillance, and mobile phone security. One of its applications is its adoption in TV environments to supply viewers with intelligent services and high convenience. In a TV environment, the in-plane rotation of a viewer’s face frequently occurs because he or she may decide to watch the TV from a lying position, which degrades the accuracy of the face recognition. Nevertheless, there has been little previous research to deal with this problem. Therefore, we propose a new fuzzy system–based face detection algorithm that is robust to in-plane rotation based on the symmetrical characteristics of a face. Experimental results on two databases with one open database show that our method outperforms previous methods. Keywords: TV environment; Face recognition; In-plane rotation of the face; Fuzzy systems; Symmetrical characteristics of a face
1. Introduction With the rapid development of face recognition technology, it has been widely used in various applications such as authentication for financial transactions, access control, border control, and intelligent surveillance systems. Many studies on 2 dimensional (2D) face recognition have been performed [1–6] with 2D face detection [7,8], and there have been also previous studies on 3D face recognition [9,10]. They proposed fuzzy system–based facial feature fusion [1], convolutional neural network (CNN)-based face recognition [2,4,6], CNN-based pose-aware face recognition [3], and performance benchmarking of face recognition [5]. In addition, CNN-based face detection [7] with performance benchmarking of face detection [8] was also introduced. Three-dimensional face recognition based on geometrical descriptors and 17 soft-tissue landmarks [9] and the 3D data acquired with structured light [10] were performed as well. However, most of these previous studies were done with face images or data of high pixel resolution which are captured at a close distance from camera. Along with the recent development of digital TV, studies have analyzed the viewers that use intelligent TV technologies such as smart TV and Internet protocol TV [11–15]. An intelligent TV provides a personalized service to the viewer. It includes a camera to obtain identity information in order to receive consumer feedback [11–15]. In order to obtain the information of the viewer using this camera, a face analysis system is used that includes the functionalities of face detection, recognition, and expression recognition [11–15]. However, different from previous research on face detection and recognition [1–10], because the camera is attached to the TV and the distance between the TV and viewer is far within the environment of watching TV, the input images are usually captured at a far Symmetry 2016, 8, 75; doi:10.3390/sym8080075
www.mdpi.com/journal/symmetry
Symmetry 2016, 8, 75
2 of 28
distance from the camera. Consequently, the image pixel resolution of a face area is low quality with blurring of the face image. In addition, it is often the case that people watch TV while lying on their sides. Therefore, the in-plane rotation of a face more frequently happens in images compared to the out-of-plane rotation (yaw and pitch) of a face because the face image is captured while people are watching TV, including the camera. In previous research, An et al. adopted the methods of face detection and recognition in order to determine the identity of a TV viewer [11]. However, this method is only available for frontal face detection [11,13,16], and cannot be used for face recognition of in-plane or out-of-plane rotated faces [11]. In order to build a smart home environment, Zuo et al. proposed a method for face and facial expression recognition using a smart TV and home server, but this method did not deal with face rotation either [13]. In order to recognize a rotated face, previous methods for multi-view face detection have been based on the adaptive boosting (Adaboost) method [17–19]. However, an intensive training procedure is required to build the multi-view face detector, and these studies did not deal with the face recognition of rotated faces. There are face detection and recognition studies that consider yaw, pitch, and in-plane face rotations [20–32]. Liu proposed a face recognition method that considers head rotation (yaw and pitch rotation) using Gabor-based kernels and principal component analysis (PCA), but this system does not deal with in-plane rotation [20] although the in-plane rotation of a face frequently occurs when a viewer watches TV while lying on his or her side. Mekuz et al. proposed face recognition that considers in-plane rotation using locally linear embedding (LLE) and PCA [26]. They also proposed face recognition methods that consider the in-plane rotation of a face using complex wavelet transforms [27] and Gabor wavelets [28]. However, they only considered in-plane rotations at small angles [26–28]. Anvar et al. proposed a method for estimating the in-plane rotation angle of a face based on scale invariant feature transforms (SIFTs), but they did not deal with face recognition [30]. In other research [31], Du et al. proposed a face recognition method based on speeded-up robust features (SURF). Their method can cope with in-plane rotated face images because of the characteristics of the scale and the in-plane rotation invariance of SURF. However, they did not show the specific experimental recognition results of in-plane rotated faces. In previous research [32], Lee et al. proposed a method of detecting the correct face box from in-plane rotated faces in a TV environment, but multiple face candidates are obtained by their method. Because all these candidates are used for face recognition, the processing time and recognition error are high. Recently, there have been studies conducted on keypoint detection of a face image in References [33–35]. Using the results of the keypoint detection of a face image, the compensation of the in-plane rotation of a face can be possible. However, in most previous studies including References [33–35], keypoint detection has been done with face images of high pixel resolution which are captured at a close distance to the camera. In contrast, the input images captured at a far distance from the camera (maximum 2.5 m) are used in our research because our study aims at face recognition at far distances in the environment of watching TV. Consequently, the image pixel resolution of a face area is so low in addition to the blurring of a face image that the previous methods of keypoint detection are difficult to apply to the face images used in our research. Therefore, in order to address the shortcomings of previous research, we propose a new face recognition algorithm that is robust to in-plane rotation based on symmetrical characteristics of a face in the TV environment. Compared to previous work, our research is novel in the following three ways, which are the main differences between our research and previous research [32]. ‚ ‚
Multiple face region candidates for a face are detected by image rotation and an Adaboost face detector in order to cope with the in-plane rotation of a face. The credibility scores for each candidate are calculated using a fuzzy system. We use four input features. In general, the more symmetrical the left and right halves of the candidate face box are, the sharper the gray-level difference histogram (GLDH) (which is calculated by the pixel difference between the symmetrical positions based on the vertical axis that evenly bisects the
Symmetry 2016, 8, 75
3 of 28
Symmetry 2016,is. 8, 75Therefore, face box)
‚
3 ofin28this we define the degree of sharpness of the GLDH as the Y score research. Then, the differences in the Y score, pixels, average, and histogram between the left research. Then, the differences in the Y score, pixels, average, and histogram between the left and right halves of the candidate face box are used as the four features based on the symmetrical and right halves of the candidate face box are used as the four features based on the symmetrical characteristics of a face. characteristics of a face. accuracy of face recognition is isincreased whosecredibility credibilityscore score is TheThe accuracy of face recognition increasedby byselecting selectingthe the face face region region whose the is highest for recognition. the highest for recognition.
The remainder of this paper is organized as follows. In Section 2, we explain the proposed fuzzyThe remainder of this paper is organized as follows. In Section 2, we explain the proposed based face recognition system. The experimental results with discussions and conclusions are fuzzy-based recognition system. The experimental results with discussions and conclusions are described face in Sections 3 and 4, respectively.
described in Sections 3 and 4, respectively. 2. Proposed Face Recognition System
2. Proposed Face Recognition System 2.1. Overview of the Proposed Method
2.1. Overview of the Proposed Method
Figure 1 shows the overall procedure of our face recognition system. Using an image captured
1 shows theconnected overall procedure of ourbox face(STB) recognition Using an image captured byFigure the web camera to the set-top for thesystem. smart TV camera (see the detail by the explanations web camera in connected to the set-top box (STB) for the smart TV camera (see the detail explanations Section 3.1), the region of interest (ROI) of the face is determined by image differences in Section regionand of interest (ROI) of the faceimages, is determined by image differences between3.1), the the captured (pre-stored) background morphological operations, and between color face region is detected images, within the face ROI by the Adaboostand method image[32]. the filtering captured[32]. andThe (pre-stored) background morphological operations, colorand filtering Therotation. face region is detected within the face ROI by the Adaboost method and image rotation.
Figure1.1.Flowchart Flowchart of the Figure the proposed proposedmethod. method.
Incorrect face regions can be removed using verification based on GLDH. With the face
Incorrect face regions can be removed using verification based on GLDH. With the face candidates, candidates, four features are extracted. Using these four features and the fuzzy system, one correct fourface features are extracted. Using these four features and the fuzzy system, one correct face region region is selected from among the candidates. This selected face region is recognized using a is selected from among the candidates. This selected face region is recognized using a multi-level
Symmetry 2016, 8, 75 Symmetry 2016, 8, 75
of 28 4 of4 28
multi-level local binary pattern (MLBP). In previous research [32], steps (1)–(4) and (7) of Figure 1 are local binary pattern In previous researchin[32], (1)–(4) and (7)steps of Figure 1 are and used, and steps (5)(MLBP). and (6) are newly proposed oursteps research. Through (5) and (6),used, one correct (upright) be selected among multiple candidates, canone reduce the (upright) processing steps (5) andface (6) candidate are newlycan proposed in our research. Through steps (5)which and (6), correct time and recognition error. among multiple candidates, which can reduce the processing time and face candidate can be selected recognition error. 2.2. Detection and Verification of the Face Region 2.2. Detection and Verification of the Face Region Using the image captured by the smart TV camera, the face ROIs are detected using image Using the (between image captured by the smart TV camera, face captured ROIs are detected image differencing the pre-stored background and the current images), using morphological differencing (between the pre-stored background and current captured images), morphological operations, and color filtering [32]. The main goal of our research is face detection robust to in-plane operations, andfacial color feature filteringextraction [32]. The main goal of our research is face we detection robust to method in-plane of rotation (not or face recognition). Therefore, use the simple rotation (not facial featurein extraction or facethe recognition). we use simplethis method using image differences order to detect rough ROI Therefore, of the human bodythe because is notofthe using image differences in order to detect the rough ROI of the human body because this is not the core part of our research. Because the final goal of our research is to detect the correct face region (not core of our research. Because thedetected final goal ofof our is to detect correct face region thepart human body) from the roughly ROI theresearch human body, more the accurate face ROI can be (not the human body) from the roughly detected ROI of the body, more accurate face ROIimage can located by morphological operation, color filtering, andhuman the Adaboost face detector with berotation, located by morphological operation, color filtering, and the Adaboost face detector with image which can reduce the error in the difference image caused by background change. That is, rotation, which can reduce theiserror in theby difference image(between caused by That is, after the difference image obtained differencing thebackground pre-stored change. background and after the difference image is obtained by differencing (between the pre-stored background and current current captured images), the area of the human body shows large difference values because the captured images), the areaare of different the human body shows large difference values because the pixelsThen, withinthe pixels within this area between the background and current captured image. this area area are different between the background andfrom current captured Then, the roughHowever, area of rough of the human body can be separated other regions image. by image binarization. the human body canthe be separated other regions image binarization. However, small holes small holes inside area of thefrom human body in thebybinarized image still exist because some pixel inside thewithin area ofthis the area human in the binarized image still exist and because some pixel values within values canbody be similar between the background current captured image. These this areagive can abebad similar the background captured These holes give a bad holes effectbetween on the correct detection and of a current face, and they canimage. be removed by morphological effect on the correct detection of a face, and they can be removed by morphological operation. operation. Because the area of the human body includes the hair, face, and body, the rough Because candidate theregion area of human includesby thecolor hair,filtering. face, andThen, body, within the rough of a face can ofthe a face can body be separated thecandidate remainingregion area, more accurate beface separated by color filtering. Then, within the remaining area, more accurate face regions can be regions can be detected by the Adaboost face detector. To handle the in-plane rotation of a face, detected by theface Adaboost Tothe handle in-plane rotationtoofthe a face, the multiple the multiple regionsface are detector. located by face the detector according in-plane rotation face of the regions image.are located by the face detector according to the in-plane rotation of the image. The resulting image the face face regions regionsare aredetected detectedby The resulting imageisisshown shownininFigure Figure2a. 2a. Using Using the the face ROIs, the byAdaboost Adaboostand andimage image rotation. rotation. The The Adaboost Adaboost algorithm algorithm is based on on aastrong strongclassifier classifierthat thatis isa a combination of weak classifiers [17]. In a TV environment, the in-plane rotation of a viewer’s face combination of weak classifiers [17]. In a TV environment, the in-plane rotation of a viewer’s face frequently occurs because he or she can watch the TV from a lying position, which degrades thethe frequently occurs because he or she can watch the TV from a lying position, which degrades accuracy of of face detection. Therefore, wewe detected faces using Adaboost with thethe original image and accuracy face detection. Therefore, detected faces using Adaboost with original image and ˝ , ´30˝ , ´15˝ , 15˝ , 30˝ and 45˝ ). Because Adaboost detection is sixsix (in-plane rotated) images (at ´45 (in-plane rotated) images (at −45°, −30°, −15°, 15°, 30° and 45°). Because Adaboost detection is performed onon thethe original image and sixsix (in-plane rotated) images, multiple face boxes areare detected performed original image and (in-plane rotated) images, multiple face boxes detected even forfor areas that contain a single face, as as shown in in Figure 2b.2b. even areas that contain a single face, shown Figure
(a)
(b) Figure Cont. Figure 2. 2. Cont.
Symmetry 2016, 8, 75 Symmetry 2016, 8, 75 Symmetry 2016, 8, 75
5 of 28 5 of 28 5 of 28
(c) (c) Figure 2. Detection of the face regions. (a) Detected face ROIs; (b) Multiple detected face boxes; (c) Detectionofofthe theface faceregions. regions.(a)(a) Detected face ROIs; Multiple detected boxes; Figure 2. Detection Detected face ROIs; (b)(b) Multiple detected faceface boxes; (c) Results of the face detection using GLDH. (c) Results of the detection using GLDH. Results of the faceface detection using GLDH.
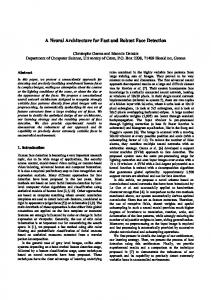
From the multiple multiple detected face face boxes, as as shown in in Figure 2b, 2b, we select select candidates for for correct From From the the multiple detected detected face boxes, boxes, as shown shown in Figure Figure 2b, we we select candidates candidates for correct correct face boxes boxes using using GLDH, GLDH, as as shown shown in in Figure Figure 2c. 2c. We We use use the the GLDH GLDH method method to to select select the the correct correct box box face face boxes using GLDH, as shown in Figure 2c. We use the GLDH method to select the correct box because it uses the characteristics of face symmetry to find a vertical axis that optimally bisects the because it uses uses the thecharacteristics characteristicsofofface facesymmetry symmetry find a vertical optimally bisects the because it to to find a vertical axisaxis thatthat optimally bisects the face face region [32]. The GLDH is calculated by the pixel difference between the symmetrical positions face region The GLDH is calculated the pixel difference between the symmetrical positions region [32]. [32]. The GLDH is calculated by thebypixel difference between the symmetrical positions based based on on the the vertical vertical axis axis that that evenly evenly bisects bisects the the face face box. box. Therefore, Therefore, in in general, general, the the more more symmetrical symmetrical based on the vertical axis that evenly bisects the face box. Therefore, in general, the more symmetrical the left the left and and right right halves halves of of the the candidate candidate face face box box are, are, the sharper sharper the the GLDH GLDH is. is. The The GLDHs GLDHs are are the andleft right halves of the candidate face box are, the sharperthe the GLDH is. The GLDHs are shown at the shown at the bottom of Figure 3. The horizontal and vertical axes of the graphs respectively represent shown bottom of Figure 3. The horizontal andof vertical axes of the graphsrepresent respectively represent bottomat ofthe Figure 3. The horizontal and vertical axes the graphs respectively the gray-level the gray-level gray-level difference difference (GLD) (GLD) and and number number of of occurrences occurrences [36]. [36]. the difference (GLD) and number of occurrences [36].
Figure 3. Y scores calculated using GLDH. Y scores scores calculated using GLDH. Figure 3. Y
It is often often the case case that the the face is is originally rotated rotated horizontally (yaw). (yaw). Therefore, if if we vertically vertically It It is is often the the case that that the face face isoriginally originally rotated horizontally horizontally (yaw). Therefore, Therefore, if we we vertically bisect the the detected detected face face box box into two two equal areas, areas, the left left and right right areas areas are are not not inevitably inevitably bisect bisect the detected face box intointo two equalequal areas, the left the and rightand areas are not inevitably symmetrical. symmetrical. Therefore, if the horizontal position of the vertical axis that evenly bisects the face box box symmetrical. Therefore, if the horizontal position of the vertical axis that evenly bisects the face is defined defined as as m, m, our our system system calculates calculates the the GLDHs GLDHs at at five five (horizontal) (horizontal) positions positions (m (m −− 10, 10, m m −− 5, 5, m, m, m m ++ is
Symmetry 2016, 8, 75
6 of 28
Therefore, if the horizontal position of the vertical axis that evenly bisects the face box is defined as m, our system calculates the GLDHs at five (horizontal) positions (m ´ 10, m ´ 5, m, m + 5, and m + 10). If one of the five positions is the optimal vertical axis, the GLDH distribution at this position becomes a sharp shape with little variation. In an environment where a user is watching TV, severe rotation (yaw) of the user’s head does not occur because he or she is looking at the TV. Therefore, the calculation of GLDH at these five positions can cope with all cases of head rotation (yaw). To measure the sharpness of the GLDH distribution, the Y score is calculated as follows [32,37]: Y score “
MEAN σ2
(1)
where MEAN is the number of pixel pairs whose GLD falls within a specified range (which we set at ˘5) based on the mean of the GLDH distribution. A high MEAN represents a sharp GLDH distribution, which indicates that the corresponding bisected left and right face boxes are symmetrical. In addition, σ is the standard deviation of the distribution. Therefore, the higher the Y score, the more symmetrical the left and right halves of the face box are with respect to the vertical axis (the sharper the GLDH is). The number of the face candidates is reduced using the Y score, as shown in Figure 2c. However, more than two face boxes still exist, even for a single face area, as shown in Figure 2c. Therefore, if multiple face candidates are used for face recognition, the processing time and face recognition error (false matches) will inevitably increase. In order to solve this problem, we propose a fuzzy-based method to select one correct face candidate. Details are given in Sections 2.3 and 2.4. 2.3. Obtaining Four Features Based on Symmetrical Characteristics of a Face for the Fuzzy System In previous research [38,39], the characteristics of frontal face symmetry were used for face recognition. We also use four facial symmetry features as inputs for the fuzzy system. The four features (F1 , F2 , F3 , and F4 ) are shown below. F1 “ 1 ´ Y score (2) F2 “
{2´1 Hÿ ´1 Wÿ y “0
F3 “ |
x “0
{2´1 Hÿ ´1 Wÿ y “0
x “0
|I px, yq ´ I pW ´ x ´ 1, yq| WˆH
(3)
I px, yq ´ I pW ´ x ´ 1, yq | WˆH
(4)
F4 “ Chi ´ square distance between HistoL and HistoR
(5)
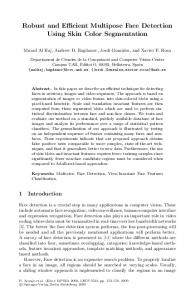
In Equation (2), F1 is calculated from the Y score of Equation (1) after normalizing it to the range of 0–1. In Equations (3)–(5), I(x, y) is the pixel value at position (x, y), and W and H are the width and height of the detected face box, respectively. Equations (3)–(5) represent the differences between the left and right halves of the candidate face box based on the vertical axis that evenly bisects the face box. Equations (3) and (4) show the exemplary case where the vertical axis is positioned at the half of W. In Equation (5), HistoL and HistoR respectively represent the histograms of the left-half and right-half regions of a face box. Features F2 –F4 are normalized to the range of 0–1. As explained before, the higher the Y score, the more symmetrical the left and right halves of the face box are with respect to the vertical axis. In addition, F2 –F4 show the dissimilarity between the left and right halves of the face box. Therefore, the more symmetrical the left and right halves of the face box are with respect to the vertical axis, the smaller F1 , F2 , F3 , and F4 become. To prove this, we show the F1 –F4 values according to the in-plane rotation of a face as shown in Figure 4. As shown in Figure 4, the greater the amount of in-plane rotation of a face region is, the larger the F1 –F4 values. That is, the more symmetrical the left and right halves of the face box are with respect to the vertical axis (the smaller the amount of in-plane rotation of a face region is), the smaller F1 , F2 , F3 , and F4 become. From that, we can confirm that the F1 –F4
Symmetry 2016, 8, 75
7 of 28
Symmetry 2016, 8, 75
7 of 28
halves of the face box are with respect to the vertical axis (the smaller the amount of in-plane rotation of a face region is), the smaller F1, F2, F3, and F4 become. From that, we can confirm that the F1–F4 values can be as inputs forfor the to select selectone onecorrect correct (upright) candidate among values canused be used as inputs thefuzzy fuzzysystem system to (upright) faceface candidate among multiple candidates. multiple candidates.
(a)
(1) F1 (0.000000), F2 (0.222220), F3 (0.182540), F4 (0.104530) (2) F1 (0.177360), F2 (0.416670), F3 (0.306860), F4 (0.128390) (3) F1 (0.335210), F2 (0.500000), F3 (0.362190), F4 (0.188500) (b)
(c)
(1) F1 (0.103590), F2 (0.444440), F3 (0.215660), F4 (0.107960) (2) F1 (0.000000), F2 (0.305560), F3 (0.182240), F4 (0.090740) (3) F1 (0.532750), F2 (0.555560), F3 (0.382320), F4 (0.125640) (d) Figure 4. F1–F4 values according to in-plane rotation of a face. (a,c) Examples of detected face regions
Figure 4. F1 –F4 values according to in-plane rotation of a face. (a,c) Examples of detected face regions including in-plane rotation; (b) F1–F4 values of (1)–(3) face regions of (a); (d) F1–F4 values of (1)–(3) including in-plane rotation; (b) F1 –F4 values of (1)–(3) face regions of (a); (d) F1 –F4 values of (1)–(3) face regions of (c). face regions of (c).
2.4. Determining a Single Correct Face Region Using a Fuzzy System
2.4. Determining a Single Correct Face Region Using a Fuzzy System 2.4.1. Definition of Fuzzy Membership Functions and Fuzzy Rule Tables
2.4.1. Definition of Fuzzy Membership Functions and Fuzzy Rule Tables
The four features F1, F2, F3, and F4 are used as inputs for the fuzzy system, and a single correct face box its output.F1To this,Fwe define the andfor output membership functions as shown The fourisfeatures , Fachieve used asinput inputs the fuzzy system, and a single correct 2 , F3 , and 4 are
face box is its output. To achieve this, we define the input and output membership functions as shown in Figure 5a,b. Two linear functions respectively representing low (L) and high (H) are used as the input membership function. Three linear functions respectively representing low (L), medium (M), and high (H) are used as the output membership function. We acquire fuzzy output values using the input and output membership functions and the defuzzification method [40–44].
Symmetry 2016, 8, 75
8 of 28
in Figure 5a,b. Two linear functions respectively representing low (L) and high (H) are used as the input membership function. Three linear functions respectively representing low (L), medium (M), and2016, high8,(H) Symmetry 75 are used as the output membership function. We acquire fuzzy output values using the8 of 28 input and output membership functions and the defuzzification method [40–44].
(a)
(b) Figure 5. Input (a) and output (b) fuzzy membership functions.
Figure 5. Input (a) and output (b) fuzzy membership functions.
As explained in Section 2.3, the more symmetrical the left and right halves of the face box are
As 2.3, the more symmetrical left and rightonhalves of we thedesigned face box are withexplained respect to in theSection vertical axis, the smaller F1, F2, F3, and the F4 become. Based this fact, the fuzzy rule table shown in Table 1. The fuzzy output values of L and H respectively represent with respect to the vertical axis, the smaller F1 , F2 , F3 , and F4 become. Based on this fact, we designed smaller andtable largershown amounts symmetry the leftoutput and right halves with respect to the fuzzy rule in of Table 1. Theoffuzzy values ofofL the andface H box respectively represent the vertical axis. smaller and larger amounts of symmetry of the left and right halves of the face box with respect to the vertical axis. Table 1. Fuzzy rule table for obtaining the fuzzy system output.
Table 1. Fuzzy rule table for obtaining fuzzy system Input 2 (F 2 of Input 3 the (F3 of Input 4 (F4output. of Fuzzy output
Input 1 (F1 of Equation (2))
Input 1 (F 1 of Equation (2))
Input 2 (F 2 of Equation (3))
Equation (3))
Input 3 (F 3 of Equation (4)) L
L
L L
Equation (4))
H
H L L H H
Equation (5)) Value L H L Input 4 (F 4 of Fuzzy Output Value H H Equation (5)) L H H L H MH L HH H L H M
L
H
H
M
L
H
H
M
L
M
H
L
Symmetry 2016, 8, 75
9 of 28
Table 1. Cont. Input 1 (F 1 of Equation (2))
Input 2 (F 2 of Equation (3))
Input 3 (F 3 of Equation (4)) L
Symmetry 2016, 8, 75
L H H L
L
H L H
H
H
Input 4 (F 4 of Equation (5))
Fuzzy Output Value
L
H
H
M
L
M L
H H L H L
H
L
H
H
H
L H L H L H L H
M L H M M L M L L L
9 of 28
L M L L L
2.4.2. Determining a Single Correct Face Region by Defuzzification 2.4.2. Determining a Single Correct Face Region by Defuzzification
In this section, we explain the method for determining a single correct face region based on the In this section, we explain the method for determining a single correct face region based on the output value of value the fuzzy system. With one featurefrom from –FEquations (2)–(5), 4 of Equations output of the fuzzy system. With oneinput input feature F1–FF41of (2)–(5), we can we can two outputs usinginput two input membershipfunctions, functions, asas shown in Figure 6. obtain twoobtain outputs using two membership shown in Figure 6.
6. Obtaining two output output values from from a singleainput feature (Fi) using two input Figure 6. Figure Obtaining two values single input feature (Fi )membership using two input functions. membership functions.
For example, if we assume that F1 (of (1) face box of Figure 5a) is 0.9, 0.1 (L) and 0.9 (H) can be obtained from the L and H membership functions, respectively, as shown in Figure 6. Similarly, if F2, For example, if we assume that F1 (of (1) face box of Figure 5a) is 0.9, 0.1 (L) and 0.9 (H) can be F3, and F4 (of (1) face box of Figure 5a) are assumed to be 0.9, three pairs of 0.1 (L) and 0.9 (H) can be obtained from the Consequently, L and H membership respectively, as shown Figure 6. Similarly, if F2 , obtained. the four pairsfunctions, of 0.1 (L) and 0.9 (H) are obtained from Fin 1, F2, F3, and F4 using F3 , and F4two (of input (1) face box of Figure 5a) are on assumed topairs be 0.9, three pairs andthe 0.9 (H) can membership functions. Based these four of 0.1 (L) and 0.9 of (H),0.1 we(L) obtain combined set as {(0.1 (L), 0.1 (L), 0.1 (L), 0.1 (L)), (0.1 (L), 0.1 (L), 0.1 (L), 0.9 (H)), (0.1 (L), 0.1 (L), 0.9 be obtained. Consequently, the four pairs of 0.1 (L) and 0.9 (H) are obtained from F1 , F2 , F3 , and F4 0.1 (L)), ..., (0.9 (H), 0.9 (H), 0.9 (H), 0.1 (L) , (0.9 (H), 0.9 (H), 0.9 (H), 0.9 (H))}. With one subset, using two(H), input membership functions. Based on these four pairs of 0.1 (L) and 0.9 (H), we obtain we can determine a single value (0.1 or 0.9) and a single symbol (L or H) based on the MIN or MAX the combined set as {(0.1 (L), (L), (L)), methods [45,46] and(L), the 0.1 fuzzy rule0.1 table of 0.1 Table 1. (0.1 (L), 0.1 (L), 0.1 (L), 0.9 (H)), (0.1 (L), 0.1 (L), 0.9 (H), 0.1 (L)), (0.9 (H), (0.9 method (H), 0.9with (H),one 0.9subset (H), (0.1 0.9 (H))}. For...,example, we0.9 can(H), select0.9 0.9(H), based0.1 on(L) the ,MAX (L), 0.9 With (H), 0.1one subset, (L), 0.1 (L)). In addition, inputand of (L), (H), (L), and (L),(Lwe (H) from Table 1. or MAX we can determine a single valuefrom (0.1the or 0.9) a single symbol orobtain H) based on the MIN Consequently, we obtain 0.9 (H), which we call the inference value (IV) in this paper. Because the methods [45,46] and the fuzzy rule table of Table 1. number of components in the combined set of {(0.1 (L), 0.1 (L), 0.1 (L), 0.1 (L)), (0.1 (L), 0.1 (L), 0.1 (L), For example, select 0.90.1based one (L), 0.9 (H), 0.9 (H)), (0.1we (L),can 0.1 (L), 0.9 (H), (L)), ...,on (0.9the (H), MAX 0.9 (H), method 0.9 (H), 0.1with (L) , (0.9 (H),subset 0.9 (H),(0.1 0.9 (H), 0.1 (L), 0.10.9(L)). addition, (H))} In is 16, we obtain from 16 IVs. the input of (L), (H), (L), and (L), we obtain (H) from Table 1. fivecall defuzzification methods, the first maxima (FOM), last Consequently,We wecompared obtain the 0.9performances (H), whichofwe the inference value (IV)ofin this paper. Because the of maxima (LOM), middle of maxima (MOM), mean of maxima (MeOM), and center of gravity (COG) number of components in the combined set of {(0.1 (L), 0.1 (L), 0.1 (L), 0.1 (L)), (0.1 (L), 0.1 (L), 0.1 (L),
Symmetry 2016, 8, 75
10 of 28
0.9 (H)), (0.1 (L), 0.1 (L), 0.9 (H), 0.1 (L)), ..., (0.9 (H), 0.9 (H), 0.9 (H), 0.1 (L) , (0.9 (H), 0.9 (H), 0.9 (H), 0.9 (H))} is 16, we obtain 16 IVs. We compared the performances of five defuzzification methods, the first of maxima (FOM), last of maxima (LOM), middle of maxima (MOM), mean of maxima (MeOM), and center of gravity (COG) [40–44]. FOM, LOM, MOM, and MeOM select one output value from the outputs determined by the maximum IV8,(0.9 ofofFigure 7a), Symmetry 2016, 75 (M) of Figure 7a). That is, FOM selects the first output value (S2 10 28 and LOM selects the last output value (S3 of Figure 7a). MOM selects the middle output ((S2 + S3 )/2). [40–44]. FOM, LOM, MOM, and MeOM select one output value from the outputs determined by the MeOM selects the mean of all the outputs. In Figure 7a, MeOM also selects the (S2 + S3 )/2. maximum IV (0.9 (M) of Figure 7a). That is, FOM selects the first output value (S2 of Figure 7a), and Different and MeOM which are based on the maximum IV, COG selects LOM from selectsFOM, the lastLOM, outputMOM, value (S 3 of Figure 7a). MOM selects the middle output ((S2 + S3)/2). the centerMeOM for the output based on the weighted average (S5 of also Figure 7c)the of (S all regions defined by selects the mean of all the outputs. In Figure 7a, MeOM selects 2 +the S3)/2. Different from FOM, LOM, MOM, and MeOM which are based on the maximum IV, COGfor selects all the IVs (the combined area of three regions R1 , R2 , and R3 of Figure 7b). The method calculating the center for the output based on the weighted average (S 5 of Figure 7c) of all the regions defined by the weighted average by COG [42–44] is as follows: all the IVs (the combined area of three regions R1, R2, and R3 of Figure 7b). The method for calculating r the weighted average by COG [42–44] is as follows: r
V FpSq ˆ S dS (6) r~ r) SdS V FV ( SFpSq dS S5 (6) ~ V F ( S ) dS Here, V and S respectively represent the variables for the vertical and horizontal axes of Figure 7b,c Here, V andarea S respectively represent the theofvertical and Fr is the combined of three regions, R1,variables R2, andfor R3, Figureand 7b.horizontal axes of Figure ~ is the combined area of three regions, R1, R2, and R3, of Figure 7b. 7b,c and F Finally, we select one correct face box whose calculated output value by the defuzzification we select one correct face box whose calculated output value by the defuzzification method is theFinally, largest. For example, if the output values of (1), (2), and (3) face boxes of Figure 5a are method is the largest. For example, if the output values of (1), (2), and (3) face boxes of Figure 5a are respectively 0.51, 0.38, and 0.79, the (3) face box is finally selected as the correct one which is used for respectively 0.51, 0.38, and 0.79, the (3) face box is finally selected as the correct one which is used for face recognition. face recognition. S5 “
(a)
(b) Figure 7. Cont.
Figure 7. Cont.
Symmetry 2016, 8, 75
11 of 28
Symmetry 2016, 8, 75
11 of 28
Symmetry 2016, 8, 75
11 of 28
(c)
(c) Figure 7. Obtaining the final fuzzy output value by various defuzzification methods: (a) by the first Figure 7.ofObtaining the final fuzzy output value by various(MOM), defuzzification methods: (a) by the first maxima (FOM), last offuzzy maxima (LOM),value middleby of maxima and mean ofmethods: maxima (MeOM); Figure 7. Obtaining the final output various defuzzification (a) by the first of maxima (FOM), last of maxima (LOM), middle of maxima (MOM), and mean of maxima (MeOM); (b)(FOM), by the combined area of three regionsmiddle of R1, R2of , and R3; and (MOM), (c) by center of gravity (COG). of maxima last of maxima (LOM), maxima and mean of maxima (MeOM); (b) by the combined area of three regions of R1 , R2 , and R3 ; and (c) by center of gravity (COG). (b) by theFigure combined area of three regions of R1, R2, and R3; and (c) by center of gravity (COG). 8 shows an example of the face boxes selected by the previous [32] and proposed methods. As shown in this figure, a more correct face box (where the left and right halves of the face box are
Figure 88 shows an of face boxes selected the previous previous [32] and proposed proposed Figure shows an example example of the the face selected by the [32] faces and methods. more symmetrical) can be obtained usingboxes our method. Ourby system then recognizes using MLBPmethods. As shown in this figure, a more correct face box (where the left and right halves of the face on the selected face box [32]. A more detailed explanation of the face recognition method can be found As shown in this figure, a more correct face box (where the left and right halves of the face box box are are in [32]. more symmetrical) can be obtained using our method. Our system then recognizes faces using more symmetrical) can be obtained using our method. Our system then recognizes faces using MLBP MLBP on selected face [32]. A A more more detailed detailed explanation explanation of of the the face face recognition recognition method method can found on the the selected face box box [32]. can be be found in [32]. in [32].
(a)
(a)
(b) Figure 8. Examples of the final selected face boxes by (a) the previous method and (b) our method.
(b) Figure boxes by by (a) (a) the the previous previous method method and and (b) (b) our our method. method. Figure 8. 8. Examples Examples of of the the final final selected selected face face boxes
Symmetry 2016, 8, 75
12 of 28
Symmetry 2016, 8, 75
12 of 28
2.5. Face Face Recognition Recognition Using Using MLBP MLBP 2.5. The detected detected face face regions regions are are used used for for MLBP MLBP face face recognition. recognition. MLBP MLBP is is based based on on the the local local binary binary The pattern (LBP) method, which assigns a binary code to each pixel based on a comparison between the pattern (LBP) method, which assigns a binary code to each pixel based on a comparison between the center and LBP (concatenation of center and its its neighboring neighboringpixels pixels[47]. [47].MLBP MLBPisispresented presentedasasa ahistogram-based histogram-based LBP (concatenation many histograms), and the LBP is a particular case of MLBP. If the center value is equal to (or greater of many histograms), and the LBP is a particular case of MLBP. If the center value is equal to (or than) the neighboring pixel, 1pixel, is assigned; if it is less than neighboring pixel,pixel, 0 is assigned. This greater than) the neighboring 1 is assigned; if it is lessthe than the neighboring 0 is assigned. basic basic LBP isLBP extended to a multi-resolution method that considers numbers neighboring This is extended to a multi-resolution method that various considers variousP of numbers P of pixels and distances R between the center and neighboring pixels as follows [32]: neighboring pixels and distances R between the center and neighboring pixels as follows [32]: LBP “ LBPP,R P,R
#
Pÿ P´ 11
1,x1,ěx0 0
spxq s“( x) ( gp ´ggc q2)2, where , where sspg 0, x0,ăx0 0 p “0 p 0
p p
p
c
(7) (7)
where gcc is the gray value of the center center pixel, pixel, ggpp (p == 1, .…, . . ,P–1) P–1)are arethe thegray gray values values of of the the pp that that has equally spaced pixels pixels on onaacircle circleofofradius radiusR,R,and andspxq is the threshold function x. The obtained s(xis) the threshold function for x.for The obtained LBP codescodes are classified into uniform and non-uniform patterns. patterns. Uniform patterns theinclude numberthe of LBP are classified into uniform and non-uniform Uniforminclude patterns transitions between 0 and 1 and0are 0, 11,and or 2.are Other are non-uniform patterns. Thepatterns. uniform number of transitions between and 0, 1,patterns or 2. Other patterns are non-uniform patterns usually represent edges, corners,edges, and spots, whereas the non-uniform do notpatterns contain The uniform patterns usually represent corners, and spots, whereas thepatterns non-uniform sufficient texture information. Theinformation. histograms The of uniform and non-uniform patterns are obtained and do not contain sufficient texture histograms of uniform and non-uniform patterns extracted from various sub-block levels, as shown in Figure [32]. in Figure 9 [32]. are obtained and extracted from various sub-block levels, as9shown
(a)
(b)
(c)
(d)
Figure multi-level local binary pattern (MLBP) at Figure 9. 9. Example Exampleofofhistogram histogramfeature featureextraction extractionusing using multi-level local binary pattern (MLBP) three levels. (a) Face image divided into various sub-blocks; (b) Examples of sub-block regions; (c) at three levels. (a) Face image divided into various sub-blocks; (b) Examples of sub-block regions; Histograms for for (b) (b) obtained using local (c) Histograms obtained using localbinary binarypattern pattern(LBP); (LBP);(d) (d)Final Final facial facial feature feature histogram histogram obtained obtained by by concatenating concatenating the the histograms histograms of of (c). (c).
In order to extract the histogram features globally and locally, sub-blocks of the faces are defined In order to extract the histogram features globally and locally, sub-blocks of the faces are defined at three levels (the upper (6 × 6), middle (7 × 7), and lower (8 × 8) face of Figure 9). Because the largerat three levels (the upper (6 ˆ 6), middle (7 ˆ 7), and lower (8 ˆ 8) face of Figure 9). Because the sized sub-blocks are used in the first level (upper face), the global (rough texture) features can be larger-sized sub-blocks are used in the first level (upper face), the global (rough texture) features can obtained from this sub-block. That is because the histogram information is extracted from the larger be obtained from this sub-block. That is because the histogram information is extracted from the larger area of a face. On the other hand, because the smaller-sized sub-blocks are used in the third level (lower face), the local (fine texture) features can be obtained from this sub-block. That is because the histogram information is extracted from the smaller area of a face.
Symmetry 2016, 8, 75
13 of 28
area of a face. On the other hand, because the smaller-sized sub-blocks are used in the third level (lower face), the local (fine texture) features can be obtained from this sub-block. That is because the histogram information is extracted from the smaller area of a face. As shown in Figure 9d, all of the histograms for each sub-block are concatenated in order to form the final feature vector for face recognition. The dissimilarity between the registered and input face histogram features is measured by the chi-square distance χ2 pE, Iq “
ÿ pEi ´ Ii q2 i
Ei ` Ii
(8)
where Ei is the histogram of the registered face, and Ii is the histogram of the input face. By using the histogram-based distance, a small amount of misalignment between two face images from the same person can be compensated for. In order to deal with faces in various poses (horizontal (yaw) and vertical (pitch) rotation), the histogram feature of the input face is compared with the five registered ones (which were obtained when each user looked at five positions (left-upper, right-upper, center, left-lower, and right-lower positions) on the TV during the initial registration stage) using Equation (8). If the distance calculated by Equation (8) is less than a predetermined threshold, the input face is determined to be a registered person. 3. Experimental Results and Discussions 3.1. Descriptions of Our Databases Our algorithm is executed in the environment of a server-client-based intelligent TV. We aim to adopt our algorithm into an intelligent TV that can be used in underdeveloped countries where people cannot afford to buy smart TVs with high performance and cost. Therefore, most functionalities of the intelligent TV are provided by a low-cost STB. Additional functionalities requiring a high processing time are provided by a high-performance server, which is connected to the STB by a network. In this environment, our algorithm is executed on a STB (microprocessor without interlocked pipeline stages (MIPS)-based dual core 1.5 GHz, 1 GB double data rate 3 (DDR3) memory, 256/512 MB negative-and (NAND) memory) and server (3.5 GHz CPU and 8 GB of RAM). The STP is attached to a 60 in TV. Steps (1) and (2) of Figure 1 are performed on the STP, and steps (3) to (7) are performed on the server. There are many face databases, e.g., FEI [48], PAL [49], AR [50], JAFFE [51], YouTube Faces [52], the Honda/UCSD video database [53], and the IIT-NRC facial video database [54]. However, most of them were not collected when a user was watching TV, and face images with in-plane rotation are not included. Therefore, we constructed our own database, which consists of images of users watching TV in natural poses, including face images with in-plane rotation. The database was collected using 15 people by separating them into five groups of three people for the experiments [32]. In order to capture images of users looking at the TV screen naturally, each participant was instructed to watch TV without any restrictions. As a result, we captured a total of 1350 frames (database I) (15 persons ˆ two quantities of participants (one person or three persons) ˆ three seating positions (left, middle, and right) ˆ three Z distances (1.5, 2, and 2.5 m) ˆ five trials (looking naturally)). In addition, a total of 300 images (database II) (five persons ˆ three Z distances (1.5 m, 2 m, and 2.5 m) ˆ two lying directions (left and right) ˆ 10 images) were collected for experiments when each person is lying on his or her side [32]. For face registration for recognition, a total of 75 frames (15 people ˆ five TV gaze points) were obtained at the Z distance of 2 m. Consequently, a total 1725 images were used for the experiments. We make our all databases (used in our research) [55] available for others to use in their own evaluations. Figure 10 shows examples of the experimental images. For registration, five images were acquired, as shown in Figure 10a, when each user looked at five positions on the TV. Figure 10b shows examples of the images for recognition, which were obtained at various Z-distances, seating positions, and lying directions. Figure 10c shows examples of database II.
Symmetry 2016, 8, 75
14 of 28
Symmetry 2016, 8, 75
14 of 28
(a)
(b) Figure 10. Cont. Figure 10. Cont.
Symmetry 2016, 8, 75
15 of 28
Symmetry 2016, 8, 75
15 of 28
(c) Figure 10. 10.Examples Examples of experimental images. (a) Images face registration; for Figure of experimental images. (a) Images for facefor registration; (b) Images(b) for Images recognition recognition test (database I); (c) Images for recognition test (database II). test (database I); (c) Images for recognition test (database II).
3.2. Experimental Results of the Face Detection and Recognition with Our Databases I and II 3.2. Experimental Results of the Face Detection and Recognition with Our Databases I and II For the first experiment, we measured the accuracy of the face detection using database I. For the first experiment, we measured the accuracy of the face detection using database I. Accuracies were measured based on recall and precision, respectively, calculated as follows [32]: Accuracies were measured based on recall and precision, respectively, calculated as follows [32]:
# TP
Re call #TP Recall “ m m Pr ecision
(9) (9)
# TP
#TP Precision “ # TP # FP #TP ` #FP
(10) (10)
where m m is the total number number of faces in the images; #FP and #TP are the number of false positives and where true positives, respectively. respectively. False positives are cases where non-faces are incorrectly detected as as faces. faces. True positives positives are are faces faces that that are are detected detected correctly. correctly. If If the the recall recall value value is is close close to 1, the accuracy of the True detection is regarded regarded as as high. high. If the precision value is 1, all of the detected face regions are correct face detection with an #FP of 0. As explained before, we measured the accuracies of the face detection according to the participant groups as shown in Table 2. In Table 2, recall and precision in the case of equal error rate (EER) are shown in bold type. EER means the error rate when the difference between the recall precisionisisminimized minimizedininthe thetrade-off trade-off relations between recall precision. reason and precision relations between recall andand precision. TheThe reason whywhy the the recall atEER the point EER point for Group was than lower thanfor those for the otherisgroups thatdetection the face recall at the for Group 2 was 2lower those the other groups that theisface detection was not successful for the female whooccluding had hair part occluding part face and small face. was not successful for the female who had hair her face andher a small face.a The reason The reason why the at thefor EER point for Groups 2 andthan 3 is lower thosegroups for other groups why the precision atprecision the EER point Groups 2 and 3 is lower those than for other is that the is that of thethe colors of the subjects’ similar to facial those skin, of thewhich facialcaused skin, which caused false colors subjects’ clothes wereclothes similarwere to those of the false positives. positives. In Table 3, we measured the face detection accuracies according to the Z distances of the subjects in order to evaluate the effect of the change of image size (resolution). In Table 3, recall and precision 2. equal Experimental results of are theshown face detection according to participant groups (who haveat a Z in theTable case of error rate (EER) in bold type as well. The recall at the EER point different gaze directions). distance of 2.5 m is lower than for other cases because the face sizes are small, which caused the face detection to fail. Group Recall (%) Precision (%) 1
94.94 96.85 97.35 98.44 99.87
99.91 98.87 97.13 96.03 94.83
Symmetry 2016, 8, 75
16 of 28
Table 2. Experimental results of the face detection according to participant groups (who have different gaze directions). Group
Recall (%)
Precision (%)
1
94.94 96.85 97.35 98.44 99.87
99.91 98.87 97.13 96.03 94.83
2
80.38 84.23 89.44 94.67 99.45
99.28 95.87 91.15 87.06 82.11
3
90.38 94.27 97.78 98.38 99.89
99.38 95.58 93.92 91.76 90.89
4
93.09 94.18 95.74 97.43 99.91
99.94 99.04 98.86 96.24 94.03
5
96.87 97.05 98.7 99.01 99.87
99.95 99.87 99.26 98.07 97.16
Average
91.132 93.316 95.802 97.586 99.798
99.692 97.846 96.064 93.832 91.804
Table 3. Experimental results of the face detection according to Z distance. Z Distance (m)
Recall (%)
Precision (%)
1.5
96.54 97.42 98.06 99.13 99.53
99.99 99.02 98.34 97.24 96.92
2
91.08 93.12 95.78 97.59 99.93
99.97 97.67 96.59 93.33 91.87
2.5
86.98 90.98 93.34 96.26 99.42
99.58 96.71 93.72 90.17 86.32
Average
91.53 93.84 95.73 97.66 99.63
99.85 97.8 96.22 93.58 91.70
Symmetry 2016, 8, 75
17 of 28
The rows in each group (or Z distance) in Tables 2 and 3 show the changes of recall according to the decreases of precision. Because the recall and precision usually have a trade-off relationship (with a larger recall, a smaller precision is obtained, and vice versa), the changes of recall according to the decrease of precision are presented in our paper in order to show the accuracies of our face detection method more clearly through the various combinations of recall and precision. In Tables 4 and 5, we respectively measured the accuracies of the face detection according to the seating positions and the number of participants in each image. As shown in Tables 4 and 5, the face detection accuracy is similar, irrespective of the seating position and number of people in each image. Table 4. Experimental results of the face detection according to seating position. Seating Position
Recall (%)
Precision (%)
Left Middle Right
97.11 94.22 95.78
95.36 96.94 96.15
Table 5. Experimental results of the face detection according to the number of people in each image. Number of People
Recall (%)
Precision (%)
1 3
95.79 95.70
96.17 96.13
For the second experiment, we measured the accuracy of the face recognition with database I for various defuzzification methods. As explained in Section 2.5, the MLBP histogram of the incoming face is compared (using the chi-squared distance) to the five images of three individuals used to train it and the nearest is chosen as the identity, provided the calculated matching distance is less than the threshold. That is, it is a nearest neighbor classifier and only three identities are included in the tests. We measured the accuracy of the face recognition using the genuine acceptance rate (GAR). As shown in Table 6, the GAR by MOM with the MAX rule is higher than the GARs for other defuzzification methods. Using the MOM with the MAX rule, we compared the GAR of the proposed method to that of the previous one, as shown in Table 7, where it is clear that the GAR of our method is higher than that of the previous method for all cases. Table 6. Experimental results (genuine acceptance rate (GAR)) of the face recognition using the proposed method and various defuzzification methods (%). Method
GAR (%)
MIN rule
FOM MOM LOM MEOM COG
83.34 90.65 90.86 90.78 90.73
MAX rule
FOM MOM LOM MEOM COG
92.10 92.93 91.70 91.78 91.92
Symmetry 2016, 8, 75
18 of 28
Table 7. Comparison of GARs of our method and the previous method according to participant group.
Group
GAR (%) Previous Method [32]
Proposed Method
90.76 93.2 82.89 96.98 87.33 90.23
92.02 94.09 90.53 98.08 89.93 92.93
1 2 3 4 5 Average
In Tables 8–10, we compared the face recognition accuracy (GAR) of our method to that of the previous method with respect to the Z distance, sitting position, and number of people in each image, respectively. The GAR for various Z distances was measured in order to evaluate the effect of the change of the image size (resolution). The reason why the GAR at a Z distance of 2 m is higher than those at other Z distances is that the registration for face recognition was done with the face images captured at a Z distance of 2 m. The reason why the GAR at a Z distance of 2.5 m is lower than for other cases is that the face sizes in the images are smaller. As shown in Tables 8–10, we confirm that the GARs of our method are higher than those of the previous method in all cases, and the GARs of our method are not affected by the Z distance, sitting position, or the number of people in each image. Table 8. Comparison of GARs for our method and the previous method for various Z distances. GAR (%) Z Distance (m) 1.5 2 2.5
Previous Method [32]
Proposed Method
89.11 92.97 88.61
92.22 96.35 90.49
Table 9. Comparison of GARs for our method and the previous method for various seating positions.
Seating Position Left Middle Right
GAR (%) Previous Method [32]
Proposed Method
91.46 93.55 85.64
94.53 94.53 89.42
Table 10. Comparison GARs for our method and the previous method for various number of people in each image.
Number of People 1 3
GAR (%) Previous Method [32]
Proposed Method
90.12 90.57
92.19 93.67
For the next experiments, we compared the GARs of various face recognition methods [47,56–60] with our face detection method. In previous research [47], Ahonen et al. proposed LBP-based feature extraction for face recognition. PCA has been widely used to represent facial features based on eigenfaces [56,57]. Li et al. proposed a local non-negative matrix factorization (LNMF)-based method for the part-based representation of facial features [58]. In a previous study [59], they proposed support vector machine-discriminant analysis (SVM-DA)-based feature extraction for face recognition in order
Symmetry 2016, 8, 75
19 of 28
to overcome the limitations of the linear discriminant analysis method that assumes that all classes have Gaussian density functions. Froba et al. proposed the modified census transform (MCT)-based facial feature extraction method which uses the average value of a 3 ˆ 3 pixel mask, in contrast to the LBP method which uses the center value of a 3 ˆ 3 pixel neighborhood [60]. As shown in Table 11, the GAR of our MLBP-based recognition method with our face detection method is higher than those of other methods. By using the MLBP histogram features of three levels, as shown in Figure 9, both local and global features can be efficiently used for face recognition, which improves the accuracy of the face recognition. Table 11. Comparison of GARs of various face recognition methods with our face detection method according to groups in the database.
Group 1 2 3 4 5 Average
GAR (%) LBP [47]
PCA [56,57]
LNMF [58]
SVM-D [59]
MCT [60]
Previous Method [32]
MLBP
63.03 57.02 50.47 68.08 68.4 61.4
61.03 45.99 43.11 67.25 66.45 56.77
50.53 42.1 48.45 61.51 65.46 53.61
72.44 77.59 62.61 79.63 77.76 74.01
61.01 53.79 47.13 68.53 65.11 59.11
90.76 93.2 82.89 96.98 87.33 90.23
92.02 94.09 90.53 98.08 89.93 92.93
As shown in Table 12, the GARs of our MLBP-based recognition method with our face detection method are higher than others irrespective of the change of image resolution which is caused by the change of Z distance. As explained before, because the MLBP-based method can use both local and global features for face recognition, the change of image resolution affects the facial features less using MLBP compared to other methods. In Tables 11 and 12, all the methods were applied to the same data of the face ROI detected by our face detection method for fair comparisons. Table 12. Comparisons of GARs of various face recognition methods with our face detection method for various Z distances. GAR (%) Z Distance (m) 1.5 2 2.5
LBP [47]
PCA [56,57]
LNMF [58]
SVM-DA [59]
MCT [60]
Previous Method [32]
MLBP
63.06 64.96 56.18
53.51 57.16 59.4
52.71 56.02 52.1
76.55 79.29 66.17
58.59 63.78 54.98
89.11 92.97 88.61
92.22 96.35 90.49
Our research is mainly focused on selecting one correct (upright) face image among multiple (in-plane-rotated) face candidates (without the procedure of detecting eye positions or keypoints) based on a fuzzy system, and on enhancing the performance of face recognition by using only the selected face image. That is, the main goal of our research is face detection robust to in-plane rotation (not facial feature extraction or face recognition). In all the methods of Tables 11 and 12, our face detection method is also commonly used. That is, PCA means PCA-based face recognition with our face detection method. In the same manner, LBP means LBP-based face recognition with our face detection method. Therefore, Tables 11 and 12 just show the accuracies of various face recognition methods with our face detection method. PCA, LBP and MCT are not originally designed to be robust to in-plane rotation. Nevertheless, the reason why we selected PCA, LBP and MCT, etc. (instead of state-of-the-art methods such as deep learning-based face recognition, etc.), for comparisons in Tables 11 and 12 is to show that our face detection method can be used with any kind of traditional or even old-fashioned method whose accuracies are lower than the state-of-the-art methods for face recognition. If we use a recognition method showing high accuracies such as the deep learning-based method in Tables 11 and 12, it is difficult to analyze whether the high accuracies of recognition are
Symmetry 2016, 8, 75
20 of 28
caused by our face detection method or the recognition method itself. Therefore, we include only the comparisons with traditional methods in Tables 11 and 12. For the next test, we performed an additional experiment with database II, which includes extremely rotated faces, as shown in Figure 10c. The recall and precision of the face detection are, respectively, 96.67% and 99.39%, which are similar to those of database I in Tables 2–5. As shown in Table 13, the GAR of our method is 95.15%, which is higher than that of the previous method. In addition, the GAR of our method is similar to those of Tables 6–10. This result confirms that our method can be applied to highly rotated face images. Table 13. Face recognition accuracy for images of highly rotated faces (database II). Method
GAR (%)
Previous method [32] Proposed method
93.10 95.15
Figure 11 shows the examples for which our face recognition method is successful. Figure 12 shows the examples where the face recognition failed. The failures (left person of the left figure of Figure 12 and right person of the right figure of Figure 12) are caused by false matching by the MLBP method, although the correct face boxes are selected by our method. Symmetry 2016, 8, 75 20 of 28 Symmetry 2016, 8, 75
20 of 28
Figure 11. Examples of the success of the face recognition. Figure 11. 11. Examples of the success of the faceface recognition. Figure Examples of the success of the recognition.
Figure 12. Examples of the failure of the face recognition. Figure Examples of the failure of the recognition. Figure 12. 12. Examples of the failure of the faceface recognition.
Our method (including fuzzy system–based face detection and MLBP-based face recognition) Our method (including fuzzy system–based face detection and MLBP-based face recognition) Ournot method (including fuzzyprocedure. system–based and MLBP-based face recognition) does require any training Evenface for detection face candidate detection, we used the original does not require any training procedure. Even for face candidate detection, we used the original does not require any training procedure. Even for face candidate detection, we used the Adaboost face detector provided by the OpenCV library (version 2.4.9 [61]) without original additional Adaboost face detector provided by the OpenCV library (version 2.4.9 [61]) without additional Adaboost face detector provided by the OpenCV (version 2.4.9 [61]) without additional training. training. Therefore, all the experimental datalibrary were used for testing. training. Therefore, all the experimental data were used for testing. Therefore, thenext experimental data used for Forallthe experiment, wewere measured thetesting. processing time of our method. Experimental results For the next experiment, we measured the processing time of our method. Experimental results For the next experiment, we measured the processing time of our Experimental results show that the processing time per each image is approximately 152 method. ms. Therefore, our system can be show that the processing time per each image is approximately 152 ms. Therefore, our system can be show that theatprocessing per each image approximately 152 ms. Therefore, our system operated a speed oftime approximately six orisseven frames per second. The processing time can of our operated at a speed of approximately six or seven frames per second. The processing time of our be operated a speedthan of approximately six or method seven frames per[32] second. Theonly processing our is method isatsmaller that of the previous (185 ms) because a singletime faceof region method is smaller than that of the previous method (185 ms) [32] because only a single face region is method is smaller than thatfor of recognition. the previousThe method ms) [32] because only single face is selected per individual target(185 applications for TV of ouramethod are region the systems selected per individual for recognition. The target applications for TV of our method are the systems for automatic audience rating surveys, program recommendation services, personalized advertising, for automatic audience rating surveys, program recommendation services, personalized advertising, and TV child locks. Face detection and recognition do not necessary need to be executed at every and TV child locks. Face detection and recognition do not necessary need to be executed at every frame (real-time speed) in these applications. Therefore, our system at the current processing speed frame (real-time speed) in these applications. Therefore, our system at the current processing speed of approximately six or seven frames per second can be used for these applications. of approximately six or seven frames per second can be used for these applications. Previous research on rotation-invariant face detection exists [62,63]. Their method can detect the Previous research on rotation-invariant face detection exists [62,63]. Their method can detect the
Symmetry 2016, 8, 75
21 of 28
Symmetry 2016, 8, 75
22 of 28
selected per individual for recognition. The target applications for TV of our method are the systems 3.4.automatic Discussionsaudience rating surveys, program recommendation services, personalized advertising, for and TV child detection recognition do not to beof executed at every There haslocks. been Face a great deal ofand previous researches onnecessary keypoint need detection a face image in frame (real-time speed) in these applications. Therefore, our system at the current processing speed of References [33–35]. However, in most previous research including References [33–35], keypoint approximately six or seven frames per second canpixel be used for these applications. detection has been done with face images of high resolution which are captured at close distance Previous research on rotation-invariant face detection exists [62,63]. Their method can detect to the camera. In contrast, the input images captured at a far distance from the camera (maximum 2.5 the correct face region from the face images including various rotations of a face based on m) are used in our research because our study aims at face recognition at far distancesthe in real the Adaboost method [62]. However, the processing time of their method is higharea (about 250 ms(less for environment of watching TV. Consequently, the image pixel resolution ofso a face is so low athan 32040 ˆ 240 image on a Pentium 4 2.4 GHz PC) that their method cannot be used in our system. × 50 pixels), in addition to the blurring of the face image as shown in Figure 13c,d, that the In previous research they show that or their canare also locate to theapply correct region fromused face previous methods of[63], keypoint detection eyemethod detection difficult to face the face images images including various rotations of a face by a neural network. However, the processing time of in our research. their As method is so high (about six seconds process a of 160eye ˆ 120 pixel image onconventional an SGI O2 workstation an experiment, we measured thetoaccuracies detection by the Adaboost (Silicon Graphics Inc., Sunnyvale, CA, USA) with a 174 MHz R10000 processor (Silicon Graphics eye detector [17] and subblock-based template matching [65]. Experimental results showed thatInc., the Sunnyvale, CA, USA)) that their method cannot be used in our system, either. In our system, the total recall and precision of eye detection by the Adaboost eye detector within the detected face region processing perand one 12.3%, input image (1280 ˆ In 720addition, pixels) bythe ourrecall method taken as 152 ms detection on a desktop were abouttime 10.2% respectively. andisprecision of eye by computer (3.5 GHz CPU and 8 GB of RAM) the processing time of steps (1) 12.4% and (2)and of Figure subblock-based template matching withinincluding the detected face region were about 13.7%,1 on a set-top box (STB) (MIPS-based core 1.5positions GHz, 1 GB DDR3 memory, 256/512 MB NAND respectively. These results show that dual reliable eye or keypoints are difficult to detect in our memory). Although the processing time of the previous methods [62,63] includes only the procedure of blurred face images of low pixel resolution. Therefore, the procedures of detecting keypoints, face detection, our processing of 152 and ms includes both facecannot detection and recognition. In addition, alignment (removing in-planetime rotation), face recognition be used in our research. the face images in our research are considerably blurred as shown in Figure 13c,d compared to those To overcome these problems, we propose the method of selecting one correct (upright) face in theiramong research because(in-plane-rotated) our face images are at far distancethe of procedure a maximum 2.5 m (from image multiple faceacquired candidates (without ofof detecting eye the cameraortokeypoints) the user). Therefore, methods for face based the trainingofofthe the face real positions based on their a fuzzy system, and detection enhancing the on performance Adaboost orby a neural network are difficult apply to face images in our research. recognition using only the selected faceto image.
(a)
(b)
(c)
(d)
Figure 13. 13. Comparisons with those those in in previous previous studies. studies. (a,b) (a,b) Input Input Figure Comparisons of of the the face face images images in in our our research research with images in our research; (c) Face images of (a); (d) Face images of (b). images in our research; (c) Face images of (a); (d) Face images of (b).
If we synthetically modify (manually rotate) the images of the open dataset, the discontinuous In addition, we include the comparative experiments by our method with other rotation-invariant region (between the face and its surrounding areas) occurs in the image as shown in Figure 14b (from face detection methods [63]. Because our fuzzy-based method is applied to both databases I and II the YouTube dataset) and Figure 14e (from the Honda/UCSD dataset), which causes a problem in without any parameter tuning or training according to the type of database, the neural network of their face detection and the correct accuracy of face detection is difficult to measure with these images. In method [63] is trained with all the images of databases I and II for fair comparison, and the testing order to prevent the discontinuous region, we can rotate the whole image. However, the background performance are shown with databases I and II, separately. is also rotated as shown in Figure 14c,f, where an unrealistic background (which does not exist in the real world) is produced in the rotated image, which affects the correct measurement of the face detection accuracy.
Symmetry 2016, 8, 75
22 of 28
As shown in Table 14, the accuracy of face detection by our method is higher than that by the previous method with database I. The reason why the accuracy of the previous method is lower than that of our method is that the face images in database I are blurred and the pixel resolution of the face images in database I is very low, as shown in Figure 13c. As shown in Table 15, the accuracy of face detection by our method is also higher than that of the previous method with database II. The reason why the accuracy of the previous method is lower than that of our method is that the pixel resolution of face images in database II is very low and there also exist many variations of in-plane rotation of the face images in addition to the blurring effect as shown in Figure 13d. Table 14. Comparisons of the face detection accuracy of our method with previous method (database I). Method
Recall (%)
Precision (%)
Previous method [63] Proposed method
92.21 95.80
92.87 96.06
Table 15. Comparisons of the face detection accuracy of our method with previous method (database II). Method
Recall (%)
Precision (%)
Previous method [63] Proposed method
92.94 96.67
93.26 99.39
3.3. Experimental Results with Labeled Faces in the Wild (LFW) Open Database As the next experiment, we measured the accuracies of the face detection with the LFW database [64]. Because our research is mainly focused on face detection robust to the in-plane rotation of a face, face images including other factors such as severe out-of-plane rotation and occlusion, etc., are excluded by manual selection for experiments among the images of the LFW database. This manual selection was performed by four people (two males and two females). Two people are in their twenties and the other two people are in their thirties. All four people are not the developers of our system and did not take part in our experiments for unbiased selection. We gave instructions (to the four people) to manually select the face images by comparing the images of the LFW database with those of our databases I and II. Then, only the images (selected by the consensus of all four people) are excluded in our experiments. In addition, we included the comparative results of our method and the previous method [64]. As shown in Table 16, the accuracies of face detection by our method with the LFW database are similar to those with databases I and II of Tables 14 and 15. In addition, our method outperforms the previous method [63] with the LFW database. Table 16. Comparisons of the face detection accuracy of our method with the previous method (LFW database). Method
Recall (%)
Precision (%)
Previous method [63] Proposed method
91.89 95.21
91.92 95.53
3.4. Discussions There has been a great deal of previous researches on keypoint detection of a face image in References [33–35]. However, in most previous research including References [33–35], keypoint detection has been done with face images of high pixel resolution which are captured at close distance to the camera. In contrast, the input images captured at a far distance from the camera (maximum 2.5 m) are used in our research because our study aims at face recognition at far distances in the
Symmetry 2016, 8, 75
23 of 28
environment of watching TV. Consequently, the image pixel resolution of a face area is so low (less than 40 ˆ 50 pixels), in addition to the blurring of the face image as shown in Figure 13c,d, that the previous methods of keypoint detection or eye detection are difficult to apply to the face images used in our research. As an experiment, we measured the accuracies of eye detection by the conventional Adaboost eye detector [17] and subblock-based template matching [65]. Experimental results showed that the recall and precision of eye detection by the Adaboost eye detector within the detected face region were about 10.2% and 12.3%, respectively. In addition, the recall and precision of eye detection by subblock-based template matching within the detected face region were about 12.4% and 13.7%, respectively. These results show that reliable eye positions or keypoints are difficult to detect in our blurred face images of low pixel resolution. Therefore, the procedures of detecting keypoints, alignment (removing in-plane rotation), and face recognition cannot be used in our research. To overcome these problems, we propose the method of selecting one correct (upright) face image among multiple (in-plane-rotated) face candidates (without the procedure of detecting eye positions or keypoints) based on a fuzzy system, and enhancing the performance of the face recognition by using only the selected face image. If we synthetically modify (manually rotate) the images of the open dataset, the discontinuous region (between the face and its surrounding areas) occurs in the image as shown in Figure 14b (from the YouTube dataset) and Figure 14e (from the Honda/UCSD dataset), which causes a problem in face detection and the correct accuracy of face detection is difficult to measure with these images. In order to prevent the discontinuous region, we can rotate the whole image. However, the background is also rotated as shown in Figure 14c,f, where an unrealistic background (which does not exist in the real world) is produced in the rotated image, which affects the correct measurement of the face detection accuracy. As explained before, as shown in Figure 13c,d, the pixel resolution of images used in our research of face recognition is very low in addition to the blurring effect of a face image compared to images in open databases such as the LFPW [33], BioID [34], HELEN [35], YouTube Faces (Figure 14a), and Honda/UCSD (Figure 14d) datasets. These kinds of focused images of high pixel resolution cannot be acquired in our research environment of watching TV where the user’s face is captured by a low-cost web camera at the Z distance of a maximum of 2.5 m between the camera and user (as shown in Figure 13c,d). Therefore, the experiments with these open databases cannot reflect the correct measurement of the face recognition accuracy in the environment of watching TV. There is no other open database (acquired at the Z distance of a maximum of 2.5 m) that includes large areas of background and face images of in-plane rotation like our dataset includes, as shown in Figure 13c,d. Our method cannot deal with occluded or profiled faces. However, the cases of occluded or profiled faces do not occur in our research environment where the use is usually watching TV, as shown in Figure 10. That is because more than two people do not occlude their faces and a profiled face caused by the severe out-of-plane rotation of a face cannot happen when watching TV. Therefore, we do not consider the cases of occluded or profiled faces in our research.
Symmetry 2016, 8, 75 Symmetry 2016, 8, 75
24 of 28 23 of 28
(a)
(b)
(c)
(d)
(e)
(f) Figure 14. Example Exampleofof images of YouTube and Honda/UCSD databases. (a) Original of Figure 14. images of YouTube and Honda/UCSD databases. (a) Original image ofimage YouTube YouTube database [66]; (b) Image where cropped face area is rotated and discontinuous region database [66]; (b) Image where cropped face area is rotated and discontinuous region around face area around face exists with (c) Rotated image of YouTube (d) Original image[67]; of exists with (a);area (c) Rotated image(a); of YouTube dataset; (d) Original imagedataset; of Honda/UCSD database Honda/UCSD database [67]; (e) Image where cropped face is rotated and discontinuous region (e) Image where cropped face is rotated and discontinuous region around face area exists with (d); around faceimage area exists (f) Rotated of (d).with (d); (f) Rotated image of (d).
Symmetry 2016, 8, 75
25 of 28
4. Conclusions In this paper, we proposed a new fuzzy-based face recognition algorithm that is robust to in-plane rotation. Among the multiple candidate face regions detected by image rotation and the Adaboost face detector, a single correct face region is selected by a fuzzy system and used for recognition. Experimental results using two databases show that our method outperformed previous ones. Furthermore, the performance of our method was not affected by changes in the Z distance, sitting position, or number of people in each image. By using a non-training-based fuzzy system, our method does not require a time-consuming training procedure, and the performance of our method is less affected by the kinds of databases on which it is tested. As future work, we plan to research a way to combine our fuzzy-based method with a training-based one such as neural networks, SVMs, or deep learning. In addition, we would research a method of enhancing the accuracy of face recognition based on other similarity metrics (such as human vs. machine d-prime) instead of the chi-square distance. In addition, the metric validity would be also checked based on spatial-taxon contours instead of precision and recall when measuring the accuracies of face detection. Acknowledgments: This research was supported by the MSIP (Ministry of Science, ICT and Future Planning), Korea, under the ITRC (Information Technology Research Center) support program (IITP-2016-H8501-16-1014) supervised by the IITP (Institute for Information & communications Technology Promotion), and in part by the Bio & Medical Technology Development Program of the NRF funded by the Korean government, MSIP (NRF-2016M3A9E1915855). Author Contributions: Hyung Gil Hong and Kang Ryoung Park designed the overall system for fuzzy-based face detection. In addition, they wrote and revised the paper. Won Oh Lee, Yeong Gon Kim, Ki Wan Kim, and Dat Tien Nguyen helped in the experiments and in the analyses of experimental results. Conflicts of Interest: The authors declare no conflict of interest.
References 1. 2.
3.
4.
5.
6.
7.
8.
9.
Choi, J.Y.; Plataniotis, K.N.; Ro, Y.M. Face Feature Weighted Fusion Based on Fuzzy Membership Degree for Video Face Recognition. IEEE Trans. Syst. Man Cybern. Part. B Cybern. 2012, 42, 1270–1282. Taigman, Y.; Yang, M.; Ranzato, M.A.; Wolf, L. DeepFace: Closing the Gap to Human-Level Performance in Face Verification. In Proceedings of the IEEE Conference on Computer Vision and Pattern Recognition, Columbus, DC, USA, 23–28 June 2014; pp. 1701–1708. Masi, I.; Rawls, S.; Medioni, G.; Natarajan, P. Pose-Aware Face Recognition in the Wild. In Proceedings of the IEEE Conference on Computer Vision and Pattern Recognition, Las Vegas, CA, USA, 26 June–1 July 2016; pp. 4838–4846. Sun, Y.; Wang, X.; Tang, X. Sparsifying Neural Network Connections for Face Recognition. In Proceedings of the IEEE Conference on Computer Vision and Pattern Recognition, Las Vegas, CA, USA, 26 June–1 July 2016; pp. 4856–4864. Kemelmacher-Shlizerman, I.; Seitz, S.M.; Miller, D.; Brossard, E. The MegaFace Benchmark: 1 Million Faces for Recognition at Scale. In Proceedings of the IEEE Conference on Computer Vision and Pattern Recognition, Las Vegas, CA, USA, 26 June–1 July 2016; pp. 4873–4882. Ghazi, M.M.; Ekenel, H.K. A Comprehensive Analysis of Deep Learning Based Representation for Face Recognition. In Proceedings of the IEEE Conference on Computer Vision and Pattern Recognition, Las Vegas, CA, USA, 26 June–1 July 2016; pp. 102–109. Qin, H.; Yan, J.; Li, X.; Hu, X. Joint Training of Cascaded CNN for Face Detection. In Proceedings of the IEEE Conference on Computer Vision and Pattern Recognition, Las Vegas, CA, USA, 26 June–1 July 2016; pp. 3456–3465. Yang, S.; Luo, P.; Loy, C.C.; Tang, X. WIDER FACE: A Face Detection Benchmark. In Proceedings of the IEEE Conference on Computer Vision and Pattern Recognition, Las Vegas, CA, USA, 26 June–1 July 2016; pp. 5525–5533. Vezzetti, E.; Marcolin, F.; Fracastoro, G. 3D Face Recognition: An Automatic Strategy Based on Geometrical Descriptors and Landmarks. Robot. Auton. Syst. 2014, 62, 1768–1776. [CrossRef]
Symmetry 2016, 8, 75
10. 11. 12.
13. 14.
15.
16.
17. 18. 19. 20. 21.
22.
23.
24.
25.
26.
27. 28. 29. 30.
26 of 28
Beumier, C. 3D Face Recognition. In Proceedings of the IEEE International Conference on Industrial Technology, Mumbai, India, 15–17 December 2006; pp. 369–374. An, K.H.; Chung, M.J. Cognitive Face Analysis System for Future Interactive TV. IEEE Trans. Consum. Electron. 2009, 55, 2271–2279. [CrossRef] Mlakar, T.; Zaletelj, J.; Tasic, J.F. Viewer Authentication for Personalized iTV Services. In Proceedings of the 8th International Workshop on Image Analysis for Multimedia Interactive Services, Santorini, Greece, 6–8 June 2007; pp. 63–66. Zuo, F.; de With, P.H.N. Real-time Embedded Face Recognition for Smart Home. IEEE Trans. Consum. Electron. 2005, 51, 183–190. Lee, S.-H.; Sohn, M.-K.; Kim, D.-J.; Kim, B.; Kim, H. Face Recognition of Near-infrared Images for Interactive Smart TV. In Proceedings of the 27th Conference on Image and Vision Computing New Zealand, Dunedin, New Zealand, 26–28 November 2012; pp. 335–339. Lin, K.-H.; Shiue, D.-H.; Chiu, Y.-S.; Tsai, W.-H.; Jang, F.-J.; Chen, J.-S. Design and Implementation of Face Recognition-aided IPTV Adaptive Group Recommendation System Based on NLMS Algorithm. In Proceedings of the International Symposium on Communications and Information Technologies, Gold Coast, Australia, 2–5 October 2012; pp. 626–631. Parveen, P.; Thuraisingham, B. Face Recognition Using Multiple Classifiers. In Proceedings of the 18th IEEE International Conference on Tools with Artificial Intelligence, Arlington, VA, USA, 13–15 November 2006; pp. 179–186. Viola, P.; Jones, M.J. Robust Real-Time Face Detection. Int. J. Comput. Vis. 2004, 57, 137–154. [CrossRef] Jones, M.; Viola, P. Fast Multi-View Face Detection; TR2003–96; Mitsubishi Electric Research Laboratories: Cambridge, MA, USA, August 2003. Xiao, R.; Li, M.-J.; Zhang, H.-J. Robust Multipose Face Detection in Images. IEEE Trans. Circuits Syst. Video Technol. 2004, 14, 31–41. [CrossRef] Liu, C. Gabor-Based Kernel PCA with Fractional Power Polynomial Models for Face Recognition. IEEE Trans. Pattern Anal. Mach. Intell. 2004, 26, 572–581. [PubMed] Ban, J.; Féder, M.; Jirka, V.; Loderer, M.; Omelina, L.; Oravec, M.; Pavloviˇcová, J. An Automatic Training Process Using Clustering Algorithms for Face Recognition System. In Proceedings of the 55th International Symposium ELMAR-2013, Zadar, Croatia, 25–27 September 2013; pp. 15–18. Asthana, A.; Marks, T.K.; Jones, J.M.; Tieu, K.H.; Rohith, M.V. Fully Automatic Pose-Invariant Face Recognition via 3D Pose Normalization. In Proceedings of the IEEE International Conference on Computer Vision, Barcelona, Spain, 6–13 November 2011; pp. 937–944. Joo, Y.H.; An, K.H.; Park, J.W.; Chung, M.J. Real-Time Face Recognition for Mobile Robots. In Proceedings of The 2nd International Conference on Ubiquitous Robots and Ambient Intelligence, Daejeon, Korea, 2–4 November 2005 ; pp. 43–47. Kim, D.H.; An, K.H.; Chung, M.J. Development of a Cognitive Head-Eye System: Real-time Face Detection, Tracking, Recognition and Visual Attention to Human. In Proceedings of the 13th International Conference on Advanced Robotics, Jeju Island, Korea, 21–24 August 2007; pp. 303–307. Ryu, Y.G.; An, K.H.; Kim, S.J.; Chung, M.J. Development of An Active Head Eye System for Human-Robot Interaction. In Proceedings of the 39th International Symposium on Robotics, Seoul, Korea, 15–17 October 2008. Mekuz, N.; Bauckhage, C.; Tsotsos, J.K. Face Recognition with Weighted Locally Linear Embedding. In Proceedings of the 2nd Canadian Conference on Computer and Robot Vision, British Columbia, Canada, 9–11 May 2005; pp. 290–296. Eleyan, A.; Özkaramanli, H.; Demirel, H. Complex Wavelet Transform-Based Face Recognition. EURASIP J. Adv. Signal. Process. 2008, 2008, 1–13. [CrossRef] Choi, W.-P.; Tse, S.-H.; Wong, K.-W.; Lam, K.-M. Simplified Gabor Wavelets for Human Face Recognition. Pattern Recognit. 2008, 41, 1186–1199. [CrossRef] Albiol, A.; Monzo, D.; Martin, A.; Sastre, J.; Albiol, A. Face Recognition Using HOG–EBGM. Pattern Recognit. Lett. 2008, 29, 1537–1543. [CrossRef] Anvar, S.M.H.; Yau, W.-Y.; Nandakumar, K.; Teoh, E.K. Estimating In-Plane Rotation Angle for Face Images from Multi-Poses. In Proceedings of the IEEE Symposium on Computational Intelligence in Biometrics and Identity Management, Singapore, 16–19 April 2013; pp. 52–57.
Symmetry 2016, 8, 75
31.
32. 33. 34.
35.
36.
37.
38. 39.
40. 41. 42. 43. 44. 45. 46. 47. 48. 49. 50. 51. 52.
53. 54.
27 of 28
Du, G.; Su, F.; Cai, A. Face Recognition Using SURF Features. In Proceedings of the 6th International Symposium on Multispectral Image Processing and Pattern Recognition, Yichang, China, 29–31 October 2009; pp. 749629–1–749628–7. [CrossRef] Lee, W.O.; Kim, Y.G.; Hong, H.G.; Park, K.R. Face Recognition System for Set-Top Box-Based Intelligent TV. Sensors 2014, 14, 21726–21749. [CrossRef] [PubMed] Cao, X.; Wei, Y.; Wen, F.; Sun, J. Face Alignment by Explicit Shape Regression. Int. J. Comput. Vis. 2014, 107, 177–190. [CrossRef] Kazemi, V.; Sullivan, J. One Millisecond Face Alignment with an Ensemble of Regression Trees. In Proceedings of the IEEE Conference on Computer Vision and Pattern Recognition, Columbus, OH, USA, 23–28 June 2014; pp. 1867–1874. Asthana, A.; Zafeiriou, S.; Tzimiropoulos, G.; Cheng, S.; Pantic, M. From Pixels to Response Maps: Discriminative Image Filtering for Face Alignment in the Wild. IEEE Trans. Pattern Anal. Mach. Intell. 2015, 37, 1312–1320. [CrossRef] [PubMed] Chetverikov, D. GLDH Based Analysis of Texture Anisotropy and Symmetry: An Experimental Study. In Proceedings of the 12th International Conference on Pattern Recognition, Jerusalem, Israel, 9–13 October 1994; pp. 444–448. Chen, X.; Rynn, P.J.; Bowyer, K.W. Fully Automated Facial Symmetry Axis Detection in Frontal Color Images. In Proceedings of the IEEE Workshop on Automatic Identification Advanced Technologies, Buffalo, NY, USA, 17–18 October 2005; pp. 106–111. Song, Y.-J.; Kim, Y.-G.; Chang, U.-D.; Kwon, H.B. Face Recognition Robust to Left/Right Shadows; Facial Symmetry. Pattern Recognit. 2006, 39, 1542–1545. [CrossRef] Wang, F.; Huang, C.; Liu, X. A Fusion of Face Symmetry of Two-Dimensional Principal Component Analysis and Face Recognition. In Proceedings of International Conference on Computational Intelligence and Security, Beijing, China, 11–14 December 2009; pp. 368–371. Klir, G.J.; Yuan, B. Fuzzy Sets and Fuzzy Logic; Prentice-Hall: Upper Saddle River, NJ, USA, 1995. Adeli, H.; Sarma, K.C. Cost Optimization of Structures: Fuzzy Logic, Genetic Algorithms, and Parallel Computing; John Wiley and Sons: West Sussex, UK, 2006. Siddique, N.; Adeli, H. Computational Intelligence: Synergies of Fuzzy Logic, Neural Networks and Evolutionary Computing; John Wiley and Sons: West Sussex, UK, 2013. Broekhoven, E.V.; Baets, B.D. Fast and Accurate Center of Gravity Defuzzification of Fuzzy System Outputs Defined on Trapezoidal Fuzzy Partitions. Fuzzy Sets Syst. 2006, 157, 904–918. [CrossRef] Ross, T.M. Fuzzy Logic. with Engineering Applications, 3rd ed.; John Wiley and Sons: West Sussex, UK, 2010. Mamdani, E.H. Application of Fuzzy Logic to Approximate Reasoning Using Linguistic Synthesis. IEEE Trans. Comput. 1977, C-26, 1182–1191. [CrossRef] Zadeh, L.A. Outline of a New Approach to the Analysis of Complex Systems and Decision Processes. IEEE Trans. Syst. Man Cybern. 1973, SMC-3, 28–44. [CrossRef] Ahonen, T.; Hadid, A.; Pietikäinen, M. Face Recognition with Local Binary Patterns. In Proceeding of the 8th European Conference on Computer Vision, Prague, Czech Republic, 11–14 May 2004; pp. 469–481. FEI Face Database. Available online: http://fei.edu.br/~cet/facedatabase.html (accessed on 30 October 2015). Minear, M.; Park, D.C. A Lifespan Database of Adult Facial Stimuli. Behav. Res. Methods 2004, 36, 630–633. [CrossRef] AR Face Database. Available online: http://www2.ece.ohio-state.edu/~aleix/ARdatabase.html (accessed on 30 October 2015). The Japanese Female Facial Expression (JAFFE) Database. Available online: http://www.kasrl.org/jaffe.html (accessed on 30 October 2015). Wolf, L.; Hassner, T.; Maoz, I. Face Recognition in Unconstrained Videos with Matched Background Similarity. In Proceedings of the IEEE Conference on Computer Vision and Pattern Recognition, Providence, RI, USA, 20–25 June 2011; pp. 529–534. Lee, K.-C.; Ho, J.; Yang, M.-H.; Kriegman, D. Visual Tracking and Recognition Using Probabilistic Appearance Manifolds. Comput. Vis. Image Underst. 2005, 99, 303–331. [CrossRef] Gorodnichy, D.O. Video-based Framework for Face Recognition in Video. In Proceedings of the 2nd Canadian Conference on Computer and Robot Vision, British Columbia, BC, Canada, 9–11 May 2005; pp. 1–9.
Symmetry 2016, 8, 75
55. 56. 57. 58.
59. 60.
61. 62.
63.
64. 65. 66. 67.
28 of 28
Dongguk Face Database (DFace-DB1). Available online: http://dm.dgu.edu/link.html (accessed on 29 April 2016). Belhumeur, P.N.; Hespanha, J.P.; Kriegman, D.J. Eigenfaces vs. Fisherfaces: Recognition Using Class Specific Linear Projection. IEEE Trans. Pattern Anal. Mach. Intell. 1997, 19, 711–720. [CrossRef] Turk, M.; Pentland, A. Eigenfaces for Recognition. J. Cogn. Neurosci. 1991, 3, 71–86. [CrossRef] [PubMed] Li, S.Z.; Hou, X.W.; Zhang, H.J.; Cheng, Q.S. Learning Spatially Localized, Parts-based Representation. In Proceedings of the IEEE Conference on Computer Vision and Pattern Recognition, Kauai, HI, USA, 8–14 December 2001; pp. 207–212. Kim, S.-K.; Park, Y.J.; Toh, K.-A.; Lee, S. SVM-based Feature Extraction for Face Recognition. Pattern Recognit. 2010, 43, 2871–2881. [CrossRef] Froba, B.; Ernst, A. Face Detection with the Modified Census Transform. In Proceedings of the IEEE International Conference on Automatic Face and Gesture Recognition, Seoul, Korea, 17–19 May 2004; pp. 91–96. OpenCV. Available online: http://opencv.org/ (accessed on 11 July 2016). Wu, B.; AI, H.; Huang, C.; Lao, S. Fast Rotation Invariant Multi-View Face Detection Based on Real Adaboost. In Proceedings of the 6th IEEE International Conference on Automatic Face and Gesture Recognition, Seoul, Korea, 17–19 May 2004; pp. 79–84. Rowley, H.A.; Baluja, S.; Kanade, T. Rotation Invariant Neural Network-Based Face Detection. In Proceedings of IEEE Computer Society Conference on Computer Vision and Pattern Recognition, Santa Barbara, CA, USA, 23–25 June 1998; pp. 38–44. Labeled Faces in the Wild. Available online: http://vis-www.cs.umass.edu/lfw/ (accessed on 29 April 2016). Kim, B.-S.; Lee, H.; Kim, W.-Y. Rapid Eye Detection Method for Non-glasses Type 3D Display on Portable Devices. IEEE Trans. Consum. Electron. 2010, 56, 2498–2505. [CrossRef] YouTube Faces DB. Available online: http://www.cs.tau.ac.il/~wolf/ytfaces/ (accessed on 29 April 2016). The Honda/UCSD Video Database. Available online: http://vision.ucsd.edu/~leekc/ HondaUCSDVideoDatabase/HondaUCSD.html (accessed on 29 April 2016). © 2016 by the authors; licensee MDPI, Basel, Switzerland. This article is an open access article distributed under the terms and conditions of the Creative Commons Attribution (CC-BY) license (http://creativecommons.org/licenses/by/4.0/).