Proceedings of the 56th ASMS Conference on Mass Spectrometry and Allied Topics, Denver, CO, June 1 - 5, 2008
Gauging complimentary proteomics discovery of Nostoc punctiforme PCC 73102 using a combination of FFE, SCX, Ion-Trap and QTOF-MS Ow1,
Saw Yen 1Biological
Introduction
Nishikant
, Mikkel
Nissum2,
P.C.
Phone number +44 (0)114 222 7528 Fax Number +44 (0)114 222 7501 Email:
[email protected] [email protected] [email protected]
and Environmental Systems Group. Department of Chemical and Process Engineering, The University of Sheffield, UK. 2Bd Diagnostics, Martinsried, GERMANY
SCX pre-fractionation & isoelectric focussing by FFE:
C
Mappin St. Sheffield S1 3JD, U.K.
Wright1
20
18
18
• For SCX pre-fractionation, 1mg of protein was reduced, alkylated and simplified with trypsin. Peptides were separated using PolyLC PolySULFOETHYL A column (200 x 2.1 mm, 5 µm) with a 60 min gradient.
16
16
I
14
b
II
14
z-score
A
z-score
Overview
12
12 10
10
8
8
6
6
4
• For isoelectric focussing by FFE, 1mg of protein was diluted in separation medium containing 7 M Urea, 2 M thiourea, 250 mM mannitol and Prolytes (to generate pH gradient). pH gradient of 4-9 was used for fractionation at voltage of 520 v, 13 mA at a temp. of 10 °C as described by Wang et. al. (2004).
2 2
0 0
III
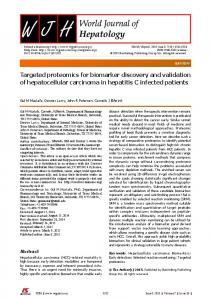
Fig 6: p-value distribution of the soluble Nostoc punctiforme proteome. The probabilistically calculated p-values of identified peptides were plotted against a scoring value (z-score). For peptide ms/ms search minimum peptide length is kept 6; minimum z-score of 5.5 and filtering criteria i.e., P-value set at 1.0 x 10 -4. Scoring model was selected as per the instruments used. Enzyme specificty was set at trypsin, and a mass difference of + 1.0 and + 0.5 Da for precursor and fragment ions, respectively was accepted. Half-tryptic peptides with 2 missed cleavages were allowed. Figures shows the calculated p-value obtained in different workflows. (I): p-value distribution found in identified peptides when samples were pre-fractionated with FFE isoelectric focussing and spectra MS2 acquired using QSTAR-XL. (II): p-value distribution found in identified peptides when samples were pre-fractionated with SCX chromatography and spectra MS2 acquired using QSTAR-XL. (III): p-value distribution found in identified peptides when samples were pre-fractionated with SCX chromatography, spectra MS2 acquired using Bruker HCT Ultra Ion-Trap with dynamically selected 2 precursors. (IV): p-value distribution found in identified peptides when samples were pre-fractionated with SCX chromatography, spectra MS2 acquired using Bruker HCT Ultra IonTrap with dynamically selected 6 precursors.
Ion-TRAP_2ms QSTAR_SCX
Unknown
Periplasmic
OuterMembrane
Extracellular
CytoplasmicMembrane
586
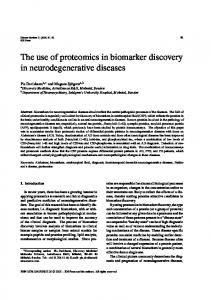
Fig 3: a) Venn diagram showing complimentary and enhanced identification achieved through two different types of mass spectrometer instruments.
Q-IT (6MS2)
26204
4221
851
b) Evidence suggesting the importance of precursor selection and duty cycle to achieve enhanced coverage of proteome mining. c) Evidence suggesting enhanced coverage in FFE/SCX prefractionation technique with only 6.9% overlap.
Fractions 21-35
Fractions 5-20
Cytoplasmic
Fig 7: Comparative sub-cellular localization of proteins found in Ion-TRAP-SCX (2ms/ms and 6ms/ms) and QSTAR-XL (SCX and FFE) workflow.
3705
Principal outcome •Increased
proteome
p-value
c
Ion-TRAP_6ms
200
0
14047
coverage
achieved
by
application of SCX and FFE pre-fractionation. •Proteome found in Q-IT (HCT Ultra) showed 70.59% overlap with the proteome found in Q-TOF (QSTAR-
x10
4 . 0 1
2.0 Intens. 7 x1 0
. 8 0
Inte ns. 8 x10
a
3 . 0 2
1.5
1.2
1.5 . 6 0
6
Intens. 8 x1 0
1.0
2 . 4 0
1.5
. 0 1
1.0 . 0 1
1
4
0.6
0.8
4
. 5 0
. 6 0
. 0 1
0.4
x10
4
8
0.5
0.50
References: Chee Sian Gan, Kenneth F. Reardon, Phillip C. Wright: Comparison of protein and peptide prefractionation methods for the shotgun proteomic analysis of Synechocystis sp. PCC 6803, Proteomics (2005); 5,2468-2478
XL) which eventually validates proteins we found in
1.0
0.75
. 2 0
. 8 0
8
. 0 0
5
1.0
5
0.8
.5 1
x1 0
x10
1.00
. 5 1
x10
of two pre-fractionation
6
2
QSTAR_FFE
Q-IT (2MS2)
8
p-value
300
940
IV
10
4
350
6,681
14
0 1.00E +03 1. 00E-02 1. 00E-07 1. 00E-12 1.00E -17 1. 00E-22 1.00E -27 1.00E -32 1. 00E-37 1.00E -42 1. 00E-47 1.00E -52 1.00E -57
100
8
p-value
0
400
16,795
x10
1.00E+0 1.00E- 1. 00E- 1. 00E- 1. 00E- 1.00E- 1.00E- 1.00E- 1.00E- 1.00E- 1.00E- 1.00E- 1.00E- 1.00E- 1. 00E- 1.00E- 1.00E- 1.00E- 1. 00E- 1. 00E01 04 07 10 13 16 19 22 25 28 31 34 37 40 43 46 49 52 55
1.00E271
2
450
QTOF (2MS2)
present investigation for study
1. 00E66
4
150
workflow employed in the
1.00E61
12
50
Fig 2: Showing typical
1.00E56
1.00E+01 1. 00E-0 3 1.00 E-07 1.00 E-11 1.00 E-15 1. 00E-1 9 1.00 E-23 1.00 E-27 1.00 E-31 1. 00E-3 5 1.00E-39 1.00 E-43 1.00 E-47
Proteome Mining Statistics
• Protein extraction was done by resuspending the biomass in 40 mM Tris-HCl pH 8.5 via mechanical disruption. Crude protein extract separated at 21,000 x g. Protein quantitation was done by Bio-Rad RCDC protocol according to the manufacturer instructions. Multiple 1 mg proteome were reduced and cysteine blocked. Aliquot of samples were subject to fractionation (FFE & SCX) either before or after tryptic digestion in 50:1 ratio of trypsin.
1.00E 51
6
Results Unique Proteins
1. 00E46
8
250
Valid Peptides
1.00E41
10
Protein subcellular localization found in various workflows
Mass Total Spectrome Peptides ter
1.00E36
16
No of proteins
• Nostoc punctiforme PCC 73102 was maintained under diazotrophic condition on BG-110 (N2 fixing condition), 25 °C at a constant light intensity of 50 mE/m2/s. Cells were harvested at mid-to-exponential log phase.
1.00E31
18
12
MS/MS spectra interpreted by Phenyx from N. punctiforme database downloaded from the ORNL website (http://genome.ornl.gov/microbial/npun/), half-tryptic peptides and 2 missed cleavages were allowed. Scoring model was set at a p-value < 1x 10 -4 according to Heller, et. al.(2005).
Culture conditions and protein extraction
1.00E26
14
Data processing:
Materials and Methods
1. 00E21
16
Tandem peptide spectra MS2 were acquired using QSTAR XL Q-TOF MS and Bruker HCT Ultra PTM discovery Q-IT MS using variable settings of either 2 or 6 dynamically selected CID induced precursors (1MS with 2MS2 or 6MS2; in Q-IT only).
Present study explores the liquid phase isoelectric FFE fractionation (free-flow electrophoresis) and SCX (strong cation exchange) HPLC to understand the applicability of these technologies on qualitative and quantitative proteomics shotgun studies as previously shown by Gan et. al (2005). We choose Nostoc punctiforme PCC 73102 as a model organism in the present study.
1.00E16
C
Peptide Sequencing by Tandem MS:
Fig. 1: A schematic diagram of workflow and instruments used in the present study. A: Bruker HCT Ultra PTM discovery; B: QSTARXL; C: Bd FFETM system; D: PolyLC SCX on Dionex LC
1.00E 11
p-value
FFE fractions were cleaned with Centricon Ultracel® YM-3.
-
1. 00E06
Z -score
D
B
4
1.00E+0 1.00E4 01
Z-score
v High degree of complementation between tandem MS instruments on complex proteome analysis of nitrogenfixing cyanobacterium. v Robustness of SCX has been already well established for qualitative and quantitative proteomics, but in the present study we found that FFE iso-electric based separation also yields a similar level of results v Two entirely different mass spectrometers were deployed during the present study v Identification based on FFE/SCX are highly complimentary.
Wase1
Contact details:
0.5
1.0 0
3
.0 1
3.0
0.0
0.6 . 8 0
0.2
. 4 0
Intens. 8 x10
. 0 0
3
4
8
0
2
3
techniques (FFE/SCX) and
x1 0
. 6 0
7
3
0
x1 0
0.2
8 x1 0 . 50 1
.0 0
60
60
70
70
80
0 8
1.0
Ti me[ min]
both MS instruments.
Ti me[ min]
0.0
1
2
0
0.75
Intens. 8 x10
0
4
1.0
•Precursor selection and duty cycle has a definite
0.5 0.5
1
. 5 1
0
1.0
1.25 0
x10
0.50
0.8
0.0
. 00 1
1.25
1. 5 . 0 1
2
. 5 0
1.00
0
0.6
0.25
. 75 0
0.0
0.5
1.00
. 0 0 0
10
20
30
40
50
60
70
80
. 0 0
. 00 0
0.25 0. 0
0.00 0
Ti me [min]
10
0.4
0.75 0
. 25 0 0. 5
0.50
90
. 5 0 . 50 0
Signal count
1. 0
0.75
20
30
40
50
60
Time ( Min)
70
80
90
Ti me [min]
0.00
bearing on the shotgun performance where 6 MS2
0.0
0.2
0.50
0.0
0.25
Yonghui Wang, William S. Hancock, Gerhard Weber,Christoph Eckerskorn, Darryl Palmer-Toy; Free flow electrophoresis coupled with liquid chromatography-mass spectrometry for a proteimic study of the human cell lines (K562/CR3), Journal of Chromatography A, 1053 (2004) 269-278
0.00 0
10
20
30
40
50
60
0 7
80
90
Ti me[ min]
precursor
Time (min)
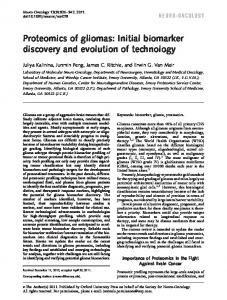
Fig. 4: Representation of actual peak intensities with relation to the respective fractions. Current figure shows peak intensities for SCX fractions run on Bruker HCT ultra Ion-Trap with a duty cycle of 2ms2 from the high scoring fractions.
Chemical & Process Engineering.
90
90
1.0
1.5
. 0 0
. 0 1
Signal cou nt
50
50
0.0
1 1.00
8 x10 1.2
1
. 5 1
comparison in two distinctly
40
40
. 0 2
8 . 25 1
30
30
0
1.5 . 2 0
4
2
6
20
0.00
2 2
1.25 8
2 . 5 2
Intens. 8 x1 0
10
0.5 1
2.0 . 0 0
x10
x1 0
systems Q-TOF/Q-IT.
0.4 1.5
. 4 0
. 0 2
different mass spectrometry
. 2 0
6
20
0.0
.5 0 3
7 x10 . 0 3 7
10
0.25
2.5 0.0
Fig 5(a): Comparative virtual gel achieved through two complimentary mass spectrometry workflows. A total of 1606 unique proteins were found which is around 20.66% of total proteome coverage. (b & c): shows predicted membrane and secretory proteins
Acknowledgments
scan
yields
>
40%
enhanced
identification (HCT Ultra Ion-Trap). •Complementary mass spectrometry yielded highly
Heller M, Ye M, Michel PE, Morier P, Stalder D, Jünger MA, Aebersold R, Reymond F, Rossier JS; Added value for tandem mass spectrometry shotgun proteomics data validation through isoelectric focusing of peptides. J Proteome Res. 2005 Nov-Dec;4(6):2273-82.
enhanced proteome coverage.
FP6- NEST Pathfinder Synthetic Biology project num. 043340.
‘Engineering from Molecules’ www.sheffield.ac.uk/cpe