May 1, 2017 - Terrell J, Kofink A, Middleton J, Rainear C, Murphy-Hill E, Parnin C, ..... The one exception is .m, which
A peer-reviewed version of this preprint was published in PeerJ on 1 May 2017. View the peer-reviewed version (peerj.com/articles/cs-111), which is the preferred citable publication unless you specifically need to cite this preprint. Terrell J, Kofink A, Middleton J, Rainear C, Murphy-Hill E, Parnin C, Stallings J. (2017) Gender differences and bias in open source: pull request acceptance of women versus men. PeerJ Computer Science 3:e111 https://doi.org/10.7717/peerj-cs.111
Gender Differences and Bias in Open Source: Pull Request Acceptance of Women Versus Men Josh Terrell1 , Andrew Kofink2 , Justin Middleton2 , Clarissa Rainear2 , Emerson Murphy-Hill2∗ , Chris Parnin2 , Jon Stallings3 1 2
Department of Computer Science, Cal Poly, San Luis Obispo, USA
Department of Computer Science, North Carolina State University, USA 3
∗
Department of Statistics, North Carolina State University, USA
To whom correspondence should be addressed; E-mail:
[email protected]
Biases against women in the workplace have been documented in a variety of studies. This paper presents the largest study to date on gender bias, where we compare acceptance rates of contributions from men versus women in an open source software community. Surprisingly, our results show that women’s contributions tend to be accepted more often than men’s. However, women’s acceptance rates are higher only when they are not identifiable as women. Our results suggest that although women on GitHub may be more competent overall, bias against them exists nonetheless.
Introduction In 2012, a software developer named Rachel Nabors wrote about her experiences trying to fix bugs in open source software.1 Nabors was surprised that all of her contributions were rejected 1
http://rachelnabors.com/2012/04/of-github-and-pull-requests-and-comics/
1
PeerJ Preprints | https://doi.org/10.7287/peerj.preprints.1733v2 | CC BY 4.0 Open Access | rec: 26 Jul 2016, publ: 26 Jul 2016
by the project owners. A reader suggested that she was being discriminated against because of her gender. Research suggests that, indeed, gender bias pervades open source. The most obvious illustration is the underrepresentation of women in open source; in a 2013 survey of the more than 2000 open source developers who indicated a gender, only 11.2% were women [2]. In Vasilescu and colleagues’ study of Stack Overflow, a question and answer community for programmers, they found “a relatively ‘unhealthy’ community where women disengage sooner, although their activity levels are comparable to men’s” [26]. These studies are especially troubling in light of recent research which suggests that diverse software development teams are more productive than homogeneous teams [27]. This article presents an investigation of gender bias in open source by studying how software developers respond to pull requests, proposed changes to a software project’s code, documentation, or other resources. A successfully accepted, or ‘merged,’ example is shown in Figure 1. We investigate whether pull requests are accepted at different rates for self-identified women compared to self-identified men. For brevity, we will call these developers ‘women’ and ‘men,’ respectively. Our methodology is to analyze historical GitHub data to evaluate whether pull requests from women are accepted less often. While other open source communities exist, we chose to study GitHub because it is the largest [14], claiming to have over 12 million collaborators across 31 million software repositories.2 The main contribution of this paper is an examination of gender differences and bias in the open source software community, enabled by a novel gender linking technique that associates more than 1.4 million community members to self-reported genders. To our knowledge, this is the largest scale study of gender bias to date. 2
https://github.com/about/press
2
PeerJ Preprints | https://doi.org/10.7287/peerj.preprints.1733v2 | CC BY 4.0 Open Access | rec: 26 Jul 2016, publ: 26 Jul 2016
Figure 1: GitHub user ‘JustinAMiddleton’ makes a pull request; the repository owner ‘akofink’ accepts it by merging it. The changes proposed by JustinAMiddleton are now incorporated into the project.
Related Work A substantial part of activity on GitHub is done in a professional context, so studies of gender bias in the workplace are relevant. Because we cannot summarize all such studies here, we instead turn to Davison and Burke’s meta-analysis of 53 papers, each studying between 43 and 523 participants, finding that male and female job applicants generally received lower ratings for opposite-sex-type jobs (e.g., nurse is a female sex-typed job, whereas carpenter is male sex-typed) [10]. The research described in Davison and Burke’s meta-analysis can be divided into experi3
PeerJ Preprints | https://doi.org/10.7287/peerj.preprints.1733v2 | CC BY 4.0 Open Access | rec: 26 Jul 2016, publ: 26 Jul 2016
ments and field studies. Experiments attempt to isolate the effect of gender bias by controlling for extrinsic factors, such as level of education. For example, Knobloch-Westerwick and colleagues asked 243 scholars to read and evaluate research paper abstracts, then systematically varied the gender of each author; overall, scholars rated papers with male authors as having higher scientific quality [17]. In contrast to experiments, field studies examine existing data to infer where gender bias may have occurred retrospectively. For example, Roth and colleagues’ meta-analysis of such studies, encompassing 45,733 participants, found that while women tend to receive better job performance ratings than men, women also tend to be passed up for promotion [25]. Experiments and retrospective field studies each have advantages. The advantage of experiments is that they can more confidently infer cause and effect by isolating gender as the predictor variable. The advantage of retrospective field studies is that they tend to have higher ecological validity because they are conducted in real-world situations. In this paper, we use a retrospective field study as a first step to quantify the effect of gender bias in open source. Several other studies have investigated gender in the context of software development. Burnett and colleagues analyzed gender differences in 5 studies that surveyed or interviewed a total of 2991 programmers; they found substantial differences in software feature usage, tinkering with and exploring features, and in self-efficacy [6]. Arun and Arun surveyed 110 Indian software developers about their attitudes to understand gender roles and relations but did not investigate bias [3]. Drawing on survey data, Graham and Smith demonstrated that women in computer and math occupations generally earn only about 88% of what men earn [15]. Lagesen contrasts the cases of Western versus Malaysian enrollment in computer science classes, finding that differing rates of participation across genders results from opposing perspectives of whether computing is a “masculine” profession [18]. The present paper builds on this prior work by looking at a larger population of developers in the context of open source communities. 4
PeerJ Preprints | https://doi.org/10.7287/peerj.preprints.1733v2 | CC BY 4.0 Open Access | rec: 26 Jul 2016, publ: 26 Jul 2016
Some research has focused on differences in gender contribution in other kinds of virtual collaborative environments, particularly Wikipedia. Antin and colleagues followed the activity of 437 contributors with self-identified genders on Wikipedia and found that, of the most active users, men made more frequent contributions while women made larger contributions [1]. There are two gender studies about open source software development specifically. The first study is Nafus’ anthropological mixed-methods study of open source contributors, which found that “men monopolize code authorship and simultaneously de-legitimize the kinds of social ties necessary to build mechanisms for women’s inclusion”, meaning values such as politeness are favored less by men [22]. The other is Vasilescu and colleagues’ study of 4,500 GitHub contributors, where they inferred the contributors’ gender based on their names and locations (and validated 816 of those genders through a survey); they found that gender diversity is a significant and positive predictor of productivity [27]. Our work builds on this by investigating bias systematically and at a larger scale.
General Methodology Our main research question was To what extent does gender bias exist among people who judge GitHub pull requests? To answer this question, we approached the problem by examining whether men and women are equally likely to have their pull requests accepted on GitHub, then investigated why differences might exist. While the data analysis techniques we used were specific to each approach, there were several commonalities in the data sets that we used, as we briefly explain below. For the sake of maximizing readability of this paper, we describe our methodology in detail in the Material and Methods appendix. 5
PeerJ Preprints | https://doi.org/10.7287/peerj.preprints.1733v2 | CC BY 4.0 Open Access | rec: 26 Jul 2016, publ: 26 Jul 2016
We started with a GHTorrent [12] dataset that contained public data on pull requests from June 7, 2010 to April 1, 2015, as well as data about users and projects. We then augmented this GHTorrent data by mining GitHub’s webpages for information about each pull request status, description, and comments. GitHub does not request information about users’ genders. While previous approaches have used gender inference [26, 27], we took a different approach – linking GitHub accounts with social media profiles where the user has self-reported gender. Specifically, we extract users’ email addresses from GHTorrent, look up that email address on the Google+ social network, then, if that user has a profile, extract gender information from these users’ profiles. Out of 4,037,953 GitHub user profiles with email addresses, we were able to identify 1,426,127 (35.3%) of them as men or women through their public Google+ profiles. We are the first to use this technique, to our knowledge. As an aside, we believe that our gender linking approach raises privacy concerns, which we have taken several steps to address. First, this research has undergone human subjects IRB review,3 research that is based entirely on publicly available data. Second, we have informed Google about our approach in order to determine whether they believe our approach to linking email addresses to gender is a privacy violation of their users; they responded that it is consistent with Google’s terms of service.4 Third, to protect the identities of the people described in this study to the extent possible, we do not plan to release our data that links GitHub users to genders. 3
NCSU IRB number 6708. https://sites.google.com/site/bughunteruniversity/nonvuln/ discover-your-name-based-on-e-mail-address 4
6
PeerJ Preprints | https://doi.org/10.7287/peerj.preprints.1733v2 | CC BY 4.0 Open Access | rec: 26 Jul 2016, publ: 26 Jul 2016
Results Are women’s pull requests less likely to be accepted? We hypothesized that pull requests made by women are less likely to be accepted than those made by men. Prior work on gender bias in hiring – that women tend to have resumes less favorably evaluated than men [10] – suggests that this hypothesis may be true. To evaluate this hypothesis, we looked at the pull status of every pull request submitted by women compared to those submitted by men. We then calculate the merge rate and corresponding confidence interval, using the Clopper-Pearson exact method [9], and find the following: Gender Women Men
Merge Rate 95% Confidence Interval 78.7% [78.45%,78.88%] 74.6% [74.57%,74.67%]
Open Closed Merged 8,216 21,890 111,011 150,248 591,785 2,181,517
The hypothesis is not only false, but it is in the opposite direction than expected; women tend to have their pull requests accepted at a higher rate than men! This difference is statistically significant (χ2 (df = 1, n = 3, 064, 667) = 1, 170, p < .001). What could explain this unexpected result?
Open Source Effects. Perhaps our GitHub data are not representative of the open source community; while all projects we analyzed were public, not all of them are licensed as open source. Nonetheless, if we restrict our analysis to just projects that are explicitly licensed as open source, women continue to have a higher acceptance rate (χ2 (df = 1, n = 1, 424, 127) = 347, p < .001): Gender Women Men
Merge Rate 95% Confidence Interval 78.1% [77.69%,78.49%] 74.1% [73.99%,74.14%]
Open Closed Merged 1,573 7,669 32,944 60,476 297,968 1,023,497
7
PeerJ Preprints | https://doi.org/10.7287/peerj.preprints.1733v2 | CC BY 4.0 Open Access | rec: 26 Jul 2016, publ: 26 Jul 2016
Men 40%
30%
30%
% of Men
% of Women
Women 40%
20%
10%
0%
20%
10%
0%
25%
50%
75%
100%
0%
0%
25%
50%
75%
100%
Acceptance Rate
Figure 2: Histogram of mean acceptance rate per developer for Women (Mean 76.9%, Median 84.9%) and Men (Mean 71.0%, Median 76.0%) Insider Effects. Perhaps women’s high acceptance rate is because they are already well known in the projects they make pull requests in. Pull requests can be made by anyone, including both insiders (explicitly authorized owners and collaborators) and outsiders (other GitHub users). If we exclude insiders from our analysis, the women’s acceptance rate (64.4% [63.99%,64.82%]) continues to be significantly higher than men’s (62.7% [62.61%,62.77%]) (χ2 (df = 1, n = 1, 473, 190) = 62, p < .001).
8
PeerJ Preprints | https://doi.org/10.7287/peerj.preprints.1733v2 | CC BY 4.0 Open Access | rec: 26 Jul 2016, publ: 26 Jul 2016
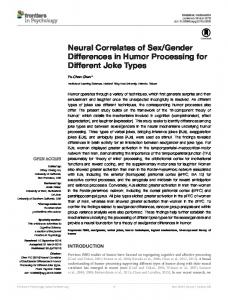
Experience Effects. Perhaps only a few highly successful and prolific women, responsible for a substantial part of overall success, are skewing the results. To test this, we calculated the pull request acceptance rate for each woman and man with 5 or more pull requests, then found the average acceptance rate across those two groups. The results are displayed in Figure 2. We notice that women tend to have a bimodal distribution, typically being either very successful (> 90% acceptance rate) or unsuccessful (< 10%). But these data tell the same story as the overall acceptance rate; women are more likely than men to have their pull requests accepted. Why might women have a higher acceptance rate than men, given the gender bias documented in the literature? In the remainder of this section, we will explore this question by evaluating several hypotheses that might explain the result.
Do women’s pull request acceptance rates start low and increase over time? One plausible explanation is that women’s first few pull requests get rejected at a disproportionate rate compared to men’s, so they feel dejected and do not make future pull requests. This explanation is supported by Reagle’s account of women’s participation in virtual collaborative environments, where an aggressive argument style is necessary to justify one’s own contributions, a style that many women may find to be not worthwhile [24]. Thus, the overall higher acceptance rate for women would be due to survivorship bias within GitHub; the women who remain and do the majority of pull requests would be better equipped to contribute, and defend their contributions, than men. Thus, we might expect that women have a lower acceptance rate than men for early pull requests but have an equivalent acceptance rate later. To evaluate this hypothesis, we examine pull request acceptance rate over time, that is, the mean acceptance rate for developers on their first pull request, second pull request, and so on. Figure 3 displays the results. Orange points represent the mean acceptance rate for women, and purple points represent acceptance rates for men. Shaded regions indicate the pointwise 95%
9
PeerJ Preprints | https://doi.org/10.7287/peerj.preprints.1733v2 | CC BY 4.0 Open Access | rec: 26 Jul 2016, publ: 26 Jul 2016
●
●
Acceptance Rate
90%
Women Men
●
●
80%
● ●
● ●
●●
●●
● ● ● ● ●● ● ●●●●●● ●● ●● ● ● ● ● ● ● ● ● ●●●● ●● ● ● ● ● ● ●●●●●●● ● ●●●● ● ● ● ● ●● ● ● ● ● ● ● ● ●●● ● ● ● ● ●● ● ● ● ●● ● ● ● ● ●●●● ● ● ● ●● ●●● ● ● ● ● ● ●● ● ● ●● ●
●
●
● ● ● ● ● ● ● ● ●
● ●
●
●
●●
●●
●
●
● ● ● ● ● ● ● ● ● ● ● ● ● ● ● ● ● ● ● ● ● ● ● ● ● ● ● ● ● ● ● ● ● ● ● ● ● ● ●● ● ● ● ● ● ●● ●●●●●● ●●●● ●●●●●●●●●● ●●●●●●● ●●● ●●●● ●●● ●●● ●●● ●● ● ● ●● ●● ●●
● ●
●
●
● ● ● ●
●
● ● ●
●
●
70%
● ● ● ● ●
●
●
●
60%
1
2
4
8
16
32
64
128
Pull Requests
Figure 3: Pull request acceptance rate over time Clopper-Pearson confidence interval. While developers making their initial pull requests do get rejected more often, women generally still maintain a higher rate of acceptance throughout. The acceptance rate of women tends to fluctuate at the right of the graph, because the acceptance rate is affected by only a few individuals. For instance, at 128 pull requests, only 103 women are represented. Intuitively, where the shaded region for women includes the corresponding data point for men, the reader can consider the data too sparse to conclude that a substantial difference exists between acceptance rates for women and men. Nonetheless, between 1 and 64 pull requests, women’s higher 10
PeerJ Preprints | https://doi.org/10.7287/peerj.preprints.1733v2 | CC BY 4.0 Open Access | rec: 26 Jul 2016, publ: 26 Jul 2016
acceptance rate remains. Thus, the evidence casts doubt on our hypothesis.
Are women focusing their efforts on fewer projects? One possible explanation for women’s higher acceptance rates is that they are focusing their efforts more than men; perhaps their success is explained by doing pull requests on few projects, whereas men tend to do pull requests on more projects. First, the data do suggest that women tend to contribute to fewer projects than men. While the median number of projects contributed to via pull request is 1 for both genders (that is, the 50th percentile of developers); at the 75th percentile it is 2 for women and 3 for men, and at the 90th percentile it is 4 for women and 7 for men. But the fact that women tend to contribute to fewer projects does not explain why women tend to have a higher acceptance rate. To see why, consider Figure 4; on the y axis is mean acceptance rate by gender, and on the x axis is number of projects contributed to. When contributing to between 1 and 5 projects, women have a higher acceptance rate as they contribute to more projects. Beyond 5 projects, the 95% confidence interval indicates women’s data are too sparse to draw conclusions confidently.
Are women making pull requests that are more needed? Another explanation for women’s pull request acceptance rate is that, perhaps, women disproportionately make contributions that projects need more specifically. What makes a contribution “needed” is difficult to assess from a third-party perspective. One way is to look at which pull requests link to issues in projects’ GitHub issue trackers. If a pull request references an issue, we consider it to serve a more specific and recognized need than an otherwise comparable one that does not. To support this argument with data, we randomly selected 30 pull request descriptions that referenced issues; in 28 cases, the reference was an attempt to fix all or part of
11
PeerJ Preprints | https://doi.org/10.7287/peerj.preprints.1733v2 | CC BY 4.0 Open Access | rec: 26 Jul 2016, publ: 26 Jul 2016
●
●
Acceptance Rate
90%
Women Men
80%
● ●
●
●
●
● ●
70%
●
●
●
●
●
●
●
8
9
●
● ● ● ●
●
60%
1
2
3
4
5
6
7
10
Projects Contributed To
Figure 4: Pull request acceptance rate by number of projects contributed to. an issue. Based on this high probability, we can assume that when someone references an issue in a pull request description, they usually intend to fix a specific problem in the project. Thus, if women more often submit pull requests that address an documented need and this is enough to improve acceptance rates, we would expect that these same requests are more often linked to issues. We evaluate this hypothesis by parsing pull request descriptions and calculating the percentage of pulls that reference an issue. To eliminate projects that do not use issues or do not customarily link to them in pull requests, we analyze only pull requests in projects that have at 12
PeerJ Preprints | https://doi.org/10.7287/peerj.preprints.1733v2 | CC BY 4.0 Open Access | rec: 26 Jul 2016, publ: 26 Jul 2016
least one linked pull request. Here are the results: Gender Women Men
without reference 33,697 1,196,519
with reference % 4,748 12.4% 182,040 13.2%
95% Confidence Interval [12.02%,12.68%] [13.15%,13.26%]
This data show a statistically significant difference (χ2 (df = 1, n = 1, 417, 004) = 24, p < .001). Contrary to the hypothesis, women are slightly less likely to submit a pull request that mentions an issue, suggesting that women’s pull requests are less likely to fulfill an documented need. Note that this does not imply women’s pull requests are less valuable, but instead that the need they fulfill appears less likely to be recognized and documented before the pull request was created. Regardless, the result suggests that women’s increased success rate is not explained by making more specifically needed pull requests.
Are women making smaller changes? Maybe women are disproportionately making small changes that are accepted at a higher rate because the changes are easier for project owners to evaluate. This is supported by prior work on pull requests suggesting that smaller changes tend to be accepted more than larger ones [13]. We evaluated the size of the contributions by analyzing lines of code, modified files, and number of commits included. The following table lists the median and mean lines of code added, removed, files changed, and commits across 3,062,677 pull requests: Women Men t-test
median mean median mean statistic df p CI
lines added 29 1,591 20 1,003 5.74 146,897 < .001 [387.3,789.3]
lines removed 5 597 4 431 3.03 149,446 0.0024554 [58.3,272]
files changed 2 29.2 2 26.8 1.52 186,011 0.12727 [-0.7,5.4]
commits 1 5.2 1 4.8 7.36 155,643 < .001 [0.3,0.5]
The bottom of this chart includes Welch’s t-test statistics, comparing women’s and men’s met-
13
PeerJ Preprints | https://doi.org/10.7287/peerj.preprints.1733v2 | CC BY 4.0 Open Access | rec: 26 Jul 2016, publ: 26 Jul 2016
rics, including 95% confidence intervals for the mean difference. For three of four measures of size, women’s pull requests are significantly larger than men’s. One threat to this analysis is that lines added or removed may exaggerate the size of a change whenever a refactoring is performed. For instance, if a developer moves a 1000-line class from one folder to another, even though the change may be relatively benign, the change will show up as 1000 lines added and 1000 lines removed. Although this threat is difficult to mitigate definitively, we can begin to address it by calculating the net change for each pull request as the number of added lines minus the number of removed lines. Here is the result: net lines changed women median 11 mean 995 men median 7 mean 571 t-test statistic 4.06 df 148,010 < .001 p [218.9,627.4] CI This difference is also statistically significant. So even in the face of refactoring, the conclusion holds: women make pull requests that add and remove more lines of code, and contain more commits. This is consistent with larger changes women make on Wikipedia [1].
Are women’s pull requests more successful when contributing code? One potential explanation for why women get their pull requests accepted more often is that the kinds of changes they make are different. For instance, changes to HTML could be more likely to be accepted than changes to C code, and if women are more likely to change HTML, this may explain our results. Thus, if we look only at acceptance rates of pull requests that make changes to program code, women’s high acceptance rates might disappear. For this, we define program code as files that have an extension that corresponds to a Turing-complete programming language. We categorize pull requests as belonging to a single type of source code 14
PeerJ Preprints | https://doi.org/10.7287/peerj.preprints.1733v2 | CC BY 4.0 Open Access | rec: 26 Jul 2016, publ: 26 Jul 2016
change when the majority of lines modified were to a corresponding file type. For example, if a pull request changes 10 lines in .js (javascript) files and 5 lines in .html files, we include that pull request and classify it as a .js change. Figure 5 shows the results for the 10 most common programming language files (top) and the 10 most common non-programming language files (bottom). Each pair of bars summarizes pull requests classified as part of a programming language file extension, where the height of each bar represents the acceptance rate and each bar contains a 95% Clopper-Pearson confidence interval. An asterisk (*) next to a language indicates a statistically significant difference between men and women for that language using a chi-squared test, after a Benjamini-Hochberg correction [4] to control for false discovery. Overall, we observe that women’s acceptance rates are higher than men’s for almost every programming language. The one exception is .m, which indicates Objective-C and Matlab, for which the difference is not statistically significant.
Is a woman’s pull request accepted more often because she appears to be a woman? Another explanation as to why women’s pull requests are accepted at a higher rate would be what McLoughlin calls Type III bias: “the singling out of women by gender with the intention to help” [20]. In our context, project owners may be biased towards wanting to help women who submit pull requests, especially outsiders to the project. In contrast, male outsiders without this benefit may actually experience the opposite effect, as distrust and bias can be stronger in stranger-to-stranger interactions [19]. Thus, we expect that women who can be perceived as women are more likely to have their pull requests accepted than women whose gender cannot be easily inferred, especially when compared to male outsiders. We evaluate this hypothesis by comparing pull request acceptance rate of developers who
15
PeerJ Preprints | https://doi.org/10.7287/peerj.preprints.1733v2 | CC BY 4.0 Open Access | rec: 26 Jul 2016, publ: 26 Jul 2016
Women
Men
Acceptance Rate
90%
80%
70%
60%
.js
*
.rb
.py
*
*
.ja va
.p *
hp
*
.cp p
*
.cs
*
.c *
.ym
.rs t
.g o
*
.m
Acceptance Rate
90%
80%
70%
60%
.m
d
.h
tm
l*
.xm
l
.js o
n
.cs *
s*
.tx
t*
l
*
.m ar
kd ow n
.p od sp
ec
Figure 5: Pull request acceptance rate by file type, for programming languages (top) and nonprogramming languages (bottom) have gender-neutral GitHub profiles and those who have gendered GitHub profiles. We define a gender-neutral profile as one where a gender cannot be readily inferred from their profile. Figure 1 gives an example of a gender-neutral GitHub user, “akofink”, who uses an identicon, an automatically generated graphic, and does not have a gendered name that is apparent from the login name. Likewise, we define a gendered profile as one where the gender can be readily inferred from the image or the name. Figure 1 also gives an example of a gendered profile; the profile of “JustinAMiddleton” is gendered because it uses a login name (Justin) commonly
16
PeerJ Preprints | https://doi.org/10.7287/peerj.preprints.1733v2 | CC BY 4.0 Open Access | rec: 26 Jul 2016, publ: 26 Jul 2016
Insiders
Women
Men
Outsiders
Acceptance Rate
90%
80%
70%
60%
Gender−Neutral
Gender−Neutral
Gendered
Gendered
Figure 6: Pull request acceptance rate by gender and perceived gender, with 95% ClopperPearson confidence intervals, for insiders (left) and outsiders (right) associated with men, and because the image depicts a person with masculine features (e.g., pronounced brow ridge [5]). Clicking on a user’s name in pull requests reveals their profile, which may contain more information such as a user-selected display name (like “Justin Middleton”).
Identifiable Analysis.
To obtain a sample of gendered and gender-neutral profiles, we used a
combination of automated and manual techniques. For gendered profiles, we included GitHub users who used a profile image rather than an identicon and that Vasilescu and colleagues’ tool could confidently infer a gender from the user’s name [26]. For gender-neutral profiles, we included GitHub users that used an identicon, that the tool could not infer a gender for, and that a mixed-culture panel of judges could not guess the gender for. While acceptance rate results so far have been robust to differences between insiders (people 17
PeerJ Preprints | https://doi.org/10.7287/peerj.preprints.1733v2 | CC BY 4.0 Open Access | rec: 26 Jul 2016, publ: 26 Jul 2016
who are owners or collaborators of a project) versus outsiders (everyone else), for this analysis, there is a substantial difference between the two, so we treat each separately. Figure 6 shows the acceptance rates for men and women when their genders are identifiable versus when they are not, with pull requests submitted by insiders on the left and pull requests submitted by outsiders on the right.
Identifiable Results. For insiders, we observe little evidence of bias when we compare women with gender-neutral profiles and women with gendered profiles, since both have similar acceptance rates. This can be explained by the fact that insiders likely know each other to some degree, since they are all authorized to make changes to the project, and thus may be aware of each others’ gender. For outsiders, we see evidence for gender bias: women’s acceptance rates drop by 10.2% when their gender is identifiable, compared to when it is not (χ2 (df = 1, n = 18, 540) = 131, p < .001). There is a smaller 5.7% drop for men (χ2 (df = 1, n = 659, 560) = 103, p < .001). Women have a higher acceptance rate of pull requests overall (as we reported earlier), but when they are outsiders and their gender is identifiable, they have a lower acceptance rate than men.
Are Acceptance Rates Different If We Control for Covariates? In analyses of pull request acceptance rates up until this point, covariates other than the variable of interest (gender) may also contribute to acceptance rates. We have previously shown an imbalance in covariate distributions for men and women (e.g. number of projects contributed to and number of changes made) and this imbalance may confound the observed gender differences. In this section, we re-analyze acceptance rates while controlling for these potentially confounding covariates using propensity score matching, a technique that supports causal in-
18
PeerJ Preprints | https://doi.org/10.7287/peerj.preprints.1733v2 | CC BY 4.0 Open Access | rec: 26 Jul 2016, publ: 26 Jul 2016
ference by transforming a dataset from a non-randomized field study into a dataset that “looks closer to one that would result from a perfectly blocked (and possibly randomized) experiment” [16]. That is, by making gender comparisons between subjects having the same propensity scores, we are able to remove the confounding effects, giving stronger evidence that any observed differences are primarily due to gender bias. In short, propensity score matching works by matching data from one group to similar data in another group (in our case, men’s and women’s pull requests), then discards the data that do not match. This discarded data represent outliers, and thus the results from analyzing matched data may differ substantially from the results from analyzing the original data. The advantage of propensity score matching is that it controls for any differences we observed earlier that are caused by a measured covariate, rather than gender bias. One negative side effect of matching is that statistical power is reduced because the matched data are smaller than from the original dataset. We may also observe different results than in the larger analysis because we are excluding certain subjects from the population having atypical covariate value combinations that could influence the effects in the previous analyses. Figure 7 shows acceptance using matched data for all pull requests, for just pull requests from outsiders, and for just pull requests on projects that are open source (OSS) licenses. Asterisks (*) indicate that each difference is statistically significant using a chi-squared test, though the magnitude of the difference between men and women is smaller than for unmatched data. Figure 8 shows acceptance rates for matched data, analogous to Figure 5. We calculate statistical significance with a chi-squared test, with a Benjamini-Hochberg correction [4]. For programming languages, differences for most languages are not statistically significant, but for those that are (Ruby and Python), women’s pull requests are accepted at a higher rate. Figure 9 shows acceptance rates for matched data by pull request index, that is, for each user’s first pull request, second and third pull request, fourth through seventh pull request, and 19
PeerJ Preprints | https://doi.org/10.7287/peerj.preprints.1733v2 | CC BY 4.0 Open Access | rec: 26 Jul 2016, publ: 26 Jul 2016
Women
Men
Acceptance Rate
90%
80%
70%
60%
all *
Ou tsi
OS de
rs
S
*
*
Figure 7: Acceptance rates for men and women for all data, outsiders, and open source projects using matched data. so on. We perform chi-squared tests and Benjamini-Hochberg corrections here as well. Compared to Figure 3, most differences between genders diminish to the point of non-statistical significance. From Figure 9, we might hypothesize that the overall difference in acceptance rates between genders is due to just the first pull request. To examine this, we separate the pull request acceptance rate into: • One-Timers: Pull requests from people who only ever submit one pull request. 20
PeerJ Preprints | https://doi.org/10.7287/peerj.preprints.1733v2 | CC BY 4.0 Open Access | rec: 26 Jul 2016, publ: 26 Jul 2016
Women
Men
Acceptance Rate
90%
80%
70%
60%
.js
.rb
.py
*
.ja va
*
.p
.cp p
hp
.cs
.c
.g o
Women
.m
Men
Acceptance Rate
90%
80%
70%
60%
.m
d
.h
tm
l*
.xm
l*
.js
.tx t
on
.ym
l
.rs
t
.m ar
kd ow n
.p od sp
ec
Figure 8: Acceptance rates for men and women using matched data by file type for programming languages (top) and non-programming languages (bottom). • Regulars’ First: First pull requests from people who go on to submit other pull requests. • Regulars’ Rest: All other (second and beyond) pull requests. Figure 10 shows the results. Overall, women maintain a significantly higher acceptance rate beyond the first pull request, disconfirming the hypothesis. Figure 11 shows acceptance rate by gender and perceived gender using matched data. Here we match slightly differently, matching on identifiability (gendered, unknown, or neutral) rather than use of an identicon. For outsiders, while men and women perform similarly when their 21
PeerJ Preprints | https://doi.org/10.7287/peerj.preprints.1733v2 | CC BY 4.0 Open Access | rec: 26 Jul 2016, publ: 26 Jul 2016
Women
Men
Acceptance Rate
90%
80%
70%
60%
1−
1
2−
3
PR
s*
4−
7
PR
s
8− 15
PR
s
16
32
−3
1
PR
s
PR
−6
3
s
64 −
12
7
PR
s
PR
s
Figure 9: Pull request acceptance rate over time using matched data. genders are apparent, when their genders appear neutral, women’s acceptance rate is 6.2% higher than men’s (χ2 (df = 1, n = 2, 454) = 11, p < .01). This provides clearer evidence of gender bias than Figure 6. How has this matched analysis of the data changed our findings? Our observation about overall acceptance rates being higher for women remains, although the difference is smaller. Our observation about womens’ acceptance rates being higher than mens’ for all programming 22
PeerJ Preprints | https://doi.org/10.7287/peerj.preprints.1733v2 | CC BY 4.0 Open Access | rec: 26 Jul 2016, publ: 26 Jul 2016
Women
Men
Acceptance Rate
90%
80%
70%
60%
On
e−
Re g
Ti
Re gu lar
ula
rs '
m
er
s
Fi
rs
t
s'
Re st
*
Figure 10: Acceptance rates for men and women broken down by category. languages is more limited; instead, it is significantly higher for just two languages. Our observation that womens’ acceptance rates continue to outpace mens’ becomes less clear. Finally, our observation that outsider womens’ acceptance are higher, but only when their genders are not apparent, has become more clear.
23
PeerJ Preprints | https://doi.org/10.7287/peerj.preprints.1733v2 | CC BY 4.0 Open Access | rec: 26 Jul 2016, publ: 26 Jul 2016
Insiders
Women
Men
Outsiders
Acceptance Rate
90%
80%
70%
60%
Gender−Neutral
Gender−Neutral *
Gendered *
Gendered
Figure 11: Pull request acceptance rate by gender and perceived gender, using matched data.
Discussion Why Do Differences Exist in Acceptance Rates? To summarize this paper’s observations: 1. Women are more likely to have pull requests accepted than men. 2. Women continue to have high acceptance rates as they do pull requests on more projects. 3. Women’s pull requests are less likely to serve an documented project need. 4. Women’s changes are larger. 5. Women’s acceptance rates are higher for some programming languages.
24
PeerJ Preprints | https://doi.org/10.7287/peerj.preprints.1733v2 | CC BY 4.0 Open Access | rec: 26 Jul 2016, publ: 26 Jul 2016
6. Women outsiders’ acceptance rates are higher, but only when they are not identifiable as women. We next consider several alternative theories that may explain these observations as a whole. Given observations 1–5, one theory is that a bias against men exists, that is, a form of reverse discrimination. However, this theory runs counter to prior work (e.g., [22]), as well as observation 6. Another theory is that women are taking fewer risks than men. This theory is consistent with Byrnes’ meta-analysis of risk-taking studies, which generally find women are more risk-averse than men [7]. However, this theory is not consistent with observation 4, because women tend to change more lines of code, and changing more lines of code correlates with an increased risk of introducing bugs [21]. Another theory is that women in open source are, on average, more competent than men. This theory is consistent with observations 1–5. To be consistent with observation 6, we need to explain why women’s pull request acceptance rate drops when their gender is apparent. An addition to this theory that explains observation 6, and the anecdote described in the introduction, is that discrimination against women does exist in open source. Assuming this final theory is the best one, why might it be that women are more competent, on average? One explanation is survivorship bias: as women continue their formal and informal education in computer science, the less competent ones may change fields or otherwise drop out. Then, only more competent women remain by the time they begin to contribute to open source. In contrast, less competent men may continue. While women do switch away from STEM majors at a higher rate than men, they also have a lower drop out rate then men [8], so the difference between attrition rates of women and men in college appears small. Another explanation is self-selection bias: the average woman in open source may be better prepared than the average man, which is supported by the finding that women in open source are more 25
PeerJ Preprints | https://doi.org/10.7287/peerj.preprints.1733v2 | CC BY 4.0 Open Access | rec: 26 Jul 2016, publ: 26 Jul 2016
likely to hold Master’s and PhD degrees [2]. Yet another explanation is that women are held to higher performance standards than men, an explanation supported by Gorman and Kmec’s analysis of the general workforce [11].
Are the Differences Meaningful? We have demonstrated statistically significant differences between men’s and women’s pull request acceptance rates, such as that, overall, women’s acceptance rates are 4.1% higher than men’s. We caution the reader from interpreting too much from statistical significance; for big data studies such as this one, even small differences can be statistically significant. Instead, we encourage the reader to examine the size of the observed effects. We next examine effect size from two different perspectives. Using our own data, let us compare acceptance rate to two other factors that correlate with pull request acceptance rates. First, the slope of the lines in Figure 3, indicate that, generally, as developers become more experienced, their acceptance rates increases fairly steadily. For instance, as experience doubles from 16 to 32 pull requests for men, pull acceptance rate increases by 2.9%. Second, the larger a pull request is, the less likely it is to be accepted [13]. In our pull request data, for example, increasing the number of files changed from 10 to 20 decreases the acceptance rate by 2.0%. Using others’ data, let us compare our effect to effects reported in other studies of bias. Davison and Burke’s meta-analysis of sex discrimination found an average Pearson correlation of r = .07 between gender and job selection. In comparison, our 4.1% overall acceptance rate difference is equivalent to r = .02. Thus, the effect we have uncovered is smaller than in typical gender bias studies.
26
PeerJ Preprints | https://doi.org/10.7287/peerj.preprints.1733v2 | CC BY 4.0 Open Access | rec: 26 Jul 2016, publ: 26 Jul 2016
Conclusion In closing, as anecdotes about gender bias persist, it is imperative that we use big data to better understand the interaction between genders. While our big data study does not definitely prove that differences between gendered interactions are caused by bias among individuals, the trends observed in this paper are troubling. The frequent refrain that open source is a pure meritocracy must be reexamined.
References and Notes [1] Judd Antin, Raymond Yee, Coye Cheshire, and Oded Nov.
Gender differences in
wikipedia editing. In Proceedings of the 7th International Symposium on Wikis and Open Collaboration, pages 11–14. ACM, 2011. [2] Laura Arjona-Reina, Gregorio Robles, and Santiago Dueas. The floss2013 free/libre/open source survey, January 2014. [3] Shoba Arun and Thankom Arun. Icts, gender and development: women in software production in kerala. Journal of International Development, 14(1):39–50, 2002. [4] Yoav Benjamini and Yosef Hochberg. Controlling the false discovery rate: a practical and powerful approach to multiple testing. Journal of the royal statistical society. Series B (Methodological), pages 289–300, 1995. [5] Elizabeth BrownU and D Perrett. What gives a face its gender? Perception, 22:829–840, 1993. [6] Margaret Burnett, Scott D Fleming, Shamsi Iqbal, Gina Venolia, Vidya Rajaram, Umer Farooq, Valentina Grigoreanu, and Mary Czerwinski. Gender differences and programming
27
PeerJ Preprints | https://doi.org/10.7287/peerj.preprints.1733v2 | CC BY 4.0 Open Access | rec: 26 Jul 2016, publ: 26 Jul 2016
environments: across programming populations. In Proceedings of the 2010 ACM-IEEE International Symposium on Empirical Software Engineering and Measurement, page 28. ACM, 2010. [7] James P Byrnes, David C Miller, and William D Schafer. Gender differences in risk taking: A meta-analysis. Psychological bulletin, 125(3):367, 1999. [8] Xianglei Chen. Stem attrition: College students’ paths into and out of stem fields. statistical analysis report. nces 2014-001. National Center for Education Statistics, 2013. [9] CJ Clopper and Egon S Pearson. The use of confidence or fiducial limits illustrated in the case of the binomial. Biometrika, pages 404–413, 1934. [10] Heather K Davison and Michael J Burke. Sex discrimination in simulated employment contexts: A meta-analytic investigation. Journal of Vocational Behavior, 56(2):225–248, 2000. [11] Elizabeth H Gorman and Julie A Kmec. We (have to) try harder gender and required work effort in britain and the united states. Gender & Society, 21(6):828–856, 2007. [12] Georgios Gousios. The ghtorrent dataset and tool suite. In Proceedings of the 10th Working Conference on Mining Software Repositories, MSR ’13, pages 233–236, Piscataway, NJ, USA, 2013. IEEE Press. [13] Georgios Gousios, Martin Pinzger, and Arie van Deursen. An exploratory study of the pull-based software development model. In Proceedings of the 36th International Conference on Software Engineering, ICSE 2014, pages 345–355, New York, NY, USA, 2014. ACM.
28
PeerJ Preprints | https://doi.org/10.7287/peerj.preprints.1733v2 | CC BY 4.0 Open Access | rec: 26 Jul 2016, publ: 26 Jul 2016
[14] Georgios Gousios, Bogdan Vasilescu, Alexander Serebrenik, and Andy Zaidman. Lean ghtorrent: Github data on demand. In Proceedings of the 11th Working Conference on Mining Software Repositories, pages 384–387. ACM, 2014. [15] John W Graham and Steven A Smith. Gender differences in employment and earnings in science and engineering in the us. Economics of education review, 24(3):341–354, 2005. [16] Daniel Ho, Kosuke Imai, Gary King, and Elizabeth Stuart. Matchit: Nonparametric preprocessing for parametric causal inference. Journal of Statistical Software, 42(1):1–28, 2011. [17] Silvia Knobloch-Westerwick, Carroll J Glynn, and Michael Huge. The matilda effect in science communication an experiment on gender bias in publication quality perceptions and collaboration interest. Science Communication, 35(5):603–625, 2013. [18] Vivian Anette Lagesen. A cyberfeminist utopia? perceptions of gender and computer science among malaysian women computer science students and faculty. Science, technology & human values, 33(1):5–27, 2008. [19] Frank J Landy. Stereotypes, bias, and personnel decisions: Strange and stranger. Industrial and Organizational Psychology, 1(4):379–392, 2008. [20] Lisa A McLoughlin. Spotlighting: Emergent gender bias in undergraduate engineering education. Journal of Engineering Education, 94(4):373–381, 2005. [21] Audris Mockus and David M Weiss. Predicting risk of software changes. Bell Labs Technical Journal, 5(2):169–180, 2000. [22] Dawn Nafus. ‘patches don’t have gender’: What is not open in open source software. New Media & Society, 14(4):669–683, 2012. 29
PeerJ Preprints | https://doi.org/10.7287/peerj.preprints.1733v2 | CC BY 4.0 Open Access | rec: 26 Jul 2016, publ: 26 Jul 2016
[23] Brian A Nosek, Mahzarin Banaji, and Anthony G Greenwald. Harvesting implicit group attitudes and beliefs from a demonstration web site. Group Dynamics: Theory, Research, and Practice, 6(1):101, 2002. [24] Joseph Reagle. free as in sexist? free culture and the gender gap. First Monday, 18(1), 2012. [25] Philip L Roth, Kristen L Purvis, and Philip Bobko. A meta-analysis of gender group differences for measures of job performance in field studies. Journal of Management, 38(2):719–739, 2012. [26] Bogdan Vasilescu, Andrea Capiluppi, and Alexander Serebrenik. Gender, representation and online participation: A quantitative study. Interacting with Computers, 26(5):488– 511, 2014. [27] Bogdan Vasilescu, Daryl Posnett, Baishakhi Ray, Mark G. J. van den Brand, Alexander Serebrenik, Premkumar Devanbu, and Vladimir Filkov. Gender and tenure diversity in GitHub teams. In CHI Conference on Human Factors in Computing Systems, CHI, pages 3789–3798. ACM, 2015.
30
PeerJ Preprints | https://doi.org/10.7287/peerj.preprints.1733v2 | CC BY 4.0 Open Access | rec: 26 Jul 2016, publ: 26 Jul 2016
Acknowledgments Special thanks to Denae Ford for her help throughout this research project. Thanks to the Developer Liberation Front for their reviews of this paper. For their helpful discussions, thanks to Tiffany Barnes, Margaret Burnett, Tim Chevalier, Julien Couvreur, Prem Devanbu, Ciera Jaspan, Saul Jaspan, David Jones, Jeff Leiter, Ben Livshits, Titus von der Malsburg Peter Rigby, David Strauss, Bogdan Vasilescu, and Mikael Vejdemo-Johansson. This material is based in part upon work supported by the National Science Foundation under grant number 1252995.
Materials and Methods GitHub Scraping An initial analysis of GHTorrent pull requests showed that our pull request merge rate was significantly lower than that presented in prior work on pull requests [13]. We found a solution to the problem that calculated pull request status using a different technique, which yielded a pull request merge rate comparable to prior work. However, in a manual inspection of pull requests, we noticed that several calculated pull request statuses were different than the statuses indicated on the github.com website. As a consequence, we wrote a web scraping tool that automatically downloaded the pull request HTML pages, parsed them, and extracted data on status, pull request message, and comments on the pull request. We determined whether a pull requester was an insider or an outsider during our scraping process because the data was not available in the GHTorrent dataset. We classified a user as an insider when the pull request listed the person as a member or owner, and classified them as an outsider otherwise. This analysis has inaccuracies because GitHub users can change roles from outsider to insider and vice-versa. As an example, about 5.9% of merged pull requests from both outsider female and male users were merged by the outsider pull-requester themselves,
31
PeerJ Preprints | https://doi.org/10.7287/peerj.preprints.1733v2 | CC BY 4.0 Open Access | rec: 26 Jul 2016, publ: 26 Jul 2016
which is not possible, since outsiders by definition do not have the authority to self-merge. We emailed such an outsider, who indicated that, indeed, she was an insider when she made that pull request. This problem is presently unavoidable as GitHub does not keep data on role changes.
Gender Linking To evaluate gender bias on GitHub, we first needed to determine the genders of GitHub users. Our technique uses several steps to determine the genders of GitHub users. First, from the GHTorrent data set, we extract the email addresses of GitHub users. Second, for each email address, we use the search engine in the Google+ social network to search for users with that email address. The search works for both Google users’ email addresses (@gmail.com), as well as other email addresses (such as @ncsu.edu). Third, we parse the returned users’ ‘About’ page to scrape their gender. Finally, we only include the genders ‘Male’ and ‘Female’ because there were relatively few other options chosen. We also automated and parallelized this process. This technique capitalizes on several properties of the Google+ social network. First, if a Google+ user signed up for the social network using an email address, the search results for that email address will return just that user, regardless of whether that email address is publicly listed or not. Second, signing up for a Google account currently requires you to specify a gender (though ‘Other’ is an option)5 , and, in our discussion, we interpret their use of ‘Male’ and ‘Female’ in gender identification (rather than sex) as corresponding to our use of the terms ‘man’ and ‘woman’. Third, when Google+ was originally launched, gender was publicly visible by default.6 5
https://accounts.google.com/SignUp http://latimesblogs.latimes.com/technology/2011/07/google-plus-users-will-soon-be-able html 6
32
PeerJ Preprints | https://doi.org/10.7287/peerj.preprints.1733v2 | CC BY 4.0 Open Access | rec: 26 Jul 2016, publ: 26 Jul 2016
Merged Pull Requests Throughout this study, we measure pull requests that are accepted by calculating developers’ merge rates, that is, the number of pull requests merged divided by the sum of the number of pull requests merged, closed, and still open. We include pull requests still open in the denominator in this calculation because pull requests that are still open could be indicative of a pull requester being ignored, which has the same practical impact as rejection.
Project Licensing To determine whether a project uses an open source license, we used an experimental GitHub API that uses heuristics to determine a project’s license.7 We classified a project (and thus the pull request on that project) as open source if the API reported a license that the Open Source Initiative considers in compliance with the Open Source Definition,8 which were afl-3.0, agpl3.0, apache-2.0, artistic-2.0, bsd-2-clause, bsd-3-clause, epl-1.0, eupl-1.1, gpl-2.0, gpl-3.0, isc, lgpl-2.1, lgpl-3.0, mit, mpl-2.0, ms-pl, ms-rl, ofl-1.1, and osl-3.0. Projects were not considered open source if the API did not return a license for a project, or the license was bsd-3-clauseclear, cc-by-4.0, cc-by-sa-4.0, cc0-1.0, other, unlicense, or wtfpl.
Determining Gender Neutral and Gendered Profiles To determine gendered profiles, we first parsed GitHub profile pages to determine whether each user was using a profile image or an identicon. Of the users who performed at least one pull request, 213,882 used a profile image and 104,648 used an identicon. We then ran display names and login names through a gender inference program, which maps a name to a gender.9 . 7
https://developer.github.com/v3/licenses/ https://opensource.org/licenses 9 This tool was builds on Vasilescu and colleagues’ tool [26], but we removed some of Vasilescu and colleagues’ heuristics to be more conservative. Our version of the tool can be found here: https://github. com/DeveloperLiberationFront/genderComputer 8
33
PeerJ Preprints | https://doi.org/10.7287/peerj.preprints.1733v2 | CC BY 4.0 Open Access | rec: 26 Jul 2016, publ: 26 Jul 2016
We classified a GitHub profile as gendered if each of the following were true: • a profile image (rather than an identicon) was used, and • the gender inference tool output a gender at the highest level of confidence (that is, ‘male’ or ‘female,’ rather than ‘mostly male,’ ‘mostly female,’ or ‘unknown’). To classify profiles as gender neutral, we added a manual step. Given a GitHub profile that used an identicon (thus, a gender could not be inferred from a profile image) and a name that the gender inference tool classified as ‘unknown’, we manually verified that the profile could not be easily identified as belonging to a specific gender. We did this in two phases. In the first phase, we assembled a panel of 3 people to evaluate profiles for 10 seconds each. The panelists were of American (man), Chinese (man), and Indian (woman) origin, representative of the three most common nationalities on GitHub. We used different nationalities because we wanted the panel to be able to identify, if possible, the genders of GitHub usernames with different cultural origins. In the second phase, we eliminated two inefficiencies from the first phase: (a) because the first panel estimated that for 99% of profiles, they only looked at login names and display names, we only showed this information to the second panel, and (b) because the first panel found 10 seconds was usually more time than was necessary to assess gender, we allowed panelists at the second phase to assess names at their own pace. Across both phases, panelists were instructed to signal if they could identify the gender of the GitHub profile. To estimate panelists’ confidence, we considered using a threshold like “90% confident of the gender,” but found that this was too ambiguous in pilot panels. Instead, we instructed panelists to signal if they would be comfortable addressing the GitHub user as ‘Mister’ or ‘Miss’ in an email, given the only thing they knew about the user was their profile. We considered a GitHub profile as gender neutral if all of the following conditions were met: • an identicon (rather than a profile image) was used, 34
PeerJ Preprints | https://doi.org/10.7287/peerj.preprints.1733v2 | CC BY 4.0 Open Access | rec: 26 Jul 2016, publ: 26 Jul 2016
• the gender inference tool output a ‘unknown’ for the user’s login name and display name, and • none of the panelists indicated that they could identify the user’s gender. Across both panels, panelists inspected 3000 profiles of roughly equal numbers of women and men. We chose the number 3000 by doing a rough statistical power analysis using the results of the first panel to determine how many profiles panelists should inspect during the second panel to obtain statistically significant results. Of the 3000, panelists eliminated 409 profiles for which at least one panelist could infer a gender.
Matching Proceedure In our analysis, we used men as the control group and women as the treatment group. We treated each pull request as a data point. The covariates we matched were number of lines added, number of lines removed, number of commits, number of files changed, pull index (the creator’s nth pull request), number of references to issues, license (open source or not), creator type (insider or outsider), file extension, and whether the pull requester used an identicon. We excluded pull requests for which we were missing data for any covariate. We used the R library MatchIt [16]. Although MatchIt offers a variety of matching techniques, such as full matching and nearest neighbor, we found that only the exact matching technique completed the matching process, due to our large number of covariates and data points. With exact matching, each data point in the treatment group must match exactly with one or more data points in the control group. This presents a problem for covariates with wide distributions (such as lines of code) because it severely restricts the technique’s ability to find matches. For instance, if a woman made a pull request with 700 lines added and a man made a pull request with 701 lines added that was otherwise identical (same number of lines removed,
35
PeerJ Preprints | https://doi.org/10.7287/peerj.preprints.1733v2 | CC BY 4.0 Open Access | rec: 26 Jul 2016, publ: 26 Jul 2016
same file extension, and so on), these two data points would not be matched and excluded from further analysis. Consequently, we pre-processed each numerical variable into the floor of the log2 of it. Thus, for example, both 700 and 701 are transformed into 5, and thus can be exactly matched. After exact matching, the means of all covariates are balanced, that is, their weighted means are equal across genders. Raw numerical data, since we transformed it, is not perfectly balanced, but is substantially more balanced than the original data; each covariate showed a 96% or better balance improvement.
Missing Data In some cases, data were missing when we scraped the web to obtain data to supplement the GHTorrent data. We describe how we dealt with these data here. First, information on file types was missing for pull requests that added or deleted more than 1000 lines. The problem was that, for efficiency, GitHub does not include file type data on initial page response payloads for large changes, for efficiency reasons. This missing data affects the results of the file type analysis and the propensity score matching analysis; in both cases, pull requests of over 1000 lines added or deleted are excluded. Second, when retrieving GitHub user images, we occasionally received abnormal server response errors, typically in the form of HTTP 404 errors. Thus, we were unable to determine if the user used a profile image or identicon in 10,458 (3.2% of users and 1.98% of pull requests). We excluded these users and pull requests when analyzing data on gendered users. Third, when retrieving GitHub pull request web pages, we occasionally received abnormal server responses as well. In these cases, we were unable to obtain data on the size of the change (lines added, files changed, etc.), the state (closed, merged, or open), the file type, or the user who merged or closed it, if any. This data comprises 5.15% of pull requests for which we had
36
PeerJ Preprints | https://doi.org/10.7287/peerj.preprints.1733v2 | CC BY 4.0 Open Access | rec: 26 Jul 2016, publ: 26 Jul 2016
genders of the pull request creator. These pull requests are excluded from all analyses.
Threats One threat to this analysis is that additional covariates, including ones that we could not collect, may influence acceptance rate. One example is programming experience outside of GitHub. Two covariates we collected, but did not control for, is the project the pull request is made to and the developer deciding on the pull request. We did not control for these covariates because we reasoned that it would discard too many data points during matching. Another threat to this analysis is the existence of robots that interact with pull requests. For example, “Snoopy Crime Cop”10 appears to be a robot that has made thousands of pull requests. If such robots used an email address that linked to a Google profile that listed a gender, our merge rate calculations might be skewed unduly. To check for this possibility, we examined profiles of GitHub users that we have genders for and who have made more than 1000 pull requests. The result was tens of GitHub users, none of whom appeared to be a robot. So in terms of our merge calculation, we are somewhat confident that robots are not substantially influencing the results. Another threat is if men and women misrepresent their genders at different rates. In that case, we may have inaccurately labeled some men on GitHub as women, and vice-versa. Another threat is GitHub developers’ use of aliases [27]; the same person may appear as multiple GitHub users. Each alias artificially inflates the number of developers shown in the histograms in Figure 2. Most pull request-level analysis, which represents most of the anlayses performed in this paper, are unaffected by aliases that use the same email address. Another threat is inaccuracies in our assessment of whether a GitHub member’s gender is identifiable. For profiles we labeled as gender-neutral, our panel may not have picked out subtle 10
https://github.com/snoopycrimecop
37
PeerJ Preprints | https://doi.org/10.7287/peerj.preprints.1733v2 | CC BY 4.0 Open Access | rec: 26 Jul 2016, publ: 26 Jul 2016
gender features in GitHub users’ profiles. Moreover, project owners may have used gender signals that we did not; for example, if a pull requester sends an email to a project owner, the owner may be able to identify the requester’s gender even though our technique could not. Another threat is that of construct validity, whether we are measuring what we aim to measure. One example is our inclusion of “open” pull requests as a sign of rejection, in addition to the “closed” status. Rather than a sign of rejection, open pull requests may simply have not yet been decided upon. Another example is whether pull requests that do not link to issues signals that the pull request does not fulfill an documented need. Another threat is that of external validity; do the results generalize beyond the population studied? While we chose GitHub because it is the largest open source community, other communities such as SourceForge and BitBucket exist, along with other ways to make pull requests, such at through the git version control system directly. Moreover, while we studied a large population of contributors, they represent only part of the total population of developers on GitHub, because not every developer makes their email address public, because not every email address corresponds to a Google+ profile, and because not every Google+ profile lists gender. To understand this threat, Tables 1 and 2 compare GitHub users who we could link to Google+ accounts (the data we used in this paper) against those who do not have Google+ accounts. The top 3 rows are the main ones of interest. In Table 1, we use an exclusively GHTorrent-based calculation of acceptance rate where a pull request is considered accepted if its commit appears in the commit history of the project; we use a different measure of acceptance rate here because we did not parse pull requests made by people not on Google+. In terms of acceptance rate, users not on Google+ have a lower acceptance rate than both males and females on Google+. In terms of number of unique projects contributed to, users not on Google+ contribute to about the same number as men on Google+. A final threat to this research is our own biases as researchers, which may have influenced 38
PeerJ Preprints | https://doi.org/10.7287/peerj.preprints.1733v2 | CC BY 4.0 Open Access | rec: 26 Jul 2016, publ: 26 Jul 2016
Gender Category User not on Google+ User identifies as ‘Male’ on Google+ User identifies as ‘Female’ on Google+ User has no gender listed on Google+ User lists ‘Declined to State’ for gender on Google+ User lists other gender on Google+
Users
Pull Requests
Acceptance Rate
95% Confidence Interval
325,100
3,047,071
71.5%
[71.44%,71.54%]
312,909
3,168,365
74.2%
[74.17%,74.27%]
21,510
156,589
79.9%
[79.69%,80.09%]
20,024
194,837
74.3%
[74.09%,74.48%]
7,484
81,632
73.1%
[72.8%,73.41%]
159
1,339
73.9%
[71.5%,76.27%]
Table 1: Acceptance rates for GitHub users not linked to Google+ (top row) versus those who are linked (bottom rows), by stated gender. Right three columns indicate the percentiles of the number of projects contributed to. the results. While it is difficult to control for implicit bias, we can explicitly state what our biases are, and the reader can interpret the findings in that context. First, prior to conducting this research, all researchers on the team did believe that gender bias exists in open source communities, based on personal experience, news articles, and published research. However, none knew how widespread it was, or whether that bias could be detected in pull requests. Second, all researchers took Nosek and colleagues’ online test for implicit bias that evaluates a person’s implicit associations between males and females, and work and family [23]. As is typical with most test takers, most authors tended to associate males with work and females with family (Kofink: strong; Murphy-Hill, Parnin, and Stallings: moderate; Terrell and Rainear: slight). The exception was Middleton, who exhibits a moderate association of female with career and male with family.
39
PeerJ Preprints | https://doi.org/10.7287/peerj.preprints.1733v2 | CC BY 4.0 Open Access | rec: 26 Jul 2016, publ: 26 Jul 2016
Gender Category User not on Google+ User identifies as ‘Male’ on Google+ User identifies as ‘Female’ on Google+ User has no gender listed on Google+ User lists ‘Declined to State’ for gender on Google+ User lists other gender on Google+
Users
Pull Requests
50%
75%
90%
325,100
3,047,071
1.00
3.00
6.00
312,909
3,168,365
1.00
3.00
7.00
21,510
156,589
1.00
2.00
4.00
20,024
194,837
1.00
3.00
7.00
7,484
81,632
1.00
3.00
7.00
159
1,339
2.00
4.00
7.20
Table 2: Percentiles of the number of projects contributed to for GitHub users not linked to Google+ (top row) versus those who are linked (bottom rows), by stated gender.
Figure Data Here we include raw data that were used in the figures. Data from Figure 2. For women: y xmin xmax 0.04 0.00 0.10 0.02 0.10 0.20 0.01 0.20 0.30 0.04 0.30 0.40 0.04 0.40 0.50 0.06 0.50 0.60 0.08 0.60 0.70 0.14 0.70 0.80 0.19 0.80 0.90 0.38 0.90 1.00 For men:
40
PeerJ Preprints | https://doi.org/10.7287/peerj.preprints.1733v2 | CC BY 4.0 Open Access | rec: 26 Jul 2016, publ: 26 Jul 2016
y 0.02 0.03 0.02 0.06 0.08 0.10 0.12 0.17 0.17 0.24
xmin 0.00 0.10 0.20 0.30 0.40 0.50 0.60 0.70 0.80 0.90
xmax 0.10 0.20 0.30 0.40 0.50 0.60 0.70 0.80 0.90 1.00
41
PeerJ Preprints | https://doi.org/10.7287/peerj.preprints.1733v2 | CC BY 4.0 Open Access | rec: 26 Jul 2016, publ: 26 Jul 2016
Data from Figure 3: gender Women Men Women Men Women Men Women Men Women Men Women Men Women Men Women Men Women Men Women Men Women Men Women Men Women Men Women Men Women Men Women Men Women Men Women Men Women Men
index 1 1 2 2 3 3 4 4 5 5 6 6 7 7 8 8 9 9 10 10 11 11 12 12 13 13 14 14 15 15 16 16 17 17 18 18 19 19
avg acceptance rate 0.6760892 0.6160319 0.7050353 0.6405913 0.7190213 0.6569279 0.7329411 0.6688600 0.7460979 0.6794739 0.7525368 0.6882366 0.7588315 0.6959290 0.7637902 0.7024134 0.7717241 0.7073456 0.7788235 0.7123735 0.7818047 0.7166350 0.7855369 0.7204466 0.7891739 0.7238599 0.7929914 0.7281115 0.7950017 0.7315838 0.7993072 0.7346437 0.8017152 0.7370609 0.8015990 0.7399629 0.8047021 0.7428781
users 18484 280204 10347 179849 7425 137040 5973 111860 5022 94727 4404 82240 3887 72847 3480 65242 3111 59215 2831 54319 2569 50089 2369 46382 2229 43075 2074 40265 1953 37881 1804 35576 1713 33537 1635 31796 1557 30133
lower 0.6692886 0.6142281 0.6961433 0.6383687 0.7086457 0.6544074 0.7215255 0.6660933 0.7338198 0.6764913 0.7395133 0.6850580 0.7450628 0.6925739 0.7493161 0.6988885 0.7565628 0.7036625 0.7630742 0.7085464 0.7653223 0.7126661 0.7684496 0.7163379 0.7716415 0.7196112 0.7749050 0.7237368 0.7764047 0.7270905 0.7800678 0.7300226 0.7820324 0.7323140 0.7814288 0.7351038 0.7841229 0.7379036
upper 0.6828344 0.6178332 0.7138117 0.6428094 0.7292248 0.6594417 0.7441288 0.6716180 0.7580893 0.6824455 0.7652247 0.6914018 0.7722101 0.6992686 0.7778198 0.7059202 0.7863728 0.7110084 0.7939943 0.7161779 0.7976422 0.7205787 0.8019151 0.7245276 0.8059427 0.7280784 0.8102458 0.7324532 0.8127086 0.7360415 0.8175681 0.7392265 0.8203586 0.7417666 0.8206802 0.7447780 0.8241253 0.7478058
42
PeerJ Preprints | https://doi.org/10.7287/peerj.preprints.1733v2 | CC BY 4.0 Open Access | rec: 26 Jul 2016, publ: 26 Jul 2016
Women Men Women Men Women Men Women Men Women Men Women Men Women Men Women Men Women Men Women Men Women Men Women Men Women Men Women Men Women Men Women Men Women Men Women Men Women Men Women Men Women
20 20 21 21 22 22 23 23 24 24 25 25 26 26 27 27 28 28 29 29 30 30 31 31 32 32 33 33 34 34 35 35 36 36 37 37 38 38 39 39 40
0.8015455 0.7443410 0.8049968 0.7467274 0.8078371 0.7483787 0.8093061 0.7499043 0.8112631 0.7511206 0.8114060 0.7534511 0.8136305 0.7548082 0.8130176 0.7564985 0.8119847 0.7581168 0.8133727 0.7597981 0.8162735 0.7610487 0.8156315 0.7627928 0.8169897 0.7636369 0.8192583 0.7651109 0.8156378 0.7663505 0.8124301 0.7673967 0.8130689 0.7681725 0.8153324 0.7693243 0.8147635 0.7704708 0.8185874 0.7714715 0.8199676
1494 28576 1425 27244 1357 25959 1303 24802 1258 23755 1202 22820 1156 21895 1120 21078 1069 20318 1033 19573 989 18847 955 18207 908 17596 874 16972 850 16462 803 15947 782 15453 749 15000 723 14537 702 14119 668
0.7804025 0.7392410 0.7834547 0.7415189 0.7858479 0.7430529 0.7869035 0.7444654 0.7885247 0.7455708 0.7881237 0.7478051 0.7899626 0.7490535 0.7889255 0.7506455 0.7872477 0.7521673 0.7882489 0.7537494 0.7907034 0.7548940 0.7895534 0.7565450 0.7902737 0.7572879 0.7921127 0.7586584 0.7879020 0.7598094 0.7836783 0.7607596 0.7839433 0.7614365 0.7856532 0.7624976 0.7844900 0.7635466 0.7880490 0.7644547 0.7886895
0.8214959 0.7493913 0.8252735 0.7518832 0.8284842 0.7536487 0.8303038 0.7552846 0.8325364 0.7566088 0.8331534 0.7590325 0.8356901 0.7604953 0.8354526 0.7622807 0.8349904 0.7639923 0.8366961 0.7657696 0.8399444 0.7671228 0.8397460 0.7689566 0.8416302 0.7698987 0.8442310 0.7714723 0.8411644 0.7727974 0.8388658 0.7739362 0.8398106 0.7748075 0.8425028 0.7760464 0.8424415 0.7772866 0.8464186 0.7783763 0.8483861
43
PeerJ Preprints | https://doi.org/10.7287/peerj.preprints.1733v2 | CC BY 4.0 Open Access | rec: 26 Jul 2016, publ: 26 Jul 2016
Men Women Men Women Men Women Men Women Men Women Men Women Men Women Men Women Men Women Men Women Men Women Men Women Men Women Men Women Men Women Men Women Men Women Men Women Men Women Men Women Men
40 41 41 42 42 43 43 44 44 45 45 46 46 47 47 48 48 49 49 50 50 51 51 52 52 53 53 54 54 55 55 56 56 57 57 58 58 59 59 60 60
0.7725769 0.8199978 0.7727975 0.8195750 0.7734144 0.8232254 0.7738906 0.8238081 0.7745111 0.8241885 0.7755378 0.8263839 0.7764389 0.8279574 0.7767706 0.8265993 0.7779866 0.8276313 0.7778456 0.8326880 0.7788493 0.8291343 0.7794244 0.8291512 0.7808134 0.8280056 0.7814607 0.8277863 0.7820142 0.8296065 0.7823689 0.8264406 0.7830378 0.8288772 0.7824771 0.8324038 0.7833750 0.8354096 0.7830861 0.8343453 0.7835263
13744 643 13372 635 12934 621 12580 613 12268 591 11906 568 11611 546 11298 534 11014 513 10769 501 10468 486 10262 481 10009 463 9797 454 9597 441 9404 421 9196 408 8986 395 8780 381 8612 374 8434
0.7654755 0.7880772 0.7655990 0.7874147 0.7661002 0.7909009 0.7664781 0.7912942 0.7670106 0.7910547 0.7679345 0.7926779 0.7687489 0.7936318 0.7689772 0.7917686 0.7701067 0.7921092 0.7698734 0.7970646 0.7707742 0.7926650 0.7712747 0.7924783 0.7725777 0.7904842 0.7731435 0.7898476 0.7736167 0.7911994 0.7738891 0.7868143 0.7744702 0.7887544 0.7738005 0.7918433 0.7746081 0.7942855 0.7742285 0.7927139 0.7745804
0.7795628 0.8489458 0.7798771 0.8487288 0.7806054 0.8524387 0.7811761 0.8531638 0.7818810 0.8540408 0.7830062 0.8566498 0.7839901 0.8586846 0.7844212 0.8577650 0.7857194 0.8593237 0.7856673 0.8643261 0.7867690 0.8615387 0.7874153 0.8617159 0.7888854 0.8612718 0.7896103 0.8613871 0.7902402 0.8635200 0.7906735 0.8614028 0.7914258 0.8641479 0.7909702 0.8678943 0.7919536 0.8712249 0.7917518 0.8705845 0.7922759
44
PeerJ Preprints | https://doi.org/10.7287/peerj.preprints.1733v2 | CC BY 4.0 Open Access | rec: 26 Jul 2016, publ: 26 Jul 2016
Women Men Women Men Women Men Women Men Women Men Women Men Women Men Women Men Women Men Women Men Women Men Women Men Women Men Women Men Women Men Women Men Women Men Women Men Women Men Women Men Women
61 61 62 62 63 63 64 64 65 65 66 66 67 67 68 68 69 69 70 70 71 71 72 72 73 73 74 74 75 75 76 76 77 77 78 78 79 79 80 80 81
0.8361843 0.7838079 0.8370162 0.7856078 0.8345538 0.7860959 0.8341767 0.7858930 0.8343326 0.7859420 0.8317838 0.7864083 0.8303346 0.7864833 0.8304330 0.7869328 0.8324168 0.7864303 0.8344468 0.7866845 0.8344045 0.7868372 0.8321266 0.7874045 0.8326805 0.7874954 0.8279765 0.7881556 0.8291681 0.7884296 0.8293336 0.7891249 0.8299025 0.7892692 0.8292627 0.7896568 0.8273422 0.7895738 0.8283849 0.7891862 0.8267307
362 8300 351 8112 334 7954 325 7793 318 7596 312 7468 302 7291 296 7178 290 7019 287 6920 284 6785 287 6690 272 6551 270 6430 265 6335 262 6221 250 6119 246 6012 241 5932 233 5844 231
0.7939563 0.7747929 0.7941378 0.7765135 0.7902743 0.7769174 0.7891936 0.7766154 0.7888205 0.7765434 0.7855667 0.7769351 0.7831521 0.7768949 0.7827341 0.7772749 0.7843542 0.7766535 0.7862928 0.7768407 0.7859657 0.7768965 0.7837605 0.7774013 0.7829072 0.7773861 0.7775657 0.7779608 0.7783425 0.7781616 0.7782017 0.7787732 0.7774768 0.7788323 0.7763039 0.7791323 0.7735918 0.7789755 0.7737164 0.7784999 0.7716391
0.8728065 0.7926233 0.8740949 0.7944964 0.8727793 0.7950642 0.8729422 0.7949563 0.8734847 0.7951207 0.8715675 0.7956573 0.8708968 0.7958421 0.8713728 0.7963572 0.8735348 0.7959687 0.8755378 0.7962862 0.8757052 0.7965308 0.8734805 0.7971565 0.8750345 0.7973482 0.8710217 0.7980885 0.8724581 0.7984313 0.8728381 0.7992047 0.8743130 0.7994296 0.8740898 0.7998995 0.8728390 0.7998864 0.8744826 0.7995830 0.8732211
45
PeerJ Preprints | https://doi.org/10.7287/peerj.preprints.1733v2 | CC BY 4.0 Open Access | rec: 26 Jul 2016, publ: 26 Jul 2016
Men Women Men Women Men Women Men Women Men Women Men Women Men Women Men Women Men Women Men Women Men Women Men Women Men Women Men Women Men Women Men Women Men Women Men Women Men Women Men Women Men
81 82 82 83 83 84 84 85 85 86 86 87 87 88 88 89 89 90 90 91 91 92 92 93 93 94 94 95 95 96 96 97 97 98 98 99 99 100 100 101 101
0.7892257 0.8257364 0.7905467 0.8244285 0.7904742 0.8248941 0.7902548 0.8225989 0.7922640 0.8213745 0.7912750 0.8222069 0.7913031 0.8177248 0.7912294 0.8176426 0.7906924 0.8138759 0.7913450 0.8138972 0.7924532 0.8132713 0.7927282 0.8169674 0.7929837 0.8179654 0.7928731 0.8217093 0.7933051 0.8208033 0.7936025 0.8199880 0.7946616 0.8217064 0.7946537 0.8190445 0.7957751 0.8246681 0.7946821 0.8245670 0.7955189
5751 232 5639 225 5582 221 5509 215 5442 216 5335 210 5272 204 5199 199 5082 196 5047 190 4957 186 4871 184 4797 183 4720 179 4662 179 4593 172 4536 170 4480 169 4436 160 4386 157 4324
0.7784522 0.7706818 0.7796883 0.7683010 0.7795580 0.7682480 0.7792609 0.7648533 0.7812382 0.7636605 0.7801182 0.7636604 0.7800789 0.7577879 0.7799234 0.7568625 0.7792438 0.7522159 0.7798684 0.7511608 0.7808920 0.7497244 0.7810683 0.7533987 0.7812372 0.7543021 0.7810266 0.7576353 0.7813921 0.7566360 0.7816042 0.7542812 0.7826080 0.7557462 0.7825229 0.7525858 0.7836063 0.7567370 0.7824194 0.7558934 0.7831840
0.7997050 0.8722545 0.8011037 0.8717855 0.8010860 0.8725943 0.8009405 0.8712114 0.8029755 0.8700345 0.8021122 0.8714103 0.8022039 0.8681771 0.8022075 0.8686975 0.8018061 0.8657803 0.8024837 0.8665630 0.8036691 0.8665479 0.8040362 0.8700247 0.8043726 0.8710241 0.8043562 0.8748041 0.8048496 0.8740237 0.8052264 0.8743231 0.8063347 0.8760939 0.8063991 0.8739609 0.8075533 0.8801694 0.8065511 0.8805722 0.8074533
46
PeerJ Preprints | https://doi.org/10.7287/peerj.preprints.1733v2 | CC BY 4.0 Open Access | rec: 26 Jul 2016, publ: 26 Jul 2016
Women Men Women Men Women Men Women Men Women Men Women Men Women Men Women Men Women Men Women Men Women Men Women Men Women Men Women Men Women Men Women Men Women Men Women Men Women Men Women Men Women
102 102 103 103 104 104 105 105 106 106 107 107 108 108 109 109 110 110 111 111 112 112 113 113 114 114 115 115 116 116 117 117 118 118 119 119 120 120 121 121 122
0.8217492 0.7949741 0.8199267 0.7957856 0.8204773 0.7956220 0.8210897 0.7966794 0.8196439 0.7967403 0.8199753 0.7969661 0.8178260 0.7976275 0.8278513 0.7973731 0.8260814 0.7973383 0.8257761 0.7980455 0.8338149 0.7986930 0.8377800 0.7986873 0.8371430 0.7981363 0.8352116 0.7977243 0.8375241 0.7969764 0.8382467 0.7988082 0.8383052 0.7990702 0.8374472 0.7996992 0.8337159 0.7994452 0.8331026 0.7998138 0.8330852
154 4274 152 4233 145 4183 144 4132 143 4052 140 4007 141 3961 134 3916 130 3869 132 3805 128 3754 122 3703 121 3652 119 3594 121 3572 118 3525 117 3513 114 3452 111 3417 109 3383 109
0.7520102 0.7825539 0.7494705 0.7833212 0.7481767 0.7830779 0.7485733 0.7840790 0.7466790 0.7840142 0.7461647 0.7841719 0.7440740 0.7847719 0.7531010 0.7844361 0.7498115 0.7843202 0.7501324 0.7849314 0.7578198 0.7855026 0.7601727 0.7854037 0.7590819 0.7847449 0.7561408 0.7842126 0.7595132 0.7834045 0.7591919 0.7851868 0.7588678 0.7854312 0.7566895 0.7859519 0.7511982 0.7856195 0.7496297 0.7859258 0.7496099
0.8786849 0.8069899 0.8774841 0.8078405 0.8792185 0.8077519 0.8799234 0.8088589 0.8788932 0.8090371 0.8797548 0.8093259 0.8777461 0.8100425 0.8875503 0.8098647 0.8869143 0.8099058 0.8862368 0.8107001 0.8937351 0.8114167 0.8982917 0.8114977 0.8979985 0.8110488 0.8968869 0.8107500 0.8983088 0.8100605 0.8995871 0.8119321 0.8998700 0.8122097 0.8999005 0.8129370 0.8976432 0.8127566 0.8976730 0.8131817 0.8976590
47
PeerJ Preprints | https://doi.org/10.7287/peerj.preprints.1733v2 | CC BY 4.0 Open Access | rec: 26 Jul 2016, publ: 26 Jul 2016
Men Women Men Women Men Women Men Women Men Women Men Women Men Data from Figure 4: gender repos Women 1 Men 1 Women 2 Men 2 Women 3 Men 3 Women 4 Men 4 Women 5 Men 5 Women 6 Men 6 Women 7 Men 7 Women 8 Men 8 Women 9 Men 9 Women 10 Men 10
122 123 123 124 124 125 125 126 126 127 127 128 128
0.7988653 0.8332757 0.7999253 0.8323862 0.7995698 0.8327743 0.7998064 0.8308811 0.7996539 0.8303868 0.7988979 0.8303200 0.7992543
accept users 0.6795875 12672 0.6297586 146770 0.6950743 3019 0.6443411 50693 0.7191161 1282 0.6529540 25763 0.7226252 678 0.6586880 15352 0.7348727 418 0.6676392 10473 0.7377373 252 0.6792418 7555 0.7156170 165 0.6776849 5500 0.7158760 146 0.6829547 4265 0.7221513 111 0.6823148 3341 0.7413723 83 0.6941974 2765
3349 108 3307 106 3268 106 3239 104 3200 103 3170 103 3122
lower 0.6713829 0.6272823 0.6783032 0.6401558 0.6936410 0.6471048 0.6872680 0.6511255 0.6897933 0.6585241 0.6788436 0.6685827 0.6402858 0.6651506 0.6354011 0.6687506 0.6291047 0.6662237 0.6335540 0.6766439
0.7848817 0.7493790 0.7858766 0.7474561 0.7854263 0.7478962 0.7856037 0.7448058 0.7853585 0.7437619 0.7845141 0.7436862 0.7847660
0.8123251 0.8980804 0.8134416 0.8979108 0.8131752 0.8982230 0.8134656 0.8972640 0.8133994 0.8971552 0.8127281 0.8971015 0.8131797
upper 0.6877096 0.6322298 0.7114665 0.6485099 0.7435824 0.6587687 0.7560314 0.6661902 0.7765913 0.6766610 0.7909441 0.6897624 0.7830244 0.6900304 0.7873663 0.6969079 0.8029734 0.6980863 0.8313090 0.7113389
48
PeerJ Preprints | https://doi.org/10.7287/peerj.preprints.1733v2 | CC BY 4.0 Open Access | rec: 26 Jul 2016, publ: 26 Jul 2016
Data from Figure 5: gender Female Male Female Male Male Female Female Male Female Male Female Male Male Female Female Male Female Male Female Male Female Male Female Male Female Male Female Male Male Female Female Male Male Female Male Female Male Female
pulls 642 39909 1872 60571 41996 1295 4342 39899 777 30776 10847 100477 190899 9110 12559 346055 2304 49310 848 28920 661 14143 11937 203984 6322 180253 95 7671 243120 9281 14165 238851 29974 1206 40154 3738 55352 2119
extension merge rate .c * 0.7414330 .c * 0.7019219 .cpp * 0.8263889 .cpp * 0.7867461 .cs * 0.7696209 .cs * 0.8324324 .css * 0.8555965 .css * 0.7842552 .go * 0.8687259 .go * 0.7967572 .html * 0.8441044 .html * 0.8133304 .java * 0.6910722 .java * 0.7515917 .js * 0.7851740 .js * 0.7290517 .json * 0.8802083 .json * 0.7688096 .m 0.7334906 .m 0.7105118 .markdown 0.8184569 .markdown 0.8095171 .md 0.7870487 .md 0.7878657 .php * 0.7809238 .php * 0.7342957 .podspec 0.8105263 .podspec 0.8434363 .py * 0.7760242 .py * 0.8070251 .rb * 0.8004236 .rb * 0.7135285 .rst * 0.8114032 .rst * 0.8366501 .txt * 0.7459531 .txt * 0.7239165 .xml 0.7386544 .xml 0.7376121
lower 0.7057234 0.6974071 0.8084559 0.7834622 0.7655632 0.8109560 0.8447873 0.7801860 0.8429339 0.7922172 0.8371394 0.8109071 0.6889940 0.7425843 0.7778856 0.7275676 0.8662468 0.7650625 0.7023648 0.7052465 0.7869141 0.8029466 0.7795931 0.7860851 0.7705204 0.7322500 0.7171813 0.8351090 0.7743616 0.7988467 0.7937449 0.7117107 0.8069279 0.8145557 0.7416650 0.7092799 0.7349727 0.7183244
upper 0.7749053 0.7064073 0.8432927 0.7900026 0.7736413 0.8523876 0.8659249 0.7882831 0.8916789 0.8012412 0.8508841 0.8157356 0.6931446 0.7604378 0.7923299 0.7305321 0.8931947 0.7725249 0.7629838 0.7157347 0.8471233 0.8159600 0.7943640 0.7896382 0.7910673 0.7363338 0.8836652 0.8515018 0.7776801 0.8150104 0.8069786 0.7153411 0.8158181 0.8570884 0.7502055 0.7382023 0.7423111 0.7562403
p 0.0332490 0.0332490 0.0000406 0.0000406 0.0000001 0.0000001 0.0000000 0.0000000 0.0000010 0.0000010 0.0000000 0.0000000 0.0000000 0.0000000 0.0000000 0.0000000 0.0000000 0.0000000 0.1565347 0.1565347 0.6017781 0.6017781 0.8409334 0.8409334 0.0000000 0.0000000 0.4626522 0.4626522 0.0000000 0.0000000 0.0000000 0.0000000 0.0304430 0.0304430 0.0033521 0.0033521 0.9346622 0.9346622
p.adj 0.0474986 0.0474986 0.0000739 0.0000739 0.0000003 0.0000003 0.0000000 0.0000000 0.0000020 0.0000020 0.0000000 0.0000000 0.0000000 0.0000000 0.0000000 0.0000000 0.0000000 0.0000000 0.1956684 0.1956684 0.6686423 0.6686423 0.8851931 0.8851931 0.0000000 0.0000000 0.5442967 0.5442967 0.0000000 0.0000000 0.0000000 0.0000000 0.0468353 0.0468353 0.0055868 0.0055868 0.9346622 0.9346622
49
PeerJ Preprints | https://doi.org/10.7287/peerj.preprints.1733v2 | CC BY 4.0 Open Access | rec: 26 Jul 2016, publ: 26 Jul 2016
Male Female
37030 1506
.yml .yml
0.7751823 0.7948207
0.7708953 0.7735273
0.7794260 0.8149578
0.0783721 0.0783721
0.1044962 0.1044962
Data from Figure 6 identifiable gender pulls merge rate lower upper Gender-Neutral female 3680 0.71821 0.7033663 0.7326994 Gender-Neutral male 7592 0.68981 0.6792626 0.7002016 Gendered female 14860 0.61649 0.6086135 0.6243153 Gendered male 651968 0.63327 0.6320992 0.6344403 identifiable gender pulls merge rate lower upper Gender-Neutral female 3180 0.88270 0.8710101 0.8936895 Gender-Neutral male 6528 0.88756 0.8796476 0.8951268 Gendered female 31174 0.87259 0.8688340 0.8762687 Gendered male 696232 0.86209 0.8612755 0.8628968 Data from Figure 7 name gender merge rate pulls all * Women 0.8104685 72790 all * Men 0.8044063 565150 Outsiders * Women 0.6762159 28414 Outsiders * Men 0.6657926 341042 OSS * Women 0.8025469 21281 OSS * Men 0.7849803 238985
lower 0.8076020 0.8033698 0.6707399 0.6642065 0.7971339 0.7833276
upper 0.8133101 0.8054398 0.6816560 0.6673758 0.8078771 0.7866261
p 0.0001039482 0.0001039482 0.0003512290 0.0003512290 0.0000000022 0.0000000022
50
PeerJ Preprints | https://doi.org/10.7287/peerj.preprints.1733v2 | CC BY 4.0 Open Access | rec: 26 Jul 2016, publ: 26 Jul 2016
Data from Figure 8 name gender merge rate pulls lower upper p p.adj .js Women 0.7935285 9735 0.7853492 0.8015318 0.1142567 0.2713598 .js Men 0.8002745 107519 0.7978720 0.8026607 0.1142567 0.2713598 .rb * Women 0.8142045 10560 0.8066527 0.8215827 0.0002109 0.0013358 .rb * Men 0.7988000 78013 0.7959693 0.8016084 0.0002109 0.0013358 .py * Women 0.8263671 6364 0.8168331 0.8356010 0.0000001 0.0000025 .py * Men 0.7984553 57815 0.7951618 0.8017189 0.0000001 0.0000025 .java Women 0.7587741 6069 0.7478052 0.7694937 0.4489242 0.6561200 .java Men 0.7540996 30691 0.7492417 0.7589093 0.4489242 0.6561200 .php Women 0.7815041 3936 0.7682610 0.7943279 0.0540790 0.1467860 .php Men 0.7946173 43722 0.7907997 0.7983958 0.0540790 0.1467860 .cpp Women 0.8530207 1109 0.8307958 0.8733532 0.0171928 0.0619344 .cpp Men 0.8223579 4522 0.8109002 0.8333976 0.0171928 0.0619344 .cs Women 0.7986270 437 0.7579148 0.8352403 0.5222280 0.7087379 .cs Men 0.8133691 1861 0.7949102 0.8308347 0.5222280 0.7087379 .c Women 0.7568627 255 0.6994351 0.8082127 0.2134333 0.4055234 .c Men 0.7172102 1713 0.6952319 0.7384418 0.2134333 0.4055234 .go Women 0.8359375 128 0.7602124 0.8954799 0.0195582 0.0619344 .go Men 0.7359368 930 0.7063484 0.7640224 0.0195582 0.0619344 .m Women 0.7076023 342 0.6562776 0.7552898 0.7315685 0.8441768 .m Men 0.7184308 1853 0.6973479 0.7388201 0.7315685 0.8441768 name gender merge rate pulls lower upper p p.adj .md Women 0.7927711 9545 0.7844987 0.8008645 0.4388592 0.6561200 .md Men 0.7961565 110618 0.7937702 0.7985273 0.4388592 0.6561200 .html * Women 0.8584337 7304 0.8502276 0.8663527 0.0000111 0.0001052 .html * Men 0.8377573 36416 0.8339301 0.8415305 0.0000111 0.0001052 .xml * Women 0.7288136 1003 0.7001568 0.7561203 0.0068671 0.0326190 .xml * Men 0.7681197 7164 0.7581692 0.7778516 0.0068671 0.0326190 .json Women 0.8705604 1267 0.8508197 0.8885626 0.1487014 0.3139253 .json Men 0.8552204 12804 0.8490057 0.8612731 0.1487014 0.3139253 .txt Women 0.7082353 2550 0.6901638 0.7258275 0.3193350 0.5515786 .txt Men 0.7180616 15317 0.7108625 0.7251779 0.3193350 0.5515786 .yml Women 0.8421053 836 0.8155905 0.8661805 0.8643613 0.8756078 .yml Men 0.8450558 6429 0.8359766 0.8538207 0.8643613 0.8756078 .rst Women 0.8571429 574 0.8258088 0.8847419 0.7553161 0.8441768 .rst Men 0.8627946 5887 0.8537408 0.8714872 0.7553161 0.8441768 .markdown Women 0.8191781 365 0.7757837 0.8573035 0.7310284 0.8441768 .markdown Men 0.8102036 3112 0.7959764 0.8238453 0.7310284 0.8441768 .podspec Women 0.8051948 77 0.6991329 0.8866683 0.8756078 0.8756078 .podspec Men 0.8187735 3649 0.8058844 0.8311497 0.8756078 0.8756078 51
PeerJ Preprints | https://doi.org/10.7287/peerj.preprints.1733v2 | CC BY 4.0 Open Access | rec: 26 Jul 2016, publ: 26 Jul 2016
Data from Figure 9 name gender 1-1 PRs * Women 1-1 PRs * Men 2-3 PRs Women 2-3 PRs Men 4-7 PRs Women 4-7 PRs Men 8-15 PRs Women 8-15 PRs Men 16-31 PRs Women 16-31 PRs Men 32-63 PRs Women 32-63 PRs Men 64-127 PRs Women 64-127 PRs Men Data from Figure 10: name One-Timers One-Timers Regulars’ First Regulars’ First Regulars’ Rest * Regulars’ Rest *
merge rate pulls lower upper p p.adj 0.6994322 10214 0.6904354 0.7083151 0.0000502 0.0003517 0.6795693 82643 0.6763755 0.6827505 0.0000502 0.0003517 0.7256196 8634 0.7160748 0.7350120 0.4258500 0.4968250 0.7214930 72522 0.7182148 0.7247534 0.4258500 0.4968250 0.7845663 9395 0.7761122 0.7928435 0.0604510 0.1266807 0.7759709 78068 0.7730295 0.7788917 0.0604510 0.1266807 0.8307023 10579 0.8234181 0.8378040 0.0868900 0.1266807 0.8239412 85786 0.8213757 0.8264847 0.0868900 0.1266807 0.8593357 11531 0.8528558 0.8656336 0.0673196 0.1266807 0.8528667 84537 0.8504607 0.8552484 0.0673196 0.1266807 0.8719439 9980 0.8652293 0.8784406 0.6756316 0.6756316 0.8703876 72708 0.8679245 0.8728210 0.6756316 0.6756316 0.8785922 6194 0.8701992 0.8866268 0.0904862 0.1266807 0.8708604 48173 0.8678330 0.8738430 0.0904862 0.1266807
pulls gender merge rate Women 0.6885806 4974 Men 0.6749383 35709 Women 0.7256196 8634 Men 0.7214930 72522 Women 0.8330911 59182 Men 0.8266364 456919
Data from Figure 11 identifiable gender merge rate pulls Gender-Neutral Women 0.9144487 1052 Gender-Neutral Men 0.8967161 292 Gendered * Women 0.8990182 17825 Gendered * Men 0.8923533 111043 Gender-Neutral * Women 0.7135606 1379 Gender-Neutral * Men 0.6513827 1075 Gendered Women 0.6733380 10093 Gendered Men 0.6702380 165026
lower 0.6755032 0.6700520 0.7160748 0.7182148 0.8300621 0.8255356 lower 0.8958890 0.8559693 0.8945017 0.8905156 0.6888989 0.6220471 0.6640898 0.6679638
upper 0.7014364 0.6797961 0.7350120 0.7247534 0.8360875 0.8277331 upper 0.9306474 0.9291445 0.9034042 0.8941705 0.7373087 0.6798868 0.6824860 0.6725063
p 0.056022 0.056022 0.425850 0.425850 0.000095 0.000095 p 0.4101325 0.4101325 0.0077647 0.0077647 0.0011548 0.0011548 0.5272237 0.5272237
52
PeerJ Preprints | https://doi.org/10.7287/peerj.preprints.1733v2 | CC BY 4.0 Open Access | rec: 26 Jul 2016, publ: 26 Jul 2016