Bioinformatics Advance Access published August 6, 2010
Gene function prediction using semantic similarity clustering and enrichment analysis in the malaria parasite Plasmodium falciparum Philip M. R. Tedder1, James R. Bradford2, Chris J. Needham3, Glenn A. McConkey4, Andrew J. Bulpitt3 and David R. Westhead1* 1
Institute of Molecular and Cellular Biology, University of Leeds, Leeds, LS2 9JT, UK Applied Computational Biology and Bioinformatics, Paterson Institute for Cancer Research, The University of Manchester, Manchester, M20 4BX, UK 3 School of Computing, University of Leeds, Leeds, LS2 9JT, UK 4 Institute of Integrative and Comparative Biology, University of Leeds, Leeds, LS2 9JT, UK 2
ABSTRACT Motivation: Functional genomics data provides a rich source of information that can be used in the annotation of the thousands of genes of unknown function found in most sequenced genomes. However, previous gene function prediction programs are mostly produced for relatively well annotated organisms that often have a large amount of functional genomics data. Here, we present a novel method for predicting gene function that uses clustering of genes by semantic similarity, a naïve Bayes classifier and ‘enrichment analysis’ to predict gene function for a genome that is less well annotated but does has a severe effect on human health, that of the malaria parasite Plasmodium falciparum. Results: Predictions for the molecular function, biological process and cellular component of P. falciparum genes were created from eight different datasets with a combined prediction also being produced. The high confidence predictions produced by the combined prediction were compared to those produced by a simple K-nearest neighbour classifier approach and were shown to improve accuracy and coverage. Finally, two case studies are described which investigate two biological processes in more detail, that of translation initiation and invasion of the host cell. Availability: Predictions produced are available at http://www.bioinformatics.leeds.ac.uk/~bio5pmrt/PAGODA
1
INTRODUCTION
The massive improvements in DNA sequencing technology have led in the past decade to ever more genomes being sequenced. Most newly sequenced genomes contain a large number of genes whose function cannot be inferred through conventional homology methods such as BLAST and annotating the function of these genes has been aided in recent years by the production of large high-throughput datasets. These datasets can be based on genomic sequence data using methods such as gene fusion (Marcotte, et al., 1999) and phylogenetic profiles (Pellegrini, et al., 1999) or they can be derived from experimental methods such as yeast two-
hybrid screens and microarray expression (Troyanskaya, et al., 2003). However, these datasets are often noisy and incomplete which can often lead to problems of low reliability and limited coverage when the data are used to predict gene function. To address these problems, several gene function prediction programs have been produced that combine multiple datasets using machine learning techniques to create synergistic predictions, see the review of MouseFunc for examples (Pena-Castillo, et al., 2008). Most of these programs rely on a “guilt by association” approach where a query protein’s function is inferred from annotated proteins with “similar” biological attributes. Many different approaches have been taken but they can effectively be split into either supervised, or unsupervised, learning methods. With a supervised approach, a training dataset is created from which an algorithm learns a set of rules that can then be used to predict the most likely annotation of a gene absent from the training set. Alternatively, an unsupervised approach can be taken where the data are separated into multiple clusters. Then, for each cluster, a statistical test is applied to see whether a cluster is overrepresented with a particular annotation. Functions can be defined using several different databases but the most popular is the Gene Ontology (GO) (Ashburner, et al., 2000). The GO database is structured as a directed acyclic graph (DAG) in which the terms form a hierarchy where more specific GO terms also inherit the more general terms above them. Early attempts at gene function prediction often overlooked these high levels of similarity between terms, but more recently programs have attempted to address this problem particularly by the inclusion of semantic similarity measures. Unfortunately, these programs all have drawbacks. Tao et al. (Tao, et al., 2007) could only produce predictions for genes that already have an annotation, while Yu et al. (Yu, et al., 2005) and Pandey and Kumar (Pandey, et al., 2009) both use a semantic similarity measure but only with a relatively simple K-nearest neighbour (KNN) classifier approach and only using microarray and protein-protein interaction data. Also, these two papers limit themselves to human and S. cere-
© The Author (2010). Published by Oxford University Press. All rights reserved. For Permissions, please email:
[email protected]
1
Downloaded from http://bioinformatics.oxfordjournals.org/ by guest on August 20, 2015
Associate Editor: Dr. Olga Troyanskaya
2
METHODS
2.1
Measuring gene functional similarity
P. falciparum gene function was described using annotations from the GO database which separates function into three categories: molecular function, biological process and cellular component. Measuring gene function similarity involved a two-stage process. First the relationships between all GO terms within a GO category were quantified using a semantic similarity measure developed by Lord et al. (Lord, et al., 2003), based on the method of Resnik (Resnik, 1999). Here, the similarity of two GO terms is based on the proportion of P. falciparum proteins that are annotated with the most specific shared parent term of these two terms. More formally, this is known as the probability of the minimum subsumer (pms) as defined in equation 1 for the GO terms (t1, t2) where A(t1,t2) is the set of parental terms shared by t1 and t2 and p(t) is the proportion of all GO annotated P. falciparum genes that are annotated with this particular GO annotation.
p ms (t1 , t 2 ) = min { p(t )}
(1)
t∈A( t1 ,t 2 )
The pms is calculated for both the most specific terms annotated to each protein and the parent terms as well, and from it the semantic similarity score between two terms is calculated as in equation 2. S (t1 , t 2 ) = − ln p ms (t1 , t 2 )
(2)
In this way, annotations that are very close to each other on the GO graph but biologically dissimilar, for example the two organelles the mitochondrion (GO:0005739) and the apicoplast (GO:0020011) which share seven out of eight parent GO terms, are given a low similarity score. For our purposes, the similarity score was normalised between zero and one by dividing by the highest similarity score possible in that GO category. Secondly, we used the GO term semantic similarity measures to calculate functional similarity between two genes based on the method of Wang et al. (Wang, et al., 2007) where for two genes G1 and G2 annotated with GO term sets T1 and T2 respectively, where T1= {ti(1) , i=1..n} and T2= {tj(2) , j=1..m}, the gene function similarity of the two genes is defined in equation 3. n
S (G1 , G2 ) =
2
∑
1 ( max {S (ti(1) , t ( 2) )} + (n + m) i =1 t ( 2 ) ∈T2
m
∑ max {S (t (1) j =1 t ∈T1
( 2) j
, t (1) )})
(3)
2.2
Clustering genes of similar function
To address the problem of sparse function annotation, we clustered genes with similar GO annotations together. When clustering data, it is important to balance the need for the most detailed prediction possible with the demand for sufficient training data, which leads to the prediction of fewer and broader functional classes. Here we approach this issue by clustering genes at different levels of specificity, using the DFMAX clique detection algorithm (Carraghan and Pardalos, 1990), into clusters of similar function where all gene pairs in each cluster have a gene function similarity greater than a certain threshold. Eight thresholds ranging from 0.1-0.8 in 0.1 increments produced eight specificity levels for each GO category. Annotations that were inferred without any manual curation (genes with evidence code: Inferred from Electronic Annotation (IEA)) were excluded owing to their low reliability. Each cluster was then assigned a functional label, which was derived by finding the most specific GO term(s) shared by each gene in that cluster.
2.3
Bayes classifier
Creating clusters of similar function allowed us to calculate the probability that two genes belong to the same functional cluster. We calculated this probability using a Bayes classifier and eight different P. falciparum datasets, all of which have been shown to predict gene function (Brehelin, et al., 2008, Pena-Castillo, et al., 2008). A combined prediction using all these eight data types was then produced using a naive Bayes classifier which treats each data source as independent and is widely acknowledged as excellent for such data integration tasks. Our classifier was implemented using the Bayesian Network Toolbox for Matlab (Murphy, 2001) and we used the maximum likelihood algorithm to learn the model parameters. In this study, all continuous variable distributions (Bozdech and Affymetrix microarray, mass spectrometry, gene neighbourhood, gene conservation and domain) were modelled as Gaussian, while the class node, interaction and gene fusion nodes were discrete. For each dataset a measure was produced indicating the similarity between the two genes. The detail of how the data for each method was collated and formatted for input into the Bayes classifier, and the measure used to indicate similarity, are outlined below.
2.3.1 Sequence domains Each protein sequence was queried against the InterPro database (Mulder, et al., 2007) using InterPro scan (Quevillon, et al., 2005). Then, for each protein pair the proportion of different domains shared between the two proteins was calculated.
2.3.2 Gene neighbourhood Genes that are found in close proximity to each other on the genome have been shown to be more likely to share the same function (Overbeek, et al., 1999). The chromosomal location of all P. falciparum genes was downloaded from PlasmoDB (Stoeckert, et al., 2006). The smallest distance between the two genes was then calculated and divided by the total length of the chromosome on which the genes resided. Genes that resided on different chromosomes were assigned a value of 0.5.
2.3.3 Gene conservation Proteins that exist in the same biological complex or pathway are likely to be co-conserved across a wide set of organisms i.e. genes that share similar patterns of gene conservation and gene loss are more likely to be functionally related (Pellegrini, et al., 1999). Gene conservation data (also known as phylogenetic profiles) was collated from the Prolinks database (Bowers, et al., 2004) in which the conservation of each P. falciparum gene is calculated across 83 organisms. The confidence score produced by Prolinks was used to indicate the similarity of the two genes’ patterns of conservation.
Downloaded from http://bioinformatics.oxfordjournals.org/ by guest on August 20, 2015
visaie, both organisms which have relatively well annotated genomes. Gene function prediction programs for organisms that are less well annotated but have significant effects on humans, such as the causative agent of the most deadly form of malaria P. falciparum, are few. The sparse annotation of such genomes and thus a lack of training data makes predicting gene function more challenging. Therefore, in this paper we collate a large, disparate collection of datasets for P. falciparum and present a novel method for gene function prediction that attempts to address this problem. Our program contains three steps (i) clustering genes using a semantic similarity measure into functional clusters; (ii) calculating the probability that a pair of genes belong to the same functional cluster using a Bayes classifier; (iii) using these probabilities we employ an enrichment analysis algorithm to predict the function of the gene. We call this program PAGODA (Protein Assignment by Gene Ontology Data Associations).
2.3.4 Gene fusion Two distinct genes involved in the same biological process in one organism are sometimes found fused into a single gene in another organism (Marcotte, et al., 1999). Gene fusion data was taken from Date and Stoeckert (Date and Stoeckert, 2006) where 163 completely sequenced eukaryotic and prokaryotic genomes were mined for incidences of gene fusion events. A binary score was used to indicate whether a gene fusion event had occurred in another organism between the gene pair.
Score (ES), the gene pairs (gj) are ranked in descending order of probability. A running sum statistic is then calculated as follows: The list is descended and at each step and for all the functional clusters, a score is calculated that the gene belongs to the functional cluster (Lcluster) and does not (Lnot_in_cluster) as shown in equations 4 and 5. The running sum statistic is then Lcluster - Lnot_in_cluster.
Lcluster =
2.3.5 Microarray expression
where N p =
Np
∑p
(4)
j
g j ∈S
Where pj is the probability that the pair of genes are in the same cluster. Lnot _ in _ cluster =
∑
g j ∉S , j ≤ i
1 N not _ in _ cluster
(5)
Where Nnot_in_cluster is the number of gene pairs not in the cluster. The ES for the cluster is then the maximum deviation of the running sum statistic from zero achieved during the process (the ES will be positive if the cluster is enriched and negative if it is impoverished). The ES is affected by the number and magnitude of the probabilities of the gene pairs assigned to each cluster, so to allow comparison between ES scores a normalised Enrichment Score (NES) is produced. To calculate this, the ranked gene pair list is permuted (i.e. the probabilities in the list are randomly distributed across the gene pairs) and a random ES calculated. This is repeated 1000 times and the original ES divided by the mean random ES to give the NES. The NES score was calculated for all clusters at the given specificity level and the cluster with the highest NES score used as the prediction of the gene’s function.
2.3.7 Protein-Protein interactions Interaction data for P. falciparum were downloaded from the IntAct database (Hermjakob, et al., 2004). Two proteins were deemed not to interact if their interaction was absent from the IntAct database and a binary score was then used to indicate whether or not the two proteins interacted.
1
0.62
0.84
2
0.84
0.62
2.4
3
0.47
0.47
4
0.12
0.39
. . . . . .
. . . . . .
. . . . . .
0.39
0.12
2, Calculate probability of shared cluster membership
3, Rank genes in descending order
Gene Set Enrichment
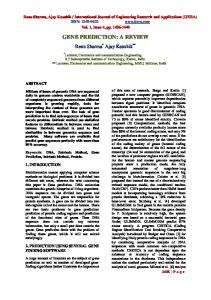
The Bayes classifier calculates the probability of a pair of genes belonging to the same functional cluster, and this can be applied to a query gene and a set of genes of known function. The next step is to exploit this information and assign a function or functions to the query gene. To do this, we assume that the functional cluster to which the query gene belongs is likely to be associated with gene pairs with the highest probabilities, in other words, the cluster should be ‘enriched’ with gene pairs of higher probability. To calculate this ‘enrichment’ factor for each cluster, we adapt an algorithm originally designed to perform a similar such calculation for a group of genes in microarray data, the Gene Set Enrichment Algorithm (GSEA) (Subramanian, et al., 2005). The schematic of this GSEA prediction process is outlined in figure 1. At a given specificity level that contains the query gene and N other genes, the training set is created by using all gene pairs at that level that belong to the same functional cluster and an equal number of randomly chosen gene pairs that do not belong to the same functional cluster. A test set is then produced, consisting of N gene pairs, with each gene pair containing the query gene and one of the other genes. The Bayes classifier is then trained on the training set and used to assign the probabilities that the gene pairs in the test set belong to the same functional cluster. We now can calculate the functional cluster to which the query gene most likely belongs. In other words, the functional cluster most enriched amongst gene pairs with high probabilities. To measure this Enrichment
. . . .
. . . .
Query gene
N 1, Extract all gene pairs that include the query gene
4, Clusters ranked by enrichment score (ES)
5, Clusters ranked by normalised enrichment score (NES) with the cluster with the highest NES score being the predicted function of the gene
Fig 1. Steps involved in predicting gene cluster/function membership at a given specificity level.
3
RESULTS
To assess our method a leave one out cross validation procedure was performed for each GO category on all P. falciparum genes with a GO annotation (excluding IEA annotations). P. falciparum genes whose functions can be inferred from annotated orthologous proteins were also excluded where orthologs were defined by the OrthoMCL (Chen, et al., 2006). A prediction was defined as a
3
Downloaded from http://bioinformatics.oxfordjournals.org/ by guest on August 20, 2015
The peptide counts from P. falciparum mass spectrometry experiments for the asexual blood stage and gametocyte stage (Florens, et al., 2002, Lasonder, et al., 2002) were combined. Mass spectrometry experiments on the sexual stage, the asexual blood stage, gametocyte, ookinete, oocyst and sporozoite stage of Plasmodium berghei were also included by mapping the P. berghei proteins to their corresponding P. falciparum orthologs (Khan, et al., 2005, Le Roch, et al., 2004). Owing to the difficulty of detecting proteins at low concentrations, the data consisted of a significant number of zero counts. We therefore found the Manhattan distance to be the most appropriate correlation measure.
pj
g j ∈S , j ≤i
Microarray data was split into two different types (Bozdech and Affymetrix) depending on the microarray used to obtain the results. The Bozdech microarray data was created using a custom made 2-channel DNA microarray, and measured the expression profiles across 48 individual one hour time-points from the asexual blood stage of the HB3 strain (Bozdech, et al., 2003). Affymetrix microarray data consisted of expression profiles across 38 experiments from the gametocyte, sporozoite and asexual blood stage (Le Roch, et al., 2004, Young, et al., 2005) of the parasite’s life cycle. Co-expression between a pair of genes for both microarray sets was measured by calculating the Pearson correlation coefficient.
2.3.6 Mass spectrometry
∑
4
to substantial redundancy in information, and that the classifier is robust to the inclusion of less predictive datasets. We then investigated the functional clusters most accurately predicted by PAGODA (accuracy defined as where at least ¾ of predictions for that cluster are in the top 3). Molecular function, biological process and cellular component were more accurate for the most specific clusters (supplementary tables 4-6). This is contrast to the overall accuracy of PAGODA which performs better at more general clusters. This, in part, may be due to the small number of proteins in the clusters at these levels therefore meaning only a couple of genes needed to be predicted correctly for the cluster to be counted as accurately predicted, but can most probably be explained by a small number of highly specific functional clusters for which predictions are particularly accurate. This was especially true for molecular function compared with biological process and cellular component. Although the well predicted clusters covered a wide range of functions, functions and processes relating to translation, DNA replication, processes involving RNA and invasion and interaction with the parasite’s host seemed to be particularly well predicted. We then examined GO clusters that were predicted accurately by multiple datasets (defined as three or more) as shown in supplementary tables 7-9. PAGODA predicted the most GO clusters in molecular function and showed a preference for predicting smaller, more specific, GO clusters. Significantly fewer clusters were predicted in biological process and cellular component (cellular component => 32, biological process => 36, molecular function => 60) and more general functional clusters were preferred. More specifically, in the biological process category, PAGODA predicts most accurately proteins involved in the processing of RNA and proteins involved with cell invasion and interaction with cells in the host wall, whilst in the cellular component category, proteins in or near chromosomes and proteins in the translation initiation complexes were best predicted.
Downloaded from http://bioinformatics.oxfordjournals.org/ by guest on August 20, 2015
success if the NES score of the annotated function was one of three highest for that specificity level. Coverage was defined as the proportion of total number of genes for which a prediction could be made at that specificity level. Accuracy and coverage are shown for classifiers based on each dataset separately and all datasets combined are shown in Figures 2-4, and given in supplementary tables 1-3. As expected, figures 2-4 show that generally PAGODA achieves a greater degree of success with more general clusters, partly because there are fewer clusters to classify into but also because more genes are clustered at the more general levels and therefore more data are available to inform the prediction. The protein-protein interaction data, consisting mainly of the yeast two-hybrid data of LaCount et al. (LaCount, et al., 2005), produced poor results and the quality of this dataset has been previously questioned (Wuchty and Ipsaro, 2007). The most accurate methods were the domain and gene conservation methods, although the former achieved approximately 60% coverage and latter only approximately 15%. The combined method, which uses the predictions of all the other methods, achieved the highest coverage but not the highest accuracy. This is likely to be due to the ability of the combined method to predict the function of genes for which only sparse data is available but at the cost of decreased confidence in the prediction. The result is that the overall accuracy of the combined method is reduced. Accuracy and coverage for each method are remarkably similar for molecular function and biological process, although corresponding numbers for cellular component are slightly higher. To complement the results for each separate dataset shown in Figures 2-4, we also investigated the performance of classifiers omitting each of the datasets in turn from the combined dataset. We found that with the exception of domain data, there was no dataset whose omission significantly reduced or increased performance (omission of domain data reduced performance measures by 510%). This shows that the use of a large number of datasets leads
predictions and results for the combined data sources are also shown (f=Affymetrix, b=Bozdech, d=domain, c=gene conservation, u=gene fusion, n=gene neighbourhood, m=mass spectrometry, p=protein-protein interactions, a=combined) and the number represents the specificity level with 1 being the most general and 8 being the most specific . A different coloured oval is used for each method to show where the majority of the methods results are (black=Affymetrix, blue=Bozdech, dark green=domain, orange=gene conservation, purple=gene fusion, grey=gene neighbourhood, red=mass spectrometry, yellow=protein-protein interactions, light green=combined).
3.1 Case study: Translation initiation factors and erythrocyte invasion The translation of mRNA into proteins proceeds through the three major steps of initiation, elongation and termination. Translation initiation involves the binding of the Met-tRNA to the small ribosomal subunit and then this to the mRNA followed by the joining of the large ribosomal subunit (Acker and Lorsch, 2008). To perform this, a large number of eukaryotic translation initiation factors (TIF) are required. The number of proteins required for translation initiation varies between species, with many of the TIF being multisubunit proteins (Rodnina and Wintermeyer, 2009). Also Plasmodium is particularly unusual in expressing different rRNAs at different stages of its life cycle with P. falciparum producing asex-
ual and sporozoite rRNA (McCutchan, et al., 1995). The precise proteins involved in translation is still not well understood and the difficulty of experimentally verifying annotations in Plasmodium has meant the TIF annotations in P. falciparum have mostly be assigned by homology methods, with certain TIF believed to exist but yet to be identified (Ginsburg, 2006). Proteins involved in translation in P. falciparum were predicted accurately by several of the datasets in PAGODA (supplementary table 10) with 10 of the 12 TIF in P. falciparum correctly predicted by the combined method in PAGODA. Therefore we investigated the proteins involved in translation initiation to see if PAGODA could improve the current annotations for TIF in P. falciparum. Another well predicted but far from completely understood process
5
Downloaded from http://bioinformatics.oxfordjournals.org/ by guest on August 20, 2015
Fig 2-4. Accuracy versus coverage for the three different GO classes. Each letter denotes the use of a single separate data source to make
Gene PF14_0428 PF13_0315 PF11_0445 PFE0885w PFE0350c PF13_0316 PF10_0264 PFD0770c PF13_0354 PFL0330c
Description Histidine -tRNA ligase, putative RNA binding protein, putative DNA-directed RNA polymerase I, putative Translation initiation factor 3 subunit, putative 60S ribosomal protein L4, putative 40S ribosomal protein S13, putative 40S ribosomal protein S2B, putative 60S ribosomal protein L15, putative Alanine--tRNA ligase, putative RNA polymerase III subunit, putative
Correlation 0.976 0.971 0.964 0.964 0.963 0.962 0.961 0.961 0.961 0.958
Table 1. Correlation of RNA helicase PFB0445c in Bozdech microarray data with proteins involved in translation. One of the most interesting proteins predicted to be involved in translation initiation is the protein PFD0880w. PlasmoDB annotates the protein as a proteasome regulatory component, possibly because the protein contains the Proteasome component region
6
domain (IPR000717). The Plasmodium biological pathway database Malaria Parasite Metabolic Pathways (Ginsburg, 2006) agrees with this annotation and annotates the protein as a lid subunit of the proteasome, involved in the proteasome-mediated proteolysis of ubiquinated proteins. Despite PAGODA using domain information it does not predict the protein to be involved in protein degradation but instead predicts the protein to be involved in translation initiation, based on other TIF containing that domain (PFL0310c and PFE01405c), strong correlation with other TIF in the Bozdech microarray (r >0.95) and Affymetrix microarray (r >0.91) data. To evaluate our prediction we performed a BLAST search of PFD0880w against Swiss-Prot and also looked at the fold of the protein using GenTHREADER (McGuffin and Jones, 2003). BLAST results showed strong sequence similarity to Eukaryotic TIF 3 subunit m (E-value = 3 x 10-30). This protein was also originally annotated as a proteasome protein until Zhou et al. (Zhou, et al., 2005a) showed it was involved in translation and particularly involved in translation in certain mRNAs. This role in allowing certain mRNAs to be translated is corroborated by the fold of the protein, which is predicted to be a three-domain protein consisting of the Anticodon-binding domain (SCOP ID => b.40.4.1), GAD domain (SCOP ID => d.74.4.1) and Class II aminoacyl-tRNA synthetase-like, catalytic domain (SCOP ID => d.104.1.1). GenTHREADER predicts only two other P. falciparum proteins with this fold, both of which are involved in translation (the asparaginetRNA ligase PFE0715w and phenylalanyl-tRNA synthetase subunit PFF0180w). Both these proteins are involved in joining tRNA molecules to their specific amino acid suggesting PFD0880w/ETIF3m may have a similar role. 3.2 Comparison with existing P. falciparum gene function prediction Most attempts to predict gene function in P. falciparum either rely on just one source of data (Zhou, et al., 2005b) or do not produce a combined prediction through a machine learning method (Tedder, et al., 2010, Zhou, et al., 2008). Here we compare PAGODA with Plasmodraft, a program that predicts the function of unannotated P. falciparum genes (Brehelin, et al., 2008) using multiple sources of data and combining them using a KNN approach. Direct comparison between gene function prediction programs is difficult, with there being differences in annotation sets (Plasmodraft uses all the GO annotations while PAGODA excludes IEA annotations) and differences in the datasets used. However, we attempt to compare the methods by evaluating the accuracy of the programs’ most confident predictions for annotated genes. The Plasmodraft website includes a file containing its most confident predictions and these predictions were compared to the high confidence predictions of PAGODA combined method (a high confidence prediction was defined as a gene that had a NES >1.5 at any specificity level, with the most detailed prediction taken if the NES was greater than 1.5 at more than one level). The predictions produced by each method were then evaluated against the actual annotations of P. falciparum genes using the Lord et al. method (Lord, et al., 2003) and the coverage calculated as the number of genes with a prediction divided by the total number of annotated P. falciparum genes for that GO class. Figures 5 and 6 show the mean of these measurements, and as can be seen, PAGODA produces more predictions at a greater accuracy than that of Plasmodraft.
Downloaded from http://bioinformatics.oxfordjournals.org/ by guest on August 20, 2015
in P. falciparum is the invasion of the host cell. A similar process to that described below for translation initiation was also conducted and is outlined in supplementary materials. We describe 19 genes that are likely to be involved in invasion of the host cell and investigate 3 of these genes in more detail. PAGODA was run for biological process at level 6 specificity, the level of the functional cluster translational initiation (GO:0006413), on genes that did not have a manually curated GO biological process annotations in GeneDB (Hertz-Fowler, et al., 2004). Genes that were predicted to be TIF with an NES >2 (this corresponded to 4.53% of genes at this level) and included at least one gene pair with a probability greater than 0.85 were extracted and this produced a list of 18 genes (supplementary table 11) most likely to be involved in translation initiation. Encouragingly, five of these genes are already annotated as ribosomal genes (PF13_0228, PFC0775w, MAL13P1.209, PF13_0268, PF14_0230) using the non-manually curated IEA annotations and one protein (PF10_0103) had also been putatively annotated as a TIF in the most recent GeneDB annotations, corroborating our predictions. Proteins involved in translation often show highly correlated patterns of expression (Webb and Westhead, 2009) and in P. falciparum the microarray based methods, especially the Bozdech microarray data, are the most informative in predicting the annotated TIF. This high level of correlation is also seen in the 18 proteins predicted to be involved in translation initiation, for example for the hypothetical protein PFL0155c, 7 of the 8 most correlated genes in the Bozdech microarray data are proteins involved in translation (supplementary figure 1 and supplementary table 12). Three RNA helicases are also in the list of 18 proteins predicted to be involved in translation initiation. RNA helicases unwind RNA strands and are known to be involved in translation (Sonenberg and Hinnebusch, 2009). Again, with these RNA helicases we see high levels of correlation with proteins involved in translation, for example, seven out of the ten genes most correlated genes with the RNA helicase PFB0445c in the Bozdech microarray data are genes involved in translation and all are correlated with a Pearson correlation coefficient greater than 0.95 as shown in table 1.
pleted the user is presented with a descending list of all the functional clusters at that specificity level and their respective NES scores indicating how likely the gene has that functional annotation. PAGODA is available at http://www.bioinformatics.leeds.ac.uk/~bio5pmrt/PAGODA/
4
ACKNOWLEDGEMENTS This work was supported by the Biotechnology and Biological Sciences Research Council (BB/C52101X/1 to D.R.W, BBS/B/16585 to A.J.B and D.R.W, BBS/S/E/2006/13188 to PMRT).
REFERENCES
Fig 6. Comparison of coverage predicted by PAGODA and Plasmodraft for each GO class.
3.3 PAGODA web-tool: An integrated gene function prediction website tool for Plasmodium falciparum As the majority of P. falciparum genes either have no annotation or lack a detailed annotation we have built a web tool based on the PAGODA algorithm to allow the prediction of the function of any P. falciparum gene. The results for P. falciparum genes with a manually annotated GO annotation have been pre-calculated and are available to download. For unannotated genes a prediction can also be produced. The unannotated query gene is treated as the “left out” gene in the PAGODA method. The gene IDs of PlasmoDB are used (if the user is unsure of this ID they can search the names, aliases, notes and descriptions of all P. falciparum genes from PlasmoDB on the front page of PAGODA). Input consists of the gene, the GO class and the specificity level at which to run the prediction program. Once the process is com-
Acker, M.G. and Lorsch, J.R. (2008) Mechanism of ribosomal subunit joining during eukaryotic translation initiation. Biochem Soc Trans, 36, 653-7. Ashburner, M. et al. (2000) Gene ontology: tool for the unification of biology. The Gene Ontology Consortium. Nat Genet, 25, 25-9. Bowers, P.M. et al. (2004) Prolinks: a database of protein functional linkages derived from coevolution. Genome Biology, 5, R35. Bozdech, Z. et al. (2003) The transcriptome of the intraerythrocytic developmental cycle of Plasmodium falciparum. PLoS Biol, 1, E5. Brehelin, L. et al. (2008) PlasmoDraft: a database of Plasmodium falciparum gene function predictions based on postgenomic data. BMC Bioinformatics, 9, 440. Carraghan, R. and Pardalos, P.M. (1990) An Exact Algorithm for the Maximum Clique Problem. Operations Research Letters, 9, 375-382. Chen, F. et al. (2006) OrthoMCL-DB: querying a comprehensive multi-species collection of ortholog groups. Nucleic Acids Res, 34, D363-8. Date, S.V. and Stoeckert, C.J., Jr. (2006) Computational modeling of the Plasmodium falciparum interactome reveals protein function on a genome-wide scale. Genome Res, 16, 542-9. Florens, L. et al. (2002) A proteomic view of the Plasmodium falciparum life cycle. Nature, 419, 520-6. Ginsburg, H. (2006) Progress in in silico functional genomics: the malaria Metabolic Pathways database. Trends in Parasitology, 22, 238-240. Hermjakob, H. et al. (2004) IntAct: an open source molecular interaction database. Nucleic Acids Res, 32, D452-5. Hertz-Fowler, C. et al. (2004) GeneDB: a resource for prokaryotic and eukaryotic organisms. Nucleic Acids Research, 32, D339-D343. Khan, S.M. et al. (2005) Proteome analysis of separated male and female gametocytes reveals novel sex-specific Plasmodium biology. Cell, 121, 675-87. LaCount, D.J. et al. (2005) A protein interaction network of the malaria parasite Plasmodium falciparum. Nature, 438, 103-7.
7
Downloaded from http://bioinformatics.oxfordjournals.org/ by guest on August 20, 2015
Fig 5 Comparison of accuracy predicted by PAGODA and Plasmodraft for each GO class.
CONCLUSIONS
Eight years after the sequencing of the P. falciparum genome, the majority of P. falciparum genes remain of unknown function. Gene function prediction programs have shown their ability to work but have been mainly designed for well annotated model organisms that have large amounts of training data. In this work we create a gene function prediction program using a wide range of datasets combined using a novel sophisticated machine learning algorithm. We use a semantic similarity measure on GO annotations, which circumvents the problem of GO annotations which are very close on the GO graph but are biologically speaking quite different. This measure is then used to cluster genes, thereby taking into account the interdependence of GO terms and with the use of the GSEA to remove arbitrary cut-offs, such as those used in KNN approaches, we produce a greater number of predictions with greater accuracy; and with the example of PFD0880w we show that PAGODA can actually improve on the current annotations of P. falciparum many of which are just inferred through sequence similarity.
8
Downloaded from http://bioinformatics.oxfordjournals.org/ by guest on August 20, 2015
Lasonder, E. et al. (2002) Analysis of the Plasmodium falciparum proteome by highaccuracy mass spectrometry. Nature, 419, 537-42. Le Roch, K.G. et al. (2004) Global analysis of transcript and protein levels across the Plasmodium falciparum life cycle. Genome Res, 14, 2308-18. Lord, P.W. et al. (2003) Investigating semantic similarity measures across the Gene Ontology: the relationship between sequence and annotation. Bioinformatics, 19, 1275-83. Marcotte, E.M. et al. (1999) Detecting protein function and protein-protein interactions from genome sequences. Science, 285, 751-3. McCutchan, T.F. et al. (1995) The cytoplasmic ribosomal RNAs of Plasmodium spp. Parasitol Today, 11, 134-8. McGuffin, L.J. and Jones, D.T. (2003) Improvement of the GenTHREADER method for genomic fold recognition. Bioinformatics, 19, 874-881. Mulder, N.J. et al. (2007) New developments in the InterPro database. Nucleic Acids Res, 35, D224-8. Murphy, K.P. (2001) The Bayes Net Toolbox for MATLAB. Computing Science and Statistics, 33, Overbeek, R. et al. (1999) The use of gene clusters to infer functional coupling. Proceedings of the National Academy of Sciences of the United States of America, 96, 2896-2901. Pandey, G. et al. (2009) Incorporating functional inter-relationships into protein function prediction algorithms. Bmc Bioinformatics, 10, 142. Pellegrini, M. et al. (1999) Assigning protein functions by comparative genome analysis: protein phylogenetic profiles. Proc Natl Acad Sci U S A, 96, 4285-8. Pena-Castillo, L. et al. (2008) A critical assessment of Mus musculus gene function prediction using integrated genomic evidence. Genome Biol, 9 Suppl 1, S2. Quevillon, E. et al. (2005) InterProScan: protein domains identifier. Nucleic Acids Res, 33, W116-20. Resnik, P. (1999) Semantic similarity in a taxonomy: An information-based measure and its application to problems of ambiguity in natural language. Journal of Artificial Intelligence Research, 11, 95-130. Rodnina, M.V. and Wintermeyer, W. (2009) Recent mechanistic insights into eukaryotic ribosomes. Current Opinion in Cell Biology, 21, 435-443. Sonenberg, N. and Hinnebusch, A.G. (2009) Regulation of Translation Initiation in Eukaryotes: Mechanisms and Biological Targets. Cell, 136, 731-745. Stoeckert, C.J., Jr. et al. (2006) PlasmoDB v5: new looks, new genomes. Trends Parasitol, 22, 543-6. Subramanian, A. et al. (2005) Gene set enrichment analysis: a knowledge-based approach for interpreting genome-wide expression profiles. Proc Natl Acad Sci U S A, 102, 15545-50. Tao, Y. et al. (2007) Information theory applied to the sparse gene ontology annotation network to predict novel gene function. Bioinformatics, 23, i529-38. Tedder, P.M. et al. (2010) PlasmoPredict: a gene function prediction website for Plasmodium falciparum. Trends Parasitol, 26, 107-110. Troyanskaya, O.G. et al. (2003) A Bayesian framework for combining heterogeneous data sources for gene function prediction (in Saccharomyces cerevisiae). Proceedings of the National Academy of Sciences of the United States of America, 100, 8348-8353. Wang, J.Z. et al. (2007) A new method to measure the semantic similarity of GO terms. Bioinformatics, 23, 1274-81. Webb, E.C. and Westhead, D.R. (2009) The transcriptional regulation of protein complexes; a cross-species perspective. Genomics, 94, 369-376. Wuchty, S. and Ipsaro, J.J. (2007) A draft of protein interactions in the malaria parasite P. falciparum. J Proteome Res, 6, 1461-70. Young, J.A. et al. (2005) The Plasmodium falciparum sexual development transcriptome: a microarray analysis using ontology-based pattern identification. Mol Biochem Parasitol, 143, 67-79. Yu, H. et al. (2005) Broadly predicting specific gene functions with expression similarity and taxonomy similarity. Gene, 352, 75-81. Zhou, C.S. et al. (2005a) PCI proteins eIF3e and eIF3m define distinct translation initiation factor 3 complexes. Bmc Biology, 3, 14. Zhou, Y. et al. (2005b) In silico gene function prediction using ontology-based pattern identification. Bioinformatics, 21, 1237-45. Zhou, Y.Y. et al. (2008) Evidence-Based Annotation of the Malaria Parasite's Genome Using Comparative Expression Profiling. Plos One, 3, e1570.