Hindawi Publishing Corporation Journal of Applied Mathematics Volume 2014, Article ID 919242, 11 pages http://dx.doi.org/10.1155/2014/919242
Research Article Generalized Predator-Prey Model with Nonlinear Impulsive Control Strategy Wenjie Qin,1 Guangyao Tang,1,2 and Sanyi Tang1 1 2
College of Mathematics and Information Science, Shaanxi Normal University, Xi’an 710062, China School of Science, Hubei Minzu University, Enshi 445000, China
Correspondence should be addressed to Wenjie Qin;
[email protected] Received 8 October 2013; Accepted 16 December 2013; Published 9 February 2014 Academic Editor: XianHua Tang Copyright © 2014 Wenjie Qin et al. This is an open access article distributed under the Creative Commons Attribution License, which permits unrestricted use, distribution, and reproduction in any medium, provided the original work is properly cited. A generalized predator-prey model concerning integrated pest management and nonlinear impulsive control measures is proposed and analyzed. The main purpose is to understand how resource limitation affects the successful pest control and pest outbreaks. The threshold conditions for the stability of the pest-free periodic solution are given firstly. Once the threshold value exceeds a critical level, both pest and its natural enemy populations can oscillate periodically. Secondly, in order to address how the limited resources affect the pest control, as an example the Holling II functional response function is chosen. The numerical results show that predator-prey model with limited resource has complex dynamical behavior. In addition, it is confirmed that the model has the coexistence of pests and natural enemies for a wide range of parameters.
1. Introduction During the last few decades, controlling insect pests of agriculture and insect vectors of important plant has been becoming an increasing important issue all over the world. The pest outbreaks often cause serious ecological and economic problems, which have been a great concern for entomologists and the society. Integrated pest management (IPM) involves choosing appropriate tactics from a range of pest control techniques including biological, cultural, and chemical methods to suit individual cropping systems, pest complexes, and local environments [1–4]. It has been proved both theoretically [2, 5] and experimentally [6, 7] that IPM has been more effective than the biological control or chemical control alone. Mathematical models can assist in the design and understanding of IPM strategies and mathematical analyses can provide valuable information about how to control pest outbreaks. Recently, many works [7–20] have been devoted to investigate the range of possible ecological interactions between pest and natural enemy to construct and explore population models describing IPM strategies. However, one of the major assumptions in previous works was that all control tactics such as the instant killing rate of
pesticide applications with respect to the pest is a constant. In fact, every community or country has an appropriate or limited capacity for pesticides, farmers, equipment, costs, and so forth, especially for developing countries. In these above factors of limited resources, most notably are Limited Resource Farmers (LRFs); that is, the farmers used pesticides and practiced crop rotation and other practices, but a majority was not familiar or inadequately familiar with IPM. Data was collected from 90 LRFs in the Alabama Black Belt and analyzed by descriptive statistics [21–24]. It reveals that there exist many challenges including health risks to farmers as well as environmental damage. Understanding resource limitation is critical to effective management and conservation of populations; however, resource limitation is difficult to quantify partly because it is a dynamic process [25]. Meanwhile, a saturation phenomenon of the limited resources is considered in order to better characterize the effect of resource limitation. Based on the above factors, we propose a generalized mathematical model with nonlinear pulse control tactics in order to investigate the effect of limited resources on the outbreak of pest populations. To the best of our knowledge, no work has been done for the effects of resource limitation on a generalized predator-prey model.
2
Journal of Applied Mathematics
The organization of present paper is as follows. Section 2 introduces our model and some preliminaries. In Section 3, by using the method of the differential inequality, qualitative analysis, the discrete dynamical system determined by the stroboscopic map, and Floquet theory, some sets of sufficient conditions, which guarantee the existence and stability of the pest-free periodic solution, are obtained. We choose the Holling Type II functional response curve as an example with aims to investigate how the nonlinear pulse perturbations affect the successful pest control in Section 4. The paper ends with some interesting biological conclusions and numerical bifurcation analyses, which complement the theoretical findings.
1 0
−e−1
W(0, z)
e
−1
−2 −3 −4 W(−1, z) −5 −0.5
0
0.5
1
1.5
2
2.5
3
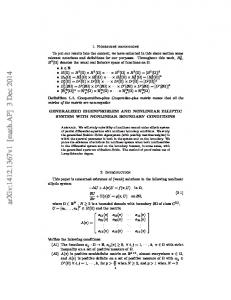
Figure 1: The two real branches 𝑊(0, 𝑧) and 𝑊(−1, 𝑧) of Lambert 𝑊 function.
2. The Model with Nonlinear Pulse Perturbations and Preliminaries In this paper, we will extend the classical Lotka-Volterra model [26, 27] to a generalized form. In the following, 𝑥 and 𝑦 are the population abundances of the pests and natural enemies, respectively,
In order to investigate the dynamics of the above generalized prey-predator model, we first provide some basic assumptions for the functions 𝑓(𝑥) and 𝑔(𝑥) as follows.
𝑥̇ = 𝑓 (𝑥) − 𝜙 (𝑥) 𝑦,
Hypothesis 1. Let 𝑓(𝑥) and 𝜙(𝑥) be locally Lipschitz continuous on R+ such that
𝑦̇ = 𝜇𝜙 (𝑥) 𝑦 − 𝛿𝑦
(1)
with nonnegative initial conditions (𝑥0 , 𝑦0 ), where 𝑓(𝑥) is the per capita growth rate of the pest population in the absence of natural enemy, 𝜙(𝑥) is the per capita functional response of the predator, 𝜇 is the conversion efficiency of the prey to predator, and 𝛿 is the per capital death rate of the predator population. Furthermore, we assume that the IPM control tactics are implemented every period 𝑇, at which the natural enemies are released and pesticides are applied simultaneously. Moreover, to take account of the resource limitation and saturation effects, we use the Sigmoid function [28, 29] that is to assume that at every period 𝑇 a nonlinear perturbation 𝑝(𝑥) = 𝑝1 /(1+e−𝑥 ) or 𝑝(𝑦) = 𝑝2 /(1+e−𝑦 ) decreases on pest or natural enemies populations, respectively, and an introduction of constant 𝜎 for the natural enemies, which does not depend on their population sizes, is considered. These results yield the following discrete process for every time 𝑛𝑇: 𝑝1 ) 𝑥, 1 + e−𝑥 (2) 𝑝2 + ) 𝑦 + 𝜎, 𝑦 (𝑡 ) = (1 − 1 + e−𝑦 where 𝑛 ∈ N = {0, 1, 2, . . .} and 𝑝1 and 𝑝2 represent the maximal fatality rate for pest and natural enemy, respectively. Combining (1) and (2) yields the following model concerning IPM strategies: 𝑥 (𝑡+ ) = (1 −
𝑥̇ = 𝑓 (𝑥) − 𝜙 (𝑥) 𝑦, 𝑦̇ = 𝜇𝜙 (𝑥) 𝑦 − 𝛿𝑦,
(3) 𝑡 = 𝑛𝑇, 𝑛 ∈ N.
The biological explanations of those conditions can be found in [30–33]. The following definition and lemma are useful throughout the paper. Definition 1. The Lambert 𝑊 function is defined to be a multivalued inverse of the function 𝑧 → 𝑧𝑒𝑧 satisfying Lambert 𝑊 (𝑧) ⋅ 𝑒Lambert 𝑊(𝑧) = 𝑧.
(4)
It follows from (4) that Lambert 𝑊 (𝑧) =
Lambert 𝑊 (𝑧) . 𝑧 (1 + Lambert 𝑊 (𝑧))
(5)
Note that the function 𝑧𝑒𝑧 has the positive derivative (𝑧 + 1)𝑒𝑧 . Define the inverse function of 𝑧𝑒𝑧 restricted on the interval (−∞, −1] and [−1, +∞) to be 𝑊(−1, 𝑧) and 𝑊(0, 𝑧), respectively. There are two real branches of Lambert 𝑊 function shown in Figure 1. For more details about the concepts and properties of the Lambert 𝑊 function, see Corless et al. [34] and Waldvogel [35]. Lemma 2. Consider the following algebraic equation: 𝑔 (𝑧) = (𝑎1 𝑧 + 𝑎2 ) e𝑧 + 𝑎3 𝑧 + 𝑎2 = 0,
𝑡 ≠ 𝑛𝑇, 𝑛 ∈ N,
𝑝1 ) 𝑥, 𝑥 (𝑡+ ) = (1 − 1 + 𝑒−𝑥 𝑝 2 𝑦 (𝑡+ ) = (1 − ) 𝑦 + 𝜎, 1 + 𝑒−𝑦
(i) 𝑓(0) = 0, (ii) 𝜙(0) = 0, 𝜙 (0) > 0, and 𝜙(𝑥) > 0 for 𝑥 > 0, (iii) the function 𝑓(𝑥)/𝜙(𝑥) and 𝜙(𝑥)/𝑥 is upper bounded for 𝑥 > 0.
(6)
where 𝑎1 < 0, 𝑎2 > 0, 𝑎3 < 0, and 𝑎1 < 𝑎3 . Equation (6) with respect to 𝑧 has only one positive root provided that 𝑎1 +𝑎2 +𝑎3 > 0 and e2+(𝑎2 /𝑎1 ) ≤ 𝑎1 /𝑎3 . The proof of Lemma 2 is given in Appendix A.
Journal of Applied Mathematics
3 of a positive steady state of (12). Taking the derivative of 𝐹(𝑦𝑛 ) with respect to 𝑦𝑛 yields
3. The Existence of the Pest-Free Periodic Solution and Threshold Condition 3.1. Existence of the Pest-Free Periodic Solution. In order to illustrate the existence of a pest-free periodic solution of model (3), we consider the basic properties of following subsystem firstly: 𝑦̇ (𝑡) = −𝛿𝑦 (𝑡) ,
𝑡 ≠ 𝑛𝑇,
𝑝2 ) 𝑦 (𝑡) + 𝜎, 𝑦 (𝑡 ) = (1 − 1 + e−𝑦(𝑡) +
𝑡 = 𝑛𝑇,
(8)
] 𝑦 ((𝑛 + 1) 𝑇) + 𝜎. (9)
Substitution of (8) into (9) gives 𝑝2 ] 1 + exp {−𝑦 (𝑛𝑇+ ) 𝑒−𝛿𝑇 } +
−𝛿𝑇
× 𝑦 (𝑛𝑇 ) 𝑒
(10)
+ 𝜎.
and it is easy to see that 0 < |𝐹 (𝑦𝑛 )| < 1 holds true. Next, we discuss the positive point of the stroboscopic map (12), denoted by 𝑦∗ ; then (12) is rewritten as (𝑦∗ − 𝜎) (exp {𝑦∗ 𝑒−𝛿𝑇 } + 1)
𝑦 ((𝑛 + 1) 𝑇+ ) [(1 − 𝑝2 ) exp (𝑦 (𝑛𝑇+ ) 𝑒−𝛿𝑇 ) + 1] 𝑦 (𝑛𝑇+ ) 𝑒−𝛿𝑇 exp (𝑦 (𝑛𝑇+ ) 𝑒−𝛿𝑇 ) + 1
+ 𝜎. (11)
Denote 𝑦(𝑛𝑇+ ) = 𝑦𝑛 ; then the above equation can be rewritten as the following difference equation:
y𝑛+1 =
[(1 − 𝑝2 ) exp (𝑦𝑛 e−𝛿𝑇 ) + 1] 𝑦𝑛 𝑒−𝛿𝑇 exp (𝑦𝑛
𝑒−𝛿𝑇 )
+1
+𝜎
(12)
≐ 𝐹 (𝑦𝑛 ) , which is the so-called stroboscopic map of model (7) and describes the relations of the number of nature enemies in the population between any two successive pulse points. Consequently, the existence of the positive steady state of model (12) implies the existence of a positive periodic solution of model (7). Therefore, we first discuss the existence
(14)
Denote 𝐴 2 = 𝑦∗ 𝑒−𝛿𝑇 > 0; then (14) is rewritten as (𝑎𝐴 2 + 𝜎) 𝑒𝐴 2 + (𝑐𝐴 2 + 𝜎) = 0,
(15)
where 𝑎 = 1 − 𝑝2 − 𝑒𝛿𝑇 < 0, 𝜎 > 0, 𝑐 = 1 − 𝑒𝛿𝑇 < 0, and obviously 𝑎 < 𝑐. According to Lemma 2, (14) has a unique positive root 𝑦∗ . Therefore, there exists a positive fixed point of the stroboscopic map (12), and we denote the positive fixed point by 𝑦∗ , which satisfies the following equation: 𝑦∗ = 𝐹 (𝑦∗ ) .
That is
=
𝑝2 }
= ((1 − 𝑝2 ) exp {𝑦∗ 𝑒−𝛿𝑇 } + 1) 𝑦∗ 𝑒−𝛿𝑇 .
It follows from the second equation of model (7) that
𝑦 ((𝑛 + 1) 𝑇+ ) = [1 −
2
(13)
𝑦 (𝑡) = 𝑦 (𝑛𝑇+ ) 𝑒−𝛿(𝑡−𝑛𝑇) .
1 + 𝑒−𝑦((𝑛+1)𝑇)
[exp (𝑦𝑛 𝑒−𝛿𝑇 ) + 1]
× e−𝛿𝑇 ,
It follows from model (7) that, for any time internal (𝑛𝑇, (𝑛 + 1)𝑇], we integrate the first equation of model (7) and get
𝑦 ((𝑛 + 1) 𝑇 ) = [1 −
[exp (𝑦𝑛 𝑒−𝛿𝑇 ) + 1 − 𝑦𝑛 𝑒−𝛿𝑇 exp (𝑦𝑛 𝑒−𝛿𝑇 )]
(7)
𝑦 (0 ) = 𝑦0 .
𝑝2
= { (1 − 𝑝2 )
+
+
+
𝐹 (𝑦𝑛 )
(16)
According to the relations between a fixed point of the stroboscopic map (12) and the periodic solution of model (7), we conclude that submodel (7) has a unique nontrivial positive periodic solution, denoted by 𝑦𝑝 (𝑡), and 𝑦𝑝 (𝑡) = 𝑦∗ e−𝛿(𝑡−𝑛𝑇)
for 𝑛𝑇 < 𝑡 ≤ (𝑛 + 1) 𝑇,
(17)
and it follows from 0 < |𝐹 (𝑦𝑝 (𝑡))| < 1. Therefore, we obtain the general expression of the pestfree periodic solution of model (3) over the interval 𝑛𝑇 < 𝑡 ≤ (𝑛 + 1)𝑇 for all 𝑛 ∈ N denoted by (𝑥𝑝 (𝑡) , 𝑦𝑝 (𝑡)) = (0, 𝑦∗ 𝑒−𝛿(𝑡−𝑛𝑇) ) ,
(18)
where 𝑦∗ is determined by the difference equation (14). Theorem 3. Model (7) has a positive periodic solution 𝑦𝑝 (𝑡) with period 𝑇 and for every solution 𝑦(𝑡) of (7) such that |𝑦(𝑡)− 𝑦𝑝 (𝑡)| → 0 as 𝑡 → +∞, where 𝑦𝑝 (𝑡) = 𝑦∗ 𝑒−𝛿(𝑡−𝑛𝑇) , and 𝑦∗ is the positive root of (14). By using Theorem 3, we have that the unique fixed point 𝑦∗ of (12) is globally stable. According to the stability of
4
Journal of Applied Mathematics
positive periodic solution, it is determined by the stability of positive equilibria of difference equation made by the sequence of impulsive points. So, the positive periodic solution 𝑦𝑝 (𝑡) of model (7) is globally stable. Therefore, model (3) exists as a unique pest-free periodic solution (0, 𝑦𝑝 (𝑡)).
response for 𝜙(𝑥); that is, 𝜙(𝑥) = 𝛼𝑥/(1 + 𝜔𝑥). Thus model (3) becomes as the following special model:
3.2. Stability of the Pest-Free Periodic Solution. The threshold conditions which guarantee the global stability of pest-free periodic solution (𝑥𝑝 (𝑡), 𝑦𝑝 (𝑡)) play a key role in pest control. To do this, we first prove the local stability which can be determined by considering the behavior of small amplitude perturbations of the solution. So we denote (𝑥(𝑡), 𝑦(𝑡)) so that
𝑥 (𝑡+ ) = (1 −
𝑥 (𝑡) = 𝑥 (𝑡) − 𝑥𝑝 (𝑡) ,
(19)
𝑦 (𝑡) = 𝑦 (𝑡) − 𝑦𝑝 (𝑡) .
𝑥̇ = 𝑓 (𝑥) − 𝜙 (𝑥) [𝑦 + 𝑦𝑝 (𝑡)] ,
(20)
𝑦̇ = 𝜇𝜙 (𝑥) [𝑦 + 𝑦𝑝 (𝑡)] − 𝛿𝑦.
𝑥̇ = [𝑓 (0) − 𝜙 (0) 𝑦𝑝 (𝑡)] 𝑥,
(21)
𝑦̇ = 𝜇𝜙 (0) 𝑦𝑝 (𝑡) 𝑥 − 𝛿𝑦.
In the following, we will present the sufficient condition for the global attractivity of pest-free periodic solution (𝑥𝑝 (𝑡), 𝑦𝑝 (𝑡)) of model (3). Theorem 4. The pest-free periodic solution (𝑥𝑝 (𝑡), 𝑦𝑝 (𝑡)) of model (3) is locally stable in the first quadrant provided that 𝑝1 ∫𝑇 [𝑓 (0)−𝜙 (0)𝑦𝑝 (𝑡)]d𝑡 0 provided (1 +
𝑎 𝑎2 ) < 𝑊 [0, − 3 e1+(𝑎2 /𝑎1 ) ] ≤ 0, 𝑎1 𝑎1
(A.6)
Journal of Applied Mathematics
7 0.5 0.4
9
x 0.3
8.8
0.2 8.6 y
0.1 1.2
8.4
1.4
1.6
t
1.8 ×10⁴
(b) 8.2 9
8 y
7.8
8.5 8
7.6 0.1
0.2
0.3
0.4
0.5
7.5
1.2
1.4
1.6 t (c)
x (a)
1.8
×104
Figure 5: A typical quasiperiodic solution of model (24) over 𝑡 ∈ [11300, 19000]. (a) Phase portrait of 𝑥 and 𝑦 with 𝑡; (b) time series of 𝑥, and (c) time series of 𝑦. The other parameters are identical to those in Figure 4 and 𝑇 = 7.8.
which is equivalent to 𝑎1 + 𝑎2 + 𝑎3 > 0,
𝑎1 + 𝑎2 > 0.
(A.7)
That is, 𝑎1 + 𝑎2 + 𝑎3 > 0. Similarly, 𝑧2∗ > 0 provided 1+
𝑎 𝑎2 < 𝑊 [−1, − 3 𝑒1+(𝑎2 /𝑎1 ) ] ≤ −1, 𝑎1 𝑎1
(A.8)
which is equivalent to
where Φ(0) = 𝐼 is the identity matrix and the term ⋆ is not necessarily computed in detail as it is not required in the following analysis. Resetting the impulsive conditions of model (3) from third and fourth equations becomes 𝑥 (𝑛𝑇+ ) ) ( 𝑦 (𝑛𝑇+ ) 1−
𝑎1 + 𝑎2 + 𝑎3 < 0,
2𝑎1 + 𝑎2 > 0.
(A.9)
Since 𝑎1 < 𝑎3 , the above two inequalities cannot be true simultaneously. This indicates that the function 𝑔(𝑧) exists an unique extreme value just at 𝑧1∗ . Furthermore, it follows from (6) that
=(
𝑝1 2
0
0
1−
𝑝2 𝑦𝑝 (𝑛𝑇) 𝑒−𝑦𝑝 (𝑛𝑇) ) 𝑝2 − 2 1 + 𝑒−𝑦𝑝 (𝑛𝑇) (1 + 𝑒−𝑦𝑝 (𝑛𝑇) )
𝑥 (𝑛𝑇) ×( ). 𝑦 (𝑛𝑇)
𝑔 (𝑧) → −∞ as 𝑧 → +∞. (A.10)
(B.2)
Therefore, the function 𝑔(𝑧) = 0 always exists as a unique root if the conditions of Lemma 2 are true. The proof is completed.
Hence, according to Floquet theory [38], if the module of both eigenvalues of the matrix
𝑔 (0) = 𝑎2 > 0,
𝑀 = 𝐵 (𝑇) Φ (𝑇)
B. Proof of Theorem 4 To proof the local stability of the solution (𝑥𝑝 (𝑡), 𝑦𝑝 (𝑡)) of (3), we need to investigate the difference equation determined by the impulsive period 𝑇 with respect to the linear equation (20). Let Φ(𝑇) be the fundamental matrix of (20); thus Φ(𝑇) must satisfy 𝑇 ∫0 [𝑓 (0)−𝜙 (0)𝑦𝑝 (𝑡)]d𝑡
Φ (𝑇) = (𝑒
⋆
0 ), 𝑒−𝛿𝑇
(B.1)
1− = (
𝑝1 2
0 𝑇
0 1−
𝑝2 𝑦𝑝 (𝑇) 𝑒−𝑦𝑝 (𝑇) ) 𝑝2 − 2 1 + 𝑒−𝑦𝑝 (𝑇) (1 + 𝑒−𝑦𝑝 (𝑇) )
∫0 [𝑓 (0)−𝜙 (0)𝑦𝑝 (𝑡)]d𝑡 0 ) × (𝑒 ⋆ 𝑒−𝛿𝑇
(B.3)
8
Journal of Applied Mathematics
1
1
0.8
0.8
x 0.6
x 0.6
0.4
0.4
0.2
0.2
0 200
250 t
0 200
300
250 t
(a)
300
(c)
14
14
12
12
10
10
y
y 8
8
6
6
4
4
200
250 t
300
200
250 t
(b)
300
(d)
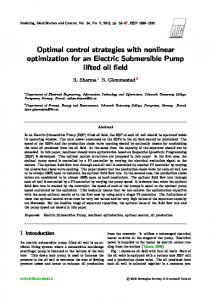
Figure 6: Coexistence of two stable attractors of model (24) for 𝜎 = 5, and the initial conditions from left to right are (𝑥0 , 𝑦0 ) = (1, 1.2), (2, 3). The other parameters are identical to those in Figure 3.
is less than one, then the periodic solution (𝑥𝑝 (𝑡), 𝑦𝑝 (𝑡)) is locally stable. In fact, two Floquet multiplies are thus 𝑝1 ∫𝑇 [𝑓 (0)−𝜙 (0)𝑦𝑝 (𝑡)]𝑑𝑡 , )𝑒 0 2 𝑝2 𝑦𝑝 (𝑇) e−𝑦𝑝 (𝑇) −𝛿𝑇 𝑝2 𝑒 . 𝜆 2 = 1 − − 2 1 + 𝑒−𝑦𝑝 (𝑇) (1 + 𝑒−𝑦𝑝 (𝑇) ) 𝜆 1 = (1 −
(B.4)
𝑝2 𝑦𝑝 (𝑇) 𝑒−𝑦𝑝 (𝑇) −𝛿𝑇 𝑝2 𝑒 − 1 − −𝑦𝑝 (𝑇) −𝑦𝑝 (𝑇) 2 1 + 𝑒 (1 + 𝑒 )
𝑝2 𝑦𝑝 (𝑇) 𝑒𝑦𝑝 (𝑇) −𝛿𝑇 𝑝2 𝑒𝑦𝑝 (𝑇) 𝑒 = 1 − − 𝑦𝑝 (𝑇) 𝑦𝑝 (𝑇) 2 1 + 𝑒 (1 + 𝑒 )
The pest-free solution (𝑥𝑝 (𝑡), 𝑦𝑝 (𝑡)) is locally stable if |𝜆 1 | < 1, |𝜆 2 | < 1; that is, 𝑝1 ∫𝑇 [𝑓 (0)−𝜙 (0)𝑦𝑝 (𝑡)]𝑑𝑡 < 1, )𝑒 0 2 𝑝2 𝑦𝑝 (𝑇) 𝑒−𝑦𝑝 (𝑇) −𝛿𝑇 𝑝2 𝑒 − < 1, 1 − −𝑦𝑝 (𝑇) −𝑦𝑝 (𝑇) 2 1 + 𝑒 (1 + 𝑒 )
and by simple calculation, we have that
(1 −
(B.5)
(B.6)
≤ 1 − 2𝑝2 < 1
holds true. The pest-free solution (𝑥𝑝 (𝑡), 𝑦𝑝 (𝑡)) is locally stable if |𝜆 1 | < 1, which holds true due to 𝑅1 < 1. In order to prove the global attractivity, we should prove that 𝑥 tends to zero, and it follows that 𝑦 tends to zero; that is, 𝑦(𝑡) approximates to 𝑦𝑝 (𝑡).
Journal of Applied Mathematics
9
1.2 1.1 1
1
0.9
x
x
0.8
0.8
0.7 0.6
0.6 0
200
400
0
600
100
200
t
t
(a)
(c)
300
400
500
300
400
500
14 12
12
10
10 y
y 8
8
6
6
4
4 0
200
400
600
0
100
200
t
t
(b)
(d)
Figure 7: Attractors switch-like behaviors of model (24) with initial conditions from left to right are (𝑥0 , 𝑦0 ) = (0.99, 4.4), (0.95, 4.45). The other parameters are identical to those in Figure 6.
In order to investigate the first equation of (20), that is, 𝑥̇ equation, we define function
𝐺 (𝑥) = ∫
𝑥
𝑥0
Figure 8: Basin of attraction of two attractors shown in Figure 6. The range of 0.01 ≤ 𝑥 ≤ 35 is on the horizontal axis, 0.01 ≤ 𝑦 ≤ 100 is on the vertical axis; the parameters are identical to Figure 6. The white and black points are attracted to the attractor shown in Figure 6 from left to right, respectively.
It follows from 𝑦̇ ≥ −𝛿𝑦 and impulsive conditions that for any initial condition (𝑥0 , 𝑦0 ) we have 𝑦 ≥ min(0, 𝑦0 )𝑒−𝛿𝑡 ≐ 𝑦𝑚 (𝑡).
1 d𝑠. 𝜙 (𝑠)
(B.7)
Since 𝜙(𝑥) > 0, it is easy to see that the function 𝐺(𝑥) can be seen to be an increasing function of 𝑥 from 𝑥 = 0. Thus, if we can prove that 𝐺(𝑥) → −∞ as 𝑡 → ∞, then the pest population will die out eventually. From the definition of 𝐺(𝑥) function we have
dG (x) 1 ̇ 𝑓 (𝑥) 𝑥= = − 𝑦 (𝑡) − 𝑦𝑝 (𝑡) dt 𝜙 (𝑥) 𝜙 (𝑥) 𝑓 (𝑥) ≤ − 𝑦𝑚 (𝑡) − 𝑦𝑝 (𝑡) . 𝜙 (𝑥)
(B.8)
10
Journal of Applied Mathematics
Based on the definition of 𝐺(𝑥), we integrate 𝐺(𝑥) between two successive release predator interval, that is, the time interval (𝑛𝑇, (𝑛 + 1)𝑇] for all 𝑛 ∈ N; that is,
hold true, then we have that 𝐺(𝑥) → ∞ as 𝑡 → ∞. That is, 𝑇
𝐺 (𝑥 ((𝑛 + 1) 𝑇 )) =∫
𝑥((𝑛+1)𝑇+ )
𝑥0
=∫
𝑥((𝑛+1)𝑇)
𝑥0
+
x((n+1)T ) 1 1 ds + ∫ ds 𝜙 (𝑠) 𝜙 (s) x((n+1)T) 𝑥((𝑛+1)𝑇+ )
𝑥((𝑛+1)𝑇)
𝛿 𝑦̇ = 𝜇𝜙 (𝑥) [𝑦 + 𝑦𝑝 (𝑡)] − 𝛿𝑦 ≤ 𝜇𝜙 (𝑥) 𝑦𝑝 (𝑡) − 2
1 ds 𝑚𝑠 𝑠
≤ 𝐺 (𝑥 (𝑛𝑇+ )) (𝑛+1)𝑇
𝑛𝑇+
+∫
[
𝑓 (𝑥 (𝑠)) − 𝑦𝑚 (𝑠) − 𝑦𝑝 (𝑠)] ds 𝜙 (𝑥 (𝑠))
[1−𝑝(𝑥((𝑛+1)𝑇))]𝑥((𝑛+1)𝑇)
𝑥((𝑛+1)𝑇)
= 𝐺 (𝑥 (𝑛𝑇+ )) + ∫
(𝑛+1)𝑇
𝑛𝑇+
+
1 ds 𝑚𝑠 𝑠
(𝑛+1)𝑇
[𝑀𝑠 − 𝑦𝑚 (𝑠) − 𝑦𝑝 (𝑠)] ds
𝑡
ln (1 − 𝑝max ) ≤ ∫ [𝑀𝑠 − 𝑦𝑚 (𝑠) − 𝑦𝑝 (𝑠)] d𝑠 + 𝑙 𝑚𝑠 0 0
𝑙𝑇
= − ∫ 𝑦𝑚 (𝑠) d𝑠 + ∫ [𝑀𝑠 − 𝑦𝑝 (𝑠)] d𝑠 𝑇
+ 𝑙 ∫ [𝑀𝑠 − 𝑦𝑝 (𝑠)] d𝑠 + 𝑙 0
=
ln (1 − 𝑝1 ) 𝑚𝑠
(B.10)
𝑡 min (0, 𝑦0 ) −𝛿𝑡 (𝑒 − 1) + ∫ [𝑀𝑠 − 𝑦𝑝 (𝑠)] ds 𝛿 𝑙𝑇 𝑇
+ 𝑙 ∫ [𝑀𝑠 − 𝑦𝑝 (𝑠)] ds + l 0
ln (1 − p1 ) . ms
The first and second terms of the right-hand side are upper bounded due to the periodicity of 𝑦𝑝 (𝑡) with periodic 𝑇𝑝 . Note that 𝑙 → ∞ as 𝑡 → ∞. Therefore, if 𝑇
∫ [𝑀𝑠 − 𝑦𝑝 (s)] ds + 0
ln (1 − p1 ) 𝑡𝑠 . It follows from 𝑥 → 0 as 𝑡 → ∞ and the periodicity of 𝑦𝑝 (𝑡) that we have 𝜙(𝑥)𝑦𝑝 (𝑡) → 0 as 𝑡 → ∞. Consequently, 𝑦 → 0 as 𝑡 → ∞. Those indicate that if the inequality of (B.12) holds, then the pest-free periodic solution (𝑥𝑝 (𝑡), 𝑦𝑝 (𝑡)) is globally attractive, and in combination with local stability we can conclude the periodic solution (𝑥𝑝 (𝑡), 𝑦𝑝 (𝑡)) of model (3).
Acknowledgments
For any 𝑡 there exists an integer 𝑙 such that 𝑡 ∈ (𝑙𝑇, (𝑙 + 1)𝑇], so according to the periodicity of 𝑦𝑝 (𝑠) and for all 𝑡 > 0 we have 𝐺 (𝑥 (𝑡)) − 𝐺 (𝑥0 )
𝑡
(B.13)
The authors declare that there is no conflict of interests regarding the publication of this paper.
[𝑀𝑠 − 𝑦𝑚 (𝑠) − 𝑦𝑝 (s)] ds
ln (1 − 𝑝1 ) . 𝑚𝑠
𝑡
(B.12)
Conflict of Interests
𝑚𝑠 𝑛𝑇+
+
(B.9)
ln [1 − 𝑝1 / (1 + 𝑒−𝑥(𝑛𝑇) )]
≤ 𝐺 (𝑥 (𝑛𝑇+ )) + ∫
≤ 1.
So 𝑥(𝑡) tends to zero as 𝑡 → ∞ provided (B.12). Now we prove that 𝑦(𝑡) → 0 as well. Since 𝑥 → 0, so there is a finite time 𝑡𝑠 such that 𝜙(𝑥) ≤ 𝛿/2. Therefore we have
1 ds 𝜙 (𝑠)
≤ 𝐺 (𝑥 ((𝑛 + 1) 𝑇)) + ∫
+∫
𝑇𝑀𝑠 𝑚𝑠
𝑚𝑠 ∫0 𝑦𝑝 (𝑠) d𝑠 − ln (1 − 𝑝1 )
+
(B.11)
This work is supported by the National Natural Science Foundation of China (NSFCs, 11171199, 11371030, and 11301320) and the Fundamental Research Funds for the Central Universities (GK201305010). The authors would like to thank the editor and the referees for their careful reading of the original paper and many valuable comments and suggestions that greatly improved the presentation of this paper.
References [1] M. L. Flint, “Integrated pest management for walnuts,” in University of California Statewide Integrated Pest Management Project, vol. 3270, p. 3641, Division of Agriculture and Natural Resources, University of California, Oakland, Calif, USA, 2nd edition, 1987. [2] J. C. Van Lenteren, “Integrated pest management in protected crops,” in Integrated Pest Management, pp. 311–320, Chapman & Hall, London, UK, 1995. [3] J. C. Van Lenteren and J. Woets, “Biological and integrated pest control in greenhouses,” Annual Review of Entomology, vol. 33, no. 4, pp. 239–250, 1988. [4] J. C. Van Lenteren, “Measures of success in biological control of arthropods by augmentation of natural enemies,” in Measures of Success in Biological Control, S. Wratten and G. Gurr, Eds., pp. 77–89, Kluwer Academic Publishers, Dordrecht, The Netherlands, 2000. [5] J. C. Van Lenteren, “Environmental manipulation advantageous to natural enemies of pests,” in Integrated Pest Management, V. Delucchi, Ed., pp. 123–166, Parasitis, Geneva, Switzerland, 1987. [6] Y. N. Xiao and F. Van den Bosch, “The dynamics of an ecoepidemic model with biological control,” Ecological Modelling, vol. 168, no. 1-2, pp. 203–214, 2003.
Journal of Applied Mathematics [7] H. J. Barclay, “Models for pest control using predator release, habitat management and pesticide release in combination,” Journal of Applied Ecology, vol. 19, no. 2, pp. 337–348, 1982. [8] H. J. Barclay and P. Van den Diressche, “Predator-prey models with added mortality,” Canadian Entomologist, vol. 109, no. 5, pp. 763–768, 1977. [9] N. D. Barlow, H. Moller, and J. R. Beggs, “A model for the effect of Sphecophaga vesparum as a biological control agent of the common wasp in New Zealand,” Journal of Applied Ecology, vol. 33, no. 1, pp. 31–44, 1996. [10] S. Y. Tang and L. S. Chen, “Modelling and analysis of integrated pest management strategy,” Discrete and Continuous Dynamical Systems. Series B, vol. 4, no. 3, pp. 759–768, 2004. [11] S. Y. Tang, Y. N. Xiao, L. S. Chen, and R. A. Cheke, “Integrated pest management models and their dynamical behaviour,” Bulletin of Mathematical Biology, vol. 67, no. 1, pp. 115–135, 2005. [12] S. Y. Tang, Y. N. Xiao, and D. Clancy, “New modelling approach concerning integrated disease control and cost-effectivity,” Nonlinear Analysis: Theory, Methods & Applications, vol. 63, no. 3, pp. 439–471, 2005. [13] S. Y. Tang, Y. N. Xiao, and R. A. Cheke, “Multiple attractors of host-parasitoid models with integrated pest management strategies: eradication, persistence and outbreak,” Theoretical Population Biology, vol. 73, no. 2, pp. 181–197, 2008. [14] S. Y. Tang, G. Y. Tang, and R. A. Cheke, “Optimum timing for integrated pest management: modelling rates of pesticide application and natural enemy releases,” Journal of Theoretical Biology, vol. 264, no. 2, pp. 623–638, 2010. [15] S. Y. Tang, J. H. Liang, Y. S. Tan, and R. A. Cheke, “Threshold conditions for integrated pest management models with pesticides that have residual effects,” Journal of Mathematical Biology, vol. 66, no. 1-2, pp. 1–35, 2013. [16] J. H. Liang, S. Y. Tang, and R. A. Cheke, “An integrated pest management model with delayed responses to pesticide applications and its threshold dynamics,” Nonlinear Analysis: Real World Applications, vol. 13, no. 5, pp. 2352–2374, 2012. [17] J. H. Liang, S. Y. Tang, R. A. Cheke, and J. H. Wu, “Adaptive release of natural enemies in a pest-natural enemy system with pesticide resistance,” Bulletin of Mathematical Biology, vol. 75, no. 11, pp. 2167–2195, 2013. [18] J. H. Liang, S. Y. Tang, J. J. Nieto, and R. A. Cheke, “Analytical methods for detecting pesticide switches with evolution of pesticide resistance,” Mathematical Biosciences, vol. 245, no. 2, pp. 249–257, 2013. [19] P. Georgescu, H. Zhang, and L. S. Chen, “Bifurcation of nontrivial periodic solutions for an impulsively controlled pest management model,” Applied Mathematics and Computation, vol. 202, no. 2, pp. 675–687, 2008. [20] B. Liu, L. S. Chen, and Y. J. Zhang, “The dynamics of a preydependent consumption model concerning impulsive control strategy,” Applied Mathematics and Computation, vol. 169, no. 1, pp. 305–320, 2005. [21] N. Baharanyi, N. O. Tackie, A. Pierce, C. Woolery, and R. Hopkinson, “The impact of an integrated marketing and educational strategy mix on the Montgomery State Farmers Market-Phase I,” Prepared for the College of Agricultural, Environmental and Natural Sciences, Tuskegee University, Tuskegee, AL and the Alabama Department of Agriculture and Industries, Montgomery, Ala, USA, 1993. [22] N. O. Tackie, H. J. Findlay, and N. Baharanyi, “Farm products marketing practices by limited resource farmers,” Journal of Agribusiness, vol. 16, no. 1, pp. 43–51, 1998.
11 [23] N. O. Tackie, J. E. N. Jackai, R. Ankumah, R. Noble, and M. Collins, “Perceptions of small farmers on marketing farm products,” in Applied Economics and Related Sciences, Number 0604-01, George Washington Carver Agricultural Experiment Station, Tuskegee University, Tuskegee, Ala, USA, 2004. [24] N. O. Tackie, L. E. N. Jackai, R. Ankumah, B. N. Dingha, A.W. Salifu, and O. Ojumu, “Integrated pest management and protection practices by limited resource farmers,” Journal of Extension, vol. 47, no. 1, Article ID 1RIB6, 2009. [25] M. J. Reynolds-Hogland, L. B. Pacifici, and M. S. Mitchell, “Linking resources with demography to understand resource limitation for bears,” Journal of Applied Ecology, vol. 44, no. 6, pp. 1166–1175, 2007. [26] A. J. Lotka, “Undamped oscillations derived from the law of mass action,” Journal of the American Chemical Society, vol. 42, no. 8, pp. 1595–1599, 1920. [27] V. Volterra, “Variations and fluctuations of a number of individuals in animal species living together,” in Animal Ecology, R. N. Chapman, Ed., pp. 440–448, McGraw-Hill, New York, NY, USA, 1931. [28] Y. Ito, “Representation of functions by superpositions of a step or sigmoid function and their applications to neural network theory,” Neural Networks, vol. 4, no. 3, pp. 385–394, 1991. [29] L. E. Yelle, “The learning curve: historical review and comprehensive survey,” Decision Sciences, vol. 10, no. 2, pp. 302–328, 1979. [30] L. Mailleret and F. Grognard, “Global stability and optimisation of a general impulsive biological control model,” Mathematical Biosciences, vol. 221, no. 2, pp. 91–100, 2009. [31] S. Nundloll, L. Mailleret, and F. Grognard, “The effect of partial crop harvest on biological pest control,” Rocky Mountain Journal of Mathematics, vol. 38, no. 5, pp. 1633–1661, 2008. [32] S. Nundloll, L. Mailleret, and F. Grognard, “Two models of interfering predators in impulsive biological control,” Journal of Biological Dynamics, vol. 4, no. 1, pp. 102–114, 2010. [33] S. Nundloll, L. Mailleret, and F. Grognard, “Influence of Intrapredatory Interferences on Impulsive Biological Control Efficiency,” Bulletin of Mathematical Biology, vol. 72, no. 8, pp. 2113–2138, 2010. [34] R. M. Corless, G. H. Gonnet, D. E. G. Hare, and D. J. Jeffrey, “On the Lambert W function,” Advances in Computational Mathematics, vol. 5, no. 1, pp. 329–359, 1996. [35] J. Waldvogel, “The period in the Volterra-Lotka predator-prey modle,” SIAM Journal on Numerical Analysis, vol. 20, no. 6, pp. 1264–1272, 1983. [36] S. Y. Tang and L. S. Chen, “Multiple attractors in stagestructured population models with birth pulses,” Bulletin of Mathematical Biology, vol. 65, no. 3, pp. 479–495, 2003. [37] Y. N. Xiao and S. Y. Tang, “The effect of initial density and parasitoid intergenerational survival rate on classical biological control,” Chaos, Solitons & Fractals, vol. 37, no. 4, pp. 1048–1058, 2008. [38] A. Lakmeche and O. Arino, “Bifurcation of non trivial periodic solutions of impulsive differential equations arising chemotherapeutic treatment,” Dynamics of Continuous, Discrete and Impulsive Systems, vol. 7, no. 2, pp. 265–287, 2000.
Advances in
Operations Research Hindawi Publishing Corporation http://www.hindawi.com
Volume 2014
Advances in
Decision Sciences Hindawi Publishing Corporation http://www.hindawi.com
Volume 2014
Journal of
Applied Mathematics
Algebra
Hindawi Publishing Corporation http://www.hindawi.com
Hindawi Publishing Corporation http://www.hindawi.com
Volume 2014
Journal of
Probability and Statistics Volume 2014
The Scientific World Journal Hindawi Publishing Corporation http://www.hindawi.com
Hindawi Publishing Corporation http://www.hindawi.com
Volume 2014
International Journal of
Differential Equations Hindawi Publishing Corporation http://www.hindawi.com
Volume 2014
Volume 2014
Submit your manuscripts at http://www.hindawi.com International Journal of
Advances in
Combinatorics Hindawi Publishing Corporation http://www.hindawi.com
Mathematical Physics Hindawi Publishing Corporation http://www.hindawi.com
Volume 2014
Journal of
Complex Analysis Hindawi Publishing Corporation http://www.hindawi.com
Volume 2014
International Journal of Mathematics and Mathematical Sciences
Mathematical Problems in Engineering
Journal of
Mathematics Hindawi Publishing Corporation http://www.hindawi.com
Volume 2014
Hindawi Publishing Corporation http://www.hindawi.com
Volume 2014
Volume 2014
Hindawi Publishing Corporation http://www.hindawi.com
Volume 2014
Discrete Mathematics
Journal of
Volume 2014
Hindawi Publishing Corporation http://www.hindawi.com
Discrete Dynamics in Nature and Society
Journal of
Function Spaces Hindawi Publishing Corporation http://www.hindawi.com
Abstract and Applied Analysis
Volume 2014
Hindawi Publishing Corporation http://www.hindawi.com
Volume 2014
Hindawi Publishing Corporation http://www.hindawi.com
Volume 2014
International Journal of
Journal of
Stochastic Analysis
Optimization
Hindawi Publishing Corporation http://www.hindawi.com
Hindawi Publishing Corporation http://www.hindawi.com
Volume 2014
Volume 2014