PHYSICAL REVIEW PHYSICS EDUCATION RESEARCH 12, 010108 (2016)
Generalizing a categorization of students’ interpretations of linear kinematics graphs Laurens Bollen,1,* Mieke De Cock,1,† Kristina Zuza,2,‡ Jenaro Guisasola,2,§ and Paul van Kampen3,∥ 1
Department of Physics and Astronomy, KU Leuven, Celestijnenlaan 200c, 3001 Leuven, Belgium 2 Department of Applied Physics, University of Basque Country, Plaza Europa 1, San Sebastian 20018, Spain 3 Centre for the Advancement of STEM Teaching and Learning & School of Physical Sciences, Dublin City University, Glasnevin, Dublin 9, Ireland (Received 23 September 2015; published 18 February 2016)
We have investigated whether and how a categorization of responses to questions on linear distance-time graphs, based on a study of Irish students enrolled in an algebra-based course, could be adopted and adapted to responses from students enrolled in calculus-based physics courses at universities in Flanders, Belgium (KU Leuven) and the Basque Country, Spain (University of the Basque Country). We discuss how we adapted the categorization to accommodate a much more diverse student cohort and explain how the prior knowledge of students may account for many differences in the prevalence of approaches and success rates. Although calculus-based physics students make fewer mistakes than algebra-based physics students, they encounter similar difficulties that are often related to incorrectly dividing two coordinates. We verified that a qualitative understanding of kinematics is an important but not sufficient condition for students to determine a correct value for the speed. When comparing responses to questions on linear distance-time graphs with responses to isomorphic questions on linear water level versus time graphs, we observed that the context of a question influences the approach students use. Neither qualitative understanding nor an ability to find the slope of a context-free graph proved to be a reliable predictor for the approach students use when they determine the instantaneous speed. DOI: 10.1103/PhysRevPhysEducRes.12.010108
I. INTRODUCTION This paper examines the generalizability and applicability of a categorization of students’ responses to questions concerning numerical linear distance-time graphs developed by Wemyss and van Kampen [1], referred to as [1] from now on. They based their categorization on responses from science students at Dublin City University (DCU) in Ireland. The categories were based on the level of understanding that students show and the difficulties they have with scientific models, similar to the categorization schemes used by Close and Heron, and Mashood and Singh [2–4]. In this paper we analyze the responses from 700 students in two different universities in two different countries, KU Leuven in Belgium and the University of the Basque Country in Spain (UPV/EHU) to translated versions of the questions in [1]. The questions concerned *
[email protected] [email protected] ‡
[email protected] §
[email protected] ∥
[email protected] †
Published by the American Physical Society under the terms of the Creative Commons Attribution 3.0 License. Further distribution of this work must maintain attribution to the author(s) and the published article’s title, journal citation, and DOI.
2469-9896=16=12(1)=010108(10)
three kinds of linear graphs that do not pass through the origin: distance-time, water level versus time, and contextfree. [5] The DCU students were enrolled in an algebrabased course; three quarters of them had not taken the equivalent of high school physics, and almost none had taken the equivalent of high school calculus. Students at KU Leuven and UPV/EHU were enrolled in a calculusbased course and had more extensive prior knowledge of both calculus-based physics and mathematics. The analysis of responses from such very different cohorts of students provides a severe test for the original categorization. The main findings of [1] are the following: on a pretest, two-thirds of the DCU students could determine the direction of motion from a linear distance-time graph not passing through the origin. Constancy of the speed was determined by about three-quarters of the students. Their responses comprised three categories: (i) reasoning based on the line being straight or the slope being constant, (ii) interval-based reasoning, and (iii) other reasoning. Only 20% of the students correctly determined the instantaneous speed by calculating Δx=Δt, while over half of them calculated x=t. The reason students gave for the constancy of the speed did not correlate with successfully determining a value for the speed. In addition, it was shown that the ability to determine the slope of a context-free graph and having a correct qualitative understanding of a distance-time graph are not sufficient to correctly determine the numerical value of the
010108-1
Published by the American Physical Society
LAURENS BOLLEN et al.
PHYS. REV. PHYS. EDUC. RES. 12, 010108 (2016)
instantaneous speed. Finally, the students responded to isomorphic questions on water level versus time graphs more successfully than those on distance-time graphs. In Sec. II we give an overview of the literature on graphs in kinematics. In Sec. III we discuss the research design in three steps: we list our research questions (Section III A), describe the educational contexts at KU Leuven, UPV/ EHU, and DCU (Section III B), and explain the data collection and analysis procedure (Section III C). We summarize and discuss the results of our study in Sec. IV, including detailed comparisons to the findings at DCU and other results from earlier research dealing with linear graphs. We summarize our conclusions in Sec. V. II. LITERATURE OVERVIEW The representational format and context of a question are important factors in the problem-solving strategy students choose and the corresponding success rate [6–11]. Moreover, students’ opinions of their skills in dealing with different representations correlate poorly with their actual performances [12]. It is therefore important to examine students’ approaches to and difficulties with particular representational formats [7,13]. This work focuses on students’ interpretations of linear graphs in two different kinematics contexts and compares these results to the responses in a context-free setting. Earlier research has shown that students encounter a lot of difficulties with linear graphs in physics and mathematics. In a review paper, Leinhardt et al. distinguished three categories of incorrect student responses: interval–point confusion, slope–height confusion, and iconic interpretations [14]. Interval–point confusion occurs when students narrow their focus down to a single point even though a range of points is more appropriate. However, Preece argued this may often be a consequence of an ambiguous wording of the question [15]. Slope-height confusion takes place when students confuse the slope of a graph with the coordinates at a certain moment [16–19]. Iconic interpretation, often called graph-as-picture error, contains mistakes related to the interpretation or construction of graphs as if it were a photographlike replication of the path traveled by an object [16–21]. Beichner designed the Test of Understanding Graphs in Kinematics (TUG-K) and observed that only about one out of four students could determine the slope of a graph that does not pass through the origin, whereas 73% could do this when the line did go through the origin [16]. Likewise, students at DCU tended to use a formula where distance is divided by time (v ¼ x=t or similar) when asked about the speed at a particular instant [1]. Beichner also noted that students in calculus-based physics courses performed significantly better than those in algebra or trigonometrybased courses [16]. Therefore, it is interesting to compare the students from KU Leuven and UPV/EHU with those of DCU and investigate to which extent the findings by
Wemyss and van Kampen can be generalized to calculusbased physics students. Another topic relevant to this paper is the transfer of mathematical knowledge and skills regarding linear graphs to a physical context. Christensen and Thompson argued that students have difficulties with graphs in physics because they do not possess the required mathematical knowledge [22]. Planinic et al. showed that, contrary to teachers’ expectations, students encounter more difficulties with determining the slope of a line graph in physics than in isomorphic mathematics problems. They also found that students having the necessary mathematical knowledge does not guarantee success on isomorphic questions with physics (or other) contexts. While the same difficulties were observed, slope– height confusion (i.e., confusing the ordinate of a point with the slope at that point) occurred remarkably more frequently in the context of physics than in the context of mathematics [23,24]. Knockaert corroborated these results for Belgian high school students, and noticed they fared significantly worse with questions containing a graph than with analogous problems that use symbolic representations [11]. In Sec. III we discuss the design of our project and the influence of the results from these earlier studies. In Sec. IV we compare our results with some of the findings described above. III. RESEARCH DESIGN A. Research questions Our main concern is whether the categorization valid for responses from students enrolled in an algebra-based course at DCU in Ireland [1] may be adopted or adapted to characterize the responses from students enrolled in calculus-based courses at KU Leuven (Flanders, Belgium) and UPV/EHU (Basque Country, Spain). We focus on the categorization itself rather than the prevalences of the students’ responses. The research questions on students’ approaches to linear graphs are (1) To what extent do students from different educational backgrounds have similar approaches to identifying the direction of motion? (2) Can a common categorization for the reasoning about the constancy of the speed and the determination of instantaneous speed be developed? (3) Do students adopt different approaches depending on the context of the questions? (4) To what extent are qualitative understanding of kinematics graphs and the ability to determine the slope of a context-free graph sufficient to correctly determine the instantaneous speed, and can they predict the approach students will use? B. Educational context Student responses were obtained at KU Leuven in Flanders, Belgium and at UPV/EHU in the Basque
010108-2
GENERALIZING A CATEGORIZATION OF …
PHYS. REV. PHYS. EDUC. RES. 12, 010108 (2016)
Country, Spain. In both countries, the high school (secondary school) curriculum includes topics on motion in one and two dimensions, motion with constant acceleration, circular motion, and projectile motion. At KU Leuven, the questions were given to 223 students in 2013 and to 214 students in 2014. All students were enrolled in the first year of the Bachelor of Pharmaceutical Sciences program, which includes a mandatory introductory course on mathematics and calculus-based physics. This course comprises 4 h of lectures plus between 2 h and
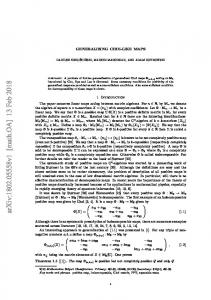
4 h of problem-solving sessions per week and three laboratory sessions of 3 h. After a few weeks of instruction that include the kinematics curriculum, students may take an optional midterm exam. Participation is highly recommended and typically over 90% of the students take part. In 2013 and 2014, a Dutch translation of the questions shown in Fig. 1 was part of the midterm exam. At UPV/EHU, the questions were given to 122 students in 2013 and 126 students in 2014. These students were enrolled in an engineering program which comprises a calculus-based
FIG. 1. English version of questions used to investigate approaches to kinematics graphs at KU Leuven and UPV/EHU: a linear distance-time graph (ball context) with negative slope (a), a water level versus time graph (swimming pool context) with a positive slope (b), and a context-free graph (c). The questions are taken from [1].
010108-3
LAURENS BOLLEN et al.
PHYS. REV. PHYS. EDUC. RES. 12, 010108 (2016)
mechanics course in the first semester. The instruction consists of 2 h of lecture classes and 1.5 h of problem solving sessions per week. In the last 15 min of most lectures the students take a small feedback exam to promote the interest of the students during the course. The marks obtained are part of the final mark for the mechanics course (about 20% in total, and 1% per test). At the end of the first lecture (which was not about kinematics) this exam included a Basque translation of the questions shown in Fig. 1. For comparison purposes, we have included data obtained from the DCU students who were enrolled in an algebra-based course, with much different attainment levels in both physics and mathematics [1].
linear kinematics graphs. We also describe how we adapted the categorization and how the prevalence of the responses depends on the context (ball vs swimming pool). We compare responses from the three universities. In Subsec. IV B we discuss how responses on qualitative questions about kinematics graphs correlate with approaches to determining the instantaneous speed. The results of the context-free questions are presented in Subsec. IV C. In addition, we compare student success rates with questions on contextfree graphs with kinematics graphs and discuss to what extent mathematical understanding of context-free graphs is a sufficient condition to determine the instantaneous speed from a kinematics graph.
C. Data collection and analysis
A. Student approaches to kinematics graphs
Data collection at KU Leuven and UPV/EHU was spread over two years. In 2013, 116 students at KU Leuven were given the ball question and 107 were given the swimming pool question, both with negative slope. In 2014, 92 students got a version of the ball question with positive slope, supplemented by a context-free question with positive slope. The other 122 students got the swimming pool question with positive slope and a context-free question with negative slope. As there were fewer participants at UPV/EHU, we gave these students the same questions in 2013 and 2014. A total of 129 students responded to the ball question with negative slope and a context-free question with positive slope. The other 119 students were asked the swimming pool question together with a context-free question, both with negative slope. In all three universities, students completed the paperand-pencil questionnaire under exam conditions. This means they could not communicate with each other and could not consult any textbook or lecture notes. They had approximately 30 min to answer the questions, but most students finished early. Students’ responses were categorized independently at KU Leuven and UPV/EHU using the categories that were adopted in [1]. In some cases we found clusters of responses that seemed to warrant a separate category but could only be fitted in the “other” category. These responses typically contained explanations based on scientific models that were not present in the study of [1]. In those cases we discussed how we could extend the categorization system and reanalyzed the data. This process was iteratively followed until we agreed on categories that were valid for all universities and were significantly populated. The final categorization is discussed in Sec. IV. By means of a χ 2 test it was established that at each university the data for both years were not significantly different [25].
1. Determining the direction of motion The first part of the question (see Fig. 1) asked students to determine the direction of motion. We did not find a significant difference between the positive and negative slope in the KU Leuven data, in contrast to the findings of [1]. At both KU Leuven and UPV/EHU, about 80% of the students were able to correctly determine the direction of motion of the ball, and about 95% correctly determined how the water level in the swimming pool was changing. Further analysis confirms the findings from DCU [1]. Students seem to have significantly more problems to determine the direction of motion in the context of the ball than in the context of the swimming pool. However, the difference appears to be an artifact of the question: it appears that the ball question elicits difficulties with the abstract nature of a reference point, while in the swimming pool setting students see the bottom of the pool as a “natural” reference point. An example of a student that is confused by the location of the reference point in the linear distance-time graph is given below “The direction of motion of the ball depends on where the reference point is situated.” This kind of mistake was not observed in the water level versus time question. 2. Determining whether the speed is constant Students used various approaches to determine whether the speed in a kinematics graph is constant or not. As explained by Wemyss and van Kampen, most correct responses are based on an argument that the graph depicts a straight line or that the slope is constant [1]. For example,
IV. RESULTS AND DISCUSSION
“Since the slope of the graph is constant, the speed will be constant.”
In this section we present the results of our study. In the first part, we discuss the difficulties students encounter with
“The speed is constant because the xðtÞ graph is a straight line.”
010108-4
GENERALIZING A CATEGORIZATION OF …
PHYS. REV. PHYS. EDUC. RES. 12, 010108 (2016)
Another important category comprises responses that rely on an interval reasoning [1]. The interval reasoning can be divided into two subcategories: a qualitative approach, e.g.,
believe this is not an example of slope-height confusion. It is more likely students made an v ¼ x=t error, as illustrated by this explanation: “The speed of the ball decreases as we see in the graph. Speed is distance divided by time and gradually decreases.”
“In the same time, the ball moves the same distance.” or a quantitative approach, “The water level changes with constant speed since v¼
Δx x2 − x1 ¼ ¼ −0.4 ¼ constant:” Δt t2 − t1
However, contrary to the algebra-based physics students at DCU, a significant fraction of students at KU Leuven and UPV/EHU used an approach based on the derivative of the function, for example, “The vðtÞ graph is the derivative of the xðtÞ graph, and is a straight line parallel to the x axis.” “v is the derivative of x and is constant.” Since these responses are also linked to the characteristics of straight line graphs, we chose not to add differentiation as a new category but to relabel the existing category to accommodate responses based on the derivative. Some students who gave correct responses used a combination of these approaches, a few used a different approach like proportional reasoning, and a few gave no explanation. The final categorization and the prevalence of the corresponding responses can be found in Table I. In all three universities we observed significant differences in the prevalence of approaches used in the ball question and the swimming pool question. The most striking difference is in the fraction of students writing that the speed of the ball decreases over time. Since the prevalence of this kind of reasoning was independent of the slope of the graph, we
Some students set up a table showing that the speed decreases over time. By contrast, very few students wrote down that the water level changed at a decreasing rate. We also noticed that the calculus-based physics students generally like to use a qualitative interval approach in the ball question, and prefer a quantitative interval approach in the swimming pool question. Moreover, many of the incorrect responses to the swimming pool question used a speed equals distance over time argument. These observations support the hypothesis that incorrect application of “speed equals distance over time” is an important obstacle for students in algebra-based and calculus-based courses alike. The prevalence of the responses is different for the three universities. This can be explained by the differences in attainment. Since the DCU students follow an algebrabased course, Wemyss and van Kampen did not observe arguments based on the derivative of a function [1]. However, the most conspicuous difference is that students at UPV/EHU strongly favor the interval approach. This is probably due to teaching methods used in the Basque educational system. While students learn to determine both the slope of a straight line and the interval approach, the latter is promoted when solving kinematics problems in secondary school and in the introductory physics course at university. DCU students used interval reasoning much more in the post-test, after the implementation of an intervention that used the interval approach [1]. These findings suggest that the students’ approach to answering qualitative questions depends strongly on the instruction they received. In Subsec. IV B we will discuss whether
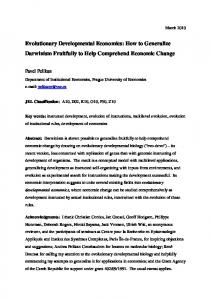
TABLE I. Categorization and prevalences of approaches to determining whether the speed of the ball or rate of change of the water level is constant, increasing, or decreasing. Correct responses (constant speed) are printed in bold, and are subdivided by the argument students used to explain their response. KU Leuven Ball (n ¼ 208)
Water level (n ¼ 229)
UPV/EHU Water level (n ¼ 119)
Ball (n ¼ 550)
Water level (n ¼ 343)
Constant speed (total) 86% (179) 93% (213) 78% (100) 84% (100) Straight line or constant slope or derivative 44% (92) 50% (115) 7% (9) 18% (22) Interval reasoning 31% (64) 28% (65) 61% (79) 63% (75) Interval þ constant slope 10% (20) 14% (32) 1% (1) 0% (0) Other 1% (3) ≈ 0% (1) 9% (11) 3% (3) Speed increases 2% (4) 1% (2) 0% (0) 0% (0) Speed decreases 12% (24) 5% (12) 12% (16) 0% (0) No response or incoherent ≈0% ð1Þ 1% (2) 10% (13) 16% (19)
77% (423) 39% (213) 25% (139) 1% (8) 11% (63) ≈ 5% ≈18% ≈1%
96% (330) 40% (138) 47% (160) 2% (7) 7% (25) 0% (0) 0% (0) 4% (13)
010108-5
Ball (n ¼ 129)
DCU
LAURENS BOLLEN et al.
PHYS. REV. PHYS. EDUC. RES. 12, 010108 (2016)
there is a preferred approach that promotes successful determination of instantaneous speed.
so x ¼ x0 þ vt and
v¼
3. Determining the instantaneous speed Essentially all students in the algebra-based course at DCU who evaluated the instantaneous speed correctly used v ¼ Δx=Δt. The students at KU Leuven and UPV/EHU use a larger variety of strategies. Some students set up the expression for the straight line and took the derivative, e.g., “The graph’s equation is a straight line: yðtÞ ¼
yð5Þ − yð0Þ 2 t þ yð0Þ ¼ − t þ 2.4 5 5
The derivative of this expression is the speed: 2 2 y0 ðtÞ ¼ − : Thus; y0 ð2Þ ¼ − − 0.4” 5 5 Students who use this approach must at some point also calculate Δx=Δt to set up the expression of the straight line. Nevertheless, we added a separate category for these responses, since they seem to explicitly distinguish between the speed at an instant (v ¼ dx=dt) and the average speed (v ¼ Δx=Δt). The former is the definition of the instantaneous speed, while the latter is only equal to the instantaneous speed in the specific case of a straight line graph. It is possible that some of our students did not understand that both approaches lead to the same result, showing they have problems relating the average speed to the instantaneous speed. Difficulties caused by misunderstanding the difference between instantaneous slopes and average slopes have been documented in several papers [1,22,26,27]. Another new category contains responses that rely on kinematics formulas (x ¼ x0 þ vt or similar), for example, “x ¼ x0 þ vt þ TABLE II. in bold.
at2 2
with
at2 ¼ 0; 2
1.6 − 2.4 m ¼ −0.4 ” 2 s
Students from calculus-based courses are more likely to use these formulas, since they are taught how to derive the expressions and may therefore link them to graphical representations. The final results for this question are summarized in Table II. The use of expressions that are only valid for linear functions that go through the origin (v ¼ x=t or similar) was the most prevalent error at all three universities. Only one student at KU Leuven read the distance from the graph and none did so at UPV/EHU; this was much more common at DCU. For this reason we amended the categorization and merged the original “read off” category and the “other” category. In general, the approaches calculus-based physics students at KU Leuven and UPV/ EHU used are quite similar. However, these students are significantly more successful in determining the instantaneous speed than algebra-based physics students at DCU, which is likely another consequence of their prior knowledge and experience with mathematics. These findings are in complete agreement with the observations of Beichner discussed in Sec. II [16]. We did not find significant differences in the problem solving strategies used in the ball problem versus the swimming pool problem at UPV/EHU. At KU Leuven, the success rate for both questions was similar, but we observed that significantly more students used a kinematics approach in the situation with a moving ball. This might result from the difference in context: students are used to applying kinematics formulas in situations with moving objects that are often used in textbooks, like balls, cars, or arrows. However, in this context of changing water level that is rarely used in textbooks, they seem to rely on techniques learned in math courses. This was different for the algebra-based physics students at DCU, who did significantly better on the question about the changing water level and used arguments based on interval reasoning more often than calculus-based physics students [1].
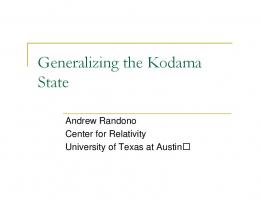
Categorization and prevalences of approaches to determining the speed at a particular instant. Correct responses are printed KU Leuven
Correct instantaneous speed (total) Δx=Δt or similar Kinematics formula Determine slope þ derivative x=t or similar No response or incoherent or other
UPV/EHU
DCU pretest
Ball (n ¼ 208)
Water level (n ¼ 229)
Ball (n ¼ 129)
Water level (n ¼ 119)
Ball (n ¼ 550)
Water level (n ¼ 343)
73% (151) 49% (102) 8% (17) 16% (32) 21% (44) 6% (13)
66% (150) 46% (106) 2% (4) 17% (40) 23% (52) 12% (27)
59% (76) 43% (56) 10% (13) 5% (7) 28% (36) 13% (17)
62% (74) 50% (59) 4% (5) 9% (10) 23% (27) 15% (18)
16% (87) 16% (87) 0% (0) 0% (0) 58% (317) 26% (141)
41% (139) 41% (139) 0% (0) 0% (0) 17% (59) 42% (145)
010108-6
GENERALIZING A CATEGORIZATION OF …
PHYS. REV. PHYS. EDUC. RES. 12, 010108 (2016)
Many students in the algebra-based course at DCU calculated the instantaneous speed as v ¼ x=t, immediately after stating that the speed is constant. Some students even gave a correct numerical value for the average speed when explaining that the speed is constant, yet did not appear to question the different value they calculated for the instantaneous speed [1]. 70%–85% of the students in calculusbased courses who correctly determined the speed to be constant correctly determined the instantaneous speed. As in [1], a considerable number of students calculated the instantaneous speed as v ¼ x=t, right after stating the speed is constant. Some students even give a correct value for the constant speed, but use a different value for the instantaneous speed. The following response shows how some students make an explicit distinction between average and instantaneous speed: “The water level changes with a constant speed because the xðtÞ graph is a straight line, and the derivative of a linear function is a constant. v¼
Δx 160 − 200 ¼ ¼ −0.4 m=s: Δt 200 − 100
This is the average speed (it is the same in every interval). The instantaneous speed can be calculated as v¼
x 160 ¼ ¼ −0.8 m=s: t 200
This is the instantaneous speed at t ¼ 200 s, it is equal to v ¼ lim t→0
Δx :” Δt
Comparable issues with the definitions of average and instantaneous speed were observed at DCU [1]. B. Qualitative understanding as a predictor for determining the value of the speed Table I shows that quite a few students in calculus-based physics courses did not write down that the distance or water level changed at a constant rate. About 20% of these students determined the speed, which is significantly more than the algebra-based physics students at DCU, where less than 2% who stated that the speed was not constant calculated it correctly [1]. This shows that some calculusbased students succeed in finding a value for the speed without correctly interpreting the physics, while this is almost impossible for algebra-based physics students. We can therefore hypothesize that a qualitative understanding of a linear kinematics graph is necessary for algebra-based students to find a value for the instantaneous velocity, but merely desirable for the calculus-based students. However, for neither group of students is it a sufficient condition,
since many students correctly decided that the distance or water level changed at a constant rate but did not determine a correct value for the instantaneous speed. When only taking into account the students who answered the qualitative part of the question correctly, Wemyss and van Kampen surprisingly found that their students’ strategies to determine the speed at an instant were independent of the argument they used to correctly decide that the speed is constant [1]. By using the same approach as Wemyss and van Kampen, we could confirm this result. We made several tables with the arguments students used to correctly state that the speed is constant as columns, and the strategy they used to determine a value for the instantaneous speed as rows. Since the p values that resulted from a χ 2 test were all higher than 0.16 (> α ¼ 0.05), we could accept the null hypothesis that these columns and rows are independent. This shows that qualitative understanding is not only insufficient for finding the right value for the speed, but also a poor predictor for the approach students use when determining the instantaneous speed. This implies there is no “best way” to teach students about the qualitative characteristics of a linear kinematics graph, since there is a weak correlation with the approach they use to calculate the speed. This finding applies to students in both calculus-based and algebrabased courses. C. The ability to determine the slope in a context-free graph as a predictor The responses to the question on context-free graphs did not lend themselves to the categorization of Wemyss and van Kampen [1]. First, we saw almost no “read off” errors. Since the number of students in this category was also small at DCU, the category was merged with the “other” category. Second, we found that many students at KU Leuven and UPV/EHU used an argument based on the derivative of the function. Often, such an argument was used in combination with one or more of the three subcategories identified by Wemyss and van Kampen: stating “the” formula for slope [e.g., ðy2 − y1 Þ=ðx2 − x1 Þ] without noting the points they used, similar responses indicating which two points they used, and numerical interval reasoning. We were unable to establish a reasonable number of subcategories, and therefore abandoned any subcategorization. The final categorization of responses to questions on context-free graphs can be found in Table III. When comparing the results of the three universities, we observed no significant differences between KU Leuven and UPV/EHU, but there was a deviation from the results obtained at DCU. This is probably again due to the prior knowledge of the students, as the students from the algebrabased course in Ireland generally had received less training in mathematical techniques than the students enrolled in calculus-based courses in Belgium and Spain.
010108-7
LAURENS BOLLEN et al.
PHYS. REV. PHYS. EDUC. RES. 12, 010108 (2016)
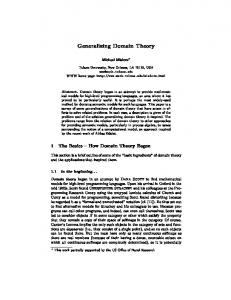
TABLE III. Categorization and prevalences of approaches to determining the slope of a context-free graph at a particular point. Correct responses are printed in bold. KU Leuven
Δy=Δx or similar y=x or similar Other No answer
UPV/EHU
DCU
Positive slope (N ¼ 92)
Negative slope (N ¼ 122)
Positive slope (N ¼ 129)
Negative slope (N ¼ 119)
Positive slope (N ¼ 206)
Negative slope (N ¼ 205)
77% (71) 3% (3) 15% (14) 4% (4)
76% (93) 3% (7) 14% (17) 7% (8)
64% (83) 12% (15) 18% (23) 6% (8)
69% (82) 4% (5) 13% (16) 13% (16)
52% (107) 18% (37) 18% (37) 12% (25)
46% (94) 24% (50) 15% (30) 15% (31)
In Sec. II, we discussed earlier research showing that students tend to do better with questions on context-free graphs than with graphs in a kinematics (or other) context [22–24]. We verified this result for the algebra-based physics students at DCU using a two-tailed two-proportion z test with a significance level α ¼ 0.05. However, when examining the responses of the calculus-based students at KU Leuven and UPV/EHU, we noticed that the differences in success rates between context-free and context-rich kinematics questions were not always significant. This leads us to believe that there is a larger gap between mathematics and physics for algebra-based physics students than for calculus-based physics students when it comes to the determination of the slope in linear graphs. While Christensen and Thompson suggested that student difficulties regarding the slope and derivative may have origins in the understanding of the mathematical concepts [22], our results suggest that other factors are at play as well. Finally, we found that there is little or no correlation between the ability to determine the slope at a point on a linear context-free graph and understanding that the speed is constant in a kinematics graph. Moreover, we found almost no correlations between the responses on the context-free question and the strategies used in the determination of the instantaneous speed. Consequently the ability to determine the slope at a point on a context-free graph seems to be a poor predictor for how students answer questions about kinematics graphs, confirming the findings of Wemyss and van Kampen. [1]. V. CONCLUSIONS The research described above allows us to answer the research questions in Subsec. III A. In addition we discuss implications for instruction and ideas for future research projects. The majority of students from all three universities can correctly identify the direction of motion in a linear kinematics graph. However, some students appear to struggle with the reference point implicit in distance-time graphs. By contrast, almost all students can correctly interpret whether water is entering or leaving a pool.
The sign of the slope of the graph had no influence on the responses. We have identified two principal approaches students use to determine correctly whether the speed is constant: (i) the line is straight, or the slope or the derivative is constant, and (ii) interval reasoning. Other approaches and combinations of approaches rarely occur. Incorrect responses almost all stem from dividing the two coordinates, most likely due to misinterpreting the phrase “speed equals distance over time.” This categorization applies to both linear distance-time graphs and linear water level versus time graphs, with positive or negative slope. Our results show that it is important to explicitly include one or both of the successful approaches, and that students need to carefully consider that dividing two coordinates gives incorrect answers when the straight line does not go through the origin. To determine the instantaneous speed correctly, the majority of students use interval reasoning: they calculate Δx=Δt or use a similar approach. Compared to the analysis performed by Wemyss and van Kampen, this “correct” category was extended with subcategories based on the derivative of a function and kinematics formulas. Incorrect interpretation of “rise over run” as “y=x” was the most frequent error. A third category comprised all other responses and students that did not give a response. These three major categories emerged from our data and could be used irrespective of the context of the question and the sign of the slope. While the prevalence of certain responses varied between universities, the same categorization applied to all the data. This indicates that students use similar strategies to solve these questions and struggle with the same issues, regardless of the educational approach (calculus-based versus algebra-based physics) and country (Ireland, Belgium, or Spain). We found that a qualitative understanding of kinematics graphs is a necessary but insufficient condition for students in algebra-based courses to correctly determine instantaneous speed. For students in calculus-based courses, it is neither necessary (though highly desirable) nor sufficient. This implies that both qualitative and quantitative aspects of linear kinematics graphs should be taught. The argument students use to explain why they think the speed is constant
010108-8
GENERALIZING A CATEGORIZATION OF …
PHYS. REV. PHYS. EDUC. RES. 12, 010108 (2016)
does not correlate with the approach they use to determine the instantaneous speed. The ability to determine the slope of a context-free graph is neither necessary nor sufficient to solve problems involving a kinematics graph, and is a poor predictor for the approach students will use. Students in the algebrabased course fared significantly better with questions on context-free graphs than on kinematics graphs, but the difference was less pronounced for calculus-based students. This may indicate calculus-based students have fewer problems transferring their knowledge and skills from mathematics to physics than algebra-based physics students; however, this claim needs to be verified further in other contexts. We found that students in calculus-based courses have higher success rates than students in algebra-based courses, confirming Beichner’s findings [16]. At all three universities more than half of the incorrect responses used v ¼ x=t instead of v ¼ Δx=Δt to determine instantaneous speed. This indicates that students in calculus-based courses and algebra-based courses encounter similar difficulties, albeit with different prevalences. As Maries and Singh have shown, for graduate students enrolled in
teaching assistant training it is often difficult to identify the problems university students have with graphs in kinematics [28]. To design effective instruction and useful learning activities, it is important that instructors and teachers are aware of student difficulties. We agree with Berg and Smith that the learning outcomes of these activities should be carefully evaluated and validated [29]. The different circumstances in the three universities in different countries is both a strength and a limitation of the research presented here. Our conclusions and categorizations are strengthened by the diversity. We encourage others to confirm the validity of our results at other universities and at the high school (secondary school) level, and undertake additional qualitative research and pretest/post-test analysis whenever an intervention is attempted.
[1] T. Wemyss and P. van Kampen, Categorization of first-year university students interpretations of numerical linear distance-time graphs, Phys. Rev. ST Phys. Educ. Res. 9, 010107 (2013). [2] H. G. Close and P. R. L. Heron, Student understanding of the angular momentum of classical particles, Am. J. Phys. 79, 1068 (2011). [3] K. K. Mashood and V. A Singh, An inventory on rotational kinematics of a particle: Unravelling misconceptions and pitfalls in reasoning, Eur. J. Phys. 33, 1301 (2012). [4] K. K. Mashood and V. A Singh, Rotational kinematics of a rigid body about a fixed axis: Development and analysis of an inventory, Eur. J. Phys. 36, 045020 (2015). [5] By context-free we mean purely numerical graphs such as students encounter in mathematics courses. [6] P. Kohl and N. Finkelstein, Student representational competence and self-assessment when solving physics problems, Phys. Rev. ST Phys. Educ. Res. 1, 010104 (2005). [7] M. De Cock, Representation use and strategy choice in physics problem solving, Phys. Rev. ST Phys. Educ. Res. 8, 020117 (2012). [8] B. Ibrahim and N. S. Rebello, Representational task formats and problem solving strategies in kinematics and work, Phys. Rev. ST Phys. Educ. Res. 8, 010126 (2012). [9] A. Acevedo Nistal, W. Van Dooren, and L. Verschaffel, What counts as a flexible representational choice? An evaluation of students’ representational choices to solve linear function problems, Instr. Sci. 40, 999 (2012).
[10] A. Acevedo Nistal, W. Van Dooren, and L. Verschaffel, Students reported justifications for their representational choices in linear function problems: An interview study, Educ. Stud. Math. 39, 104 (2013). [11] B. Knockaert, M.Sc. thesis, KU Leuven, 2015. [12] P. Kohl and N. Finkelstein, Effects of representation on students solving physics problems: A fine-grained characterization, Phys. Rev. ST Phys. Educ. Res. 2, 010106 (2006). [13] P. Kohl and N. Finkelstein, Patterns of multiple representation use by experts and novices during physics problem solving, Phys. Rev. ST Phys. Educ. Res. 4, 010111 (2008). [14] G. Leinhardt, O. Zaslavsky, and M. K. Stein, Functions, graphs, and graphing: Tasks, learning, and teaching, Rev. Educ. Res. 60, 1 (1990). [15] J. Preece, A Survey of Graph Interpretation and Sketching Errors, CAL Research Group Tech. Rep. No. 34, Milton Keynes, England: Institute of Educational Technology, The Open University, Walton Hall 1983. [16] R. J. Beichner, Testing student interpretation of kinematics graphs, Am. J. Phys. 62, 750 (1994). [17] L. C. McDermott, M. L. Rosenquist, and E. H. van Zee, Student difficulties in connecting graphs and physics: Examples from kinematics, Am. J. Phys. 55, 503 (1987). [18] A. Bell and C. Janvier, The interpretation of graphs representing situations, Learn. Math. 2, 34 (1981). [19] J. Clement, The concept of variation and misconceptions in Cartesian graphing, Focus Learn. Probl. Math. 11, 77 (1989).
ACKNOWLEDGMENTS We would like to thank all the instructors and students whose cooperation made this research project possible. This work is supported by the government of the Basque country through Grant No. IT487-10.
010108-9
LAURENS BOLLEN et al.
PHYS. REV. PHYS. EDUC. RES. 12, 010108 (2016)
[20] D. Kerslake, The understanding of graphs, Math. Sch. 6, 22 (1977). [21] H. M. Brasell and M. B. Rowe, Graphing skills among high school physics students, School Sci. Math. 93, 63 (1993). [22] W. M. Christensen and J. R. Thompson, Investigating graphical representations of slope and derivative without a physics context, Phys. Rev. ST Phys. Educ. Res. 8, 023101 (2012). [23] M. Planinic, Z. Milin-Sipus, H. Katic, A. Susac, and L. Ivanjek, Comparison of student understanding of line graph slope in physics and mathematics, Int. J. Sci. Math. Educ. 10, 1393 (2012). [24] M. Planinic, L. Ivanjek, A. Susac, and Z. Milin-Sipus, Comparison of university students’ understanding of graphs in different contexts, Phys. Rev. ST Phys. Educ. Res. 9, 020103 (2013). [25] When comparing results, we often report about (in)significant differences between certain cohorts of students. These indicate the outcome of a χ 2 test at a significance level of α ¼ 0.05 unless explicitly stated otherwise. In the case of the KU Leuven data this confirms the findings of
[26]
[27]
[28]
[29]
010108-10
Ref. [1] that there were no significant differences between positive and negative slopes for questions 2 and 3. E. M. Billings and D. Klanderman, Graphical representations of speed: Obstacles preservice K-8 teachers experience, School Sci. Math. 100, 440 (2000). P. W. Thompson, Conceptual analysis of mathematical ideas: Some spadework at the foundation of mathematics education, in Proceedings of the Annual Meeting of the International Group for the Psychology of Mathematics Education, edited by O. Figueras, J. L. Cortina, S. Alatorre, T. Rojano, and A. Sépulved (2008), Vol. 1, pp. 45–64; http://pat‑thompson.net/PDFversions/ 2008ConceptualAnalysis.pdf. A. Maries and C. Singh, Exploring one aspect of pedagogical content knowledge of teaching assistants using the test of understanding graphs in kinematics, Phys. Rev. ST Phys. Educ. Res. 9, 020120 (2013). C. A. Berg and P. Smith, Assessing students’ abilities to construct and interpret line graphs: Disparities between multiple-choice and free-response instruments, Sci. Educ. 78, 527 (1994).