Generating Automated News to Explain the Meaning of Sensor Data Martin Molina1, Amanda Stent2, and Enrique Parodi1 1 Department of Artificial Intelligence Technical University of Madrid, Spain
[email protected],
[email protected] 2 AT&T Labs - Research Florham Park, NJ, USA
[email protected]
Abstract. An important competence of human data analysts is to interpret and explain the meaning of the results of data analysis to end-users. However, existing automatic solutions for intelligent data analysis provide limited help to interpret and communicate information to non-expert users. In this paper we present a general approach to generating explanatory descriptions about the meaning of quantitative sensor data. We propose a type of web application: a virtual newspaper with automatically generated news stories that describe the meaning of sensor data. This solution integrates a variety of techniques from intelligent data analysis into a web-based multimedia presentation system. We validated our approach in a real world problem and demonstrate its generality using data sets from several domains. Our experience shows that this solution can facilitate the use of sensor data by general users and, therefore, can increase the utility of sensor network infrastructures. Keywords: Interactive data analysis, intelligent multimedia presentation system, virtual newspaper, data-to-text system.
1 Introduction Collections of large quantitative datasets from distributed sensors are now becoming widely available online. To use these datasets human analysts usually examine the data, choose analytical methods (statistical analyses, clustering methods, etc.), decide how to present the results (e.g. by choosing and constructing relevant graphics), and explain what the results mean. However, human analysts are expensive, and since the meaning of quantitative data is not always explicit, understanding of these large datasets is too often restricted only to domain experts. Many analytical methods are implemented in statistics and data mining packages such as R [13] and Weka [20], or visualization packages such as Google Charts. This has led to the development of automatic solutions for intelligent data analysis. These systems can examine data, select and apply analytical methods, and visualize the results. However, existing automatic solutions for intelligent data analysis provide limited help to explain the meaning of the data to non-expert end-users [16]. J. Gama, E. Bradley, and J. Hollmén (Eds.): IDA 2011, LNCS 7014, pp. 282–293, 2011. © Springer-Verlag Berlin Heidelberg 2011
Generating Automated News to Explain the Meaning of Sensor Data
283
On-line solutions that automatically construct textual or multimedia explanations of the meaning of sensor data using non-technical language can facilitate access by non-expert users with any level of knowledge and, therefore, can increase the utility of sensor network infrastructures. For example, consider a web server in the hydrological domain that collects real time data about water levels, water flows and other hydrological information recorded by a sensor network. In contrast to a specialized web application that only presents results of analyses to expert hydrologists graphically, a web application with text explanation capabilities is potentially more useful to a wider range of users (e.g., municipalities, civil protection, engineering consultants, educators, etc.). Other examples of public web servers with large quantitative datasets potentially useful for different communities of users are ship traffic [18], crime statistics [17] and wildlife tracking data [12]. In this paper, we describe our research on systems that can automatically generate explanatory descriptions about the meaning of quantitative sensor data for general users. We propose a type of web application, a virtual newspaper with automated generated news stories, as a way to communicate this information to general users. To develop this type of application it is necessary to find an efficient combination of methods from different fields such as automated data analysis, multimedia presentation systems (discourse planning, natural language generation, graphics generation), and hypermedia-based representations. In the paper we focus on our automatic method for selecting data analyses and planning discourses explaining the results. In addition, we describe the type of presentation our system generates, and a general architecture that supports interaction with these presentations. We also present the results of an evaluation of our solution in a real-world hydrological task, and a comparison with related work.
2 The Problem of Generating Explanatory Descriptions In order to characterize the problem of generating explanatory descriptions, we present some general desiderata. Our first set of desiderata is related to the data input to our system. We assume that the input to our system is a quantitative dataset corresponding to measures from a set of geographically distributed sensors. Each measure includes temporal references (date/time) and spatial references (latitude/ longitude) as well as, potentially, other information sampled periodically by the sensor over a certain interval of time (for example, a number of days, months or years). We assume that the input to our system normally includes a large number of measures (thousands or millions of measures). An example of this type of dataset is the information measured the sensor network of the national information system SAIH in Spain (SAIH is the Spanish acronym for Automatic Information System in Hydrology). This system collects hydrologic data about water flows and water levels and meteorological data (e.g., rainfall) using thousands of sensors located at river channels, reservoirs and other selected locations. We used this system as an example of sensor network data for our task. In this case, data is measured using static sensors located in fixed geographic locations. We also used datasets from moving sensors. For example, we used data from a large set of environmental information collected by ships over the last ten years for
284
M. Molina, A. Stent, and E. Parodi
the international VOSclim project [18]. This data set includes tens of measures for each of hundreds of thousands of events for hundreds of ships. This publicly available data set is a good representative example of a sensor data set with moving sensors. Other examples of data from moving sensors come from Obis-Seamap [12], a web site that includes wildlife tracking datasets (including whales, turtles, seals, and birds). Our second set of desiderata is related to the content and form of the generated presentations. Our goal is to generate explanatory descriptions of the meaning of the input sensor data. According to the context of our research work, we assume that generated descriptions should: • • •
Be informative and persuasive. The objective is to inform the user about the content of the sensor data. The descriptions should summarize relevant information and include persuasive explanations and evidence. Be useful for non-expert users. In order to be understood by non-expert users, the content of the description should include a minimum number of specialized terms and should assume minimal background knowledge about the domain. Have a uniform style. The style of the presentation should be uniform and easy to read. The style of the presentation should be domain independent to facilitate applicability of this solution to different problems.
Finally, we have desiderata relating to the user-system interaction. We assume that the system should produce interactive presentations. The user should be able to easily request additional explanations of subsets of the data. This is important to let the user find evidence supporting presented information and/or find additional relevant information not found by the system. The user-system interaction should be based on well-known standards and intuitive communication metaphors to be easy to use by general users (for example, using hypermedia solutions). In the following sections we describe our system, focusing on two main tasks: (1) generating the content of the news (what information to communicate) and (2) generating the presentation (how to present the information).
3 Generating the Content of the News To automatically generate the content of our ‘sensor news’ stories we need to construct descriptions that summarize relevant information and provide explanations and evidence. This task requires finding and abstracting relevant information from sensor data, and constructing descriptions with appropriate explanatory discourses. We studied how humans write descriptions that summarize this type of information. For static sensors, we analyzed sensor data and descriptions in the hydrological domain corresponding to the SAIH system. We studied how expert hydrologists generate descriptions related to water management and alerts related to floods. For this purpose, we used as main sources: interviews with experts, specialized web sites where human experts write summaries and news stories from newspapers related to hydrologic problems (such as floods). For moving sensors, we studied how humans describe geographical movements. We created a corpus of human-authored descriptions of geographic movements of wild animals from
Generating Automated News to Explain the Meaning of Sensor Data
285
scientific papers on wildlife tracking [3]. We also created a separate corpus for geographic movements by crowdsourcing using Amazon Mechanical Turk1. In general, the analyzed descriptions include the following main characteristics: (1) relevant facts, the texts include descriptions that summarize the main characteristics of the data, at an appropriate level of abstraction, including discovered patterns, trends and general properties; (2) explanatory descriptions, the texts elaborate the presentation of relevant facts using discourse patterns such as causal explanations, chronological descriptions, comparison of values, enumerations and examples that provide supporting evidence; and (3) graphical information, the descriptions usually combine natural language text and graphics (maps, charts, etc.). To generate the content of this type of descriptions, we use a combination of a data analyzer and a discourse planner. The role of the data analyzer is to discover new facts and abstract information. The discourse planner uses the data analyzer to automatically construct explanatory descriptions. 3.1 The Discourse Planner Our discourse planner is conceived as a knowledge-based hierarchical planner. The knowledge base includes partial discourse patterns at different levels of abstraction, together with conditions for selecting each discourse pattern. Given an input presentation goal (e.g. to summarize a subset of the data), the planner constructs the output presentation plan by iterative refinement of the goal using the discourse patterns. The planner itself is a modified version of HTN (Hierarchical Task Network) planning [4]. The generated discourse plan includes information about the rhetorical structure of the discourse (with rhetorical relations [7]) and information about propositions in the discourse, represented as references to subsets of the input data. GOAL: elaborate_movement(x) CONDITION: (path(x) ∧ aggregated_stops_chronologically(x, 7, y)) SUBGOALS: {goal(describe_beginning(x), d1), goal(describe_stops_chronologically(y), d2)} DISCOURSE: relation(temporal_sequence, nucleus({d1,d2}), satellite({})))
Fig. 1. Example discourse pattern
We collected and manually authored discourse patterns for each specific domain. For example, we found that it was possible to generate discourses about flood risks in the hydrologic domain with 245 discourse patterns. We also were able to generate summaries of basic geographic movements of moving sensors with 56 discourse patterns. Figure 1 shows an example of one of these patterns. This pattern means: if it is possible to make a spatio-temporal clustering of a path x with 7 or fewer stops, then (1) generate a description for the beginning of the movement (description d1), (2) generate a chronological description for the sequence of these stops (description d2), and (3) link d1 and d2 with the rhetorical relation temporal-sequence. We currently use 14 standard rhetorical relations such as elaboration-general-specific, exemplify, list, 1
These datasets are available to the research community; contact the authors.
286
M. Molina, A. Stent, and E. Parodi
and contrast. Our discourse planner can be adapted by modifying the discourse strategies for new domains and including new strategies. In addition, many discourse patterns (for example, patterns for spatio-temporal descriptions and certain general patterns for causal descriptions) are reusable in different domains. 3.2 The Data Analyzer The goal of the data analyzer is to find relevant information, patterns and abstractions from the sensor data. The data analyzer can: cluster the data, analyze trends in the data, or describe the data in terms of most common feature values, example instances, and exceptions. This process creates subsets of the data, from which propositions for the discourse are produced by the discourse planner. {InitialTime(2010-06-01T18:30), FinalTime(2010-07-01T11:30) Geometry(Region(…)), Ocean(‘Pacific Ocean’), …}
Aggregates
a1 a2 a3
a5
a4
Paths p1
p2
Augmented events e1'
e2´
e3´
e2
e5´
e6´
e7´
e8´
e9´
e6
e7
e8
e9
{…,City(‘Valparaiso´), Surface(Water), … }
Observed events e1
e4´
e3
e4
e5
{InitialTime(2010-06-15T10:30), Geometry(Point(-33,0346,-71,617), Agent_type(‘Cruise ship’), …}
Fig. 2. Data representation for data analysis
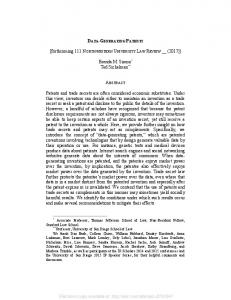
We designed a general data representation able to cope with large sensor datasets; it has the following basic elements (see Fig. 2): •
Events. Input sensor data is represented as a set of events E ={e1, e2, …}. Each event is characterized by a set of attribute values. We use several spatio-temporal attributes: date/time, and geographic attributes (spatial point, geographical point, spatial area, etc.). In addition, each particular domain uses additional quantitative or qualitative attributes corresponding to the specific observable properties of the dynamic system being measured by the sensors (e.g., temperature, pressure, etc.).
Generating Automated News to Explain the Meaning of Sensor Data
• •
287
Paths. Each path pi is a sequence of events (e1, e2, …). Paths are used, for example, to represent the geographical movement of a vehicle. Paths are represented by the set P = {p1, p2, …}. Aggregates. Aggregates are represented by the set A = {a1, a2, …}. Each element ai aggregates a set of events, a set of paths, or other aggregates. Each aggregate is described with a set of attributes.
In our data analyzer we distinguish between two main steps: (a) attribute extension and (b) event aggregation. The first step finds the values of additional attributes for each event and the second step creates aggregate events. Figure 2 summarizes this process and our data representation. At the bottom, there are events recorded by the sensors, each event with a set of attribute values. Above them, there are extended events, i.e. the recorded events augmented with new attribute values corresponding to the attribute extension step. Events can be optionally linked into paths, if they indicate movement of individuals in space/time. Finally, events are grouped by aggregations created by the data analysis process. The new attribute values of an event are obtained from other attribute values of the event (for example by qualitative interpretation, aggregation or generalization). Abstraction goals
aggregated_stops(x, y, z)
aggregated_stops_ chronologically(x, y, z)
aggregated_stops_ by_duration(x, y, z)
pattern_ periodicity(x, y, z, u, v)
pattern_ common_date(x, y, z)
Description Given a trip x and a maximum number of places y, this predicate generates a set z of n places which includes all the places visited. The level of abstraction for each place is selected to satisfy n ≤ y. Abstraction method: Hierarchical agglomerative clustering on extended attributes of locations, including country, state/county, city, address and toponym. Given a trip x and a maximum number of places y, this predicate generates an ordered set z of n places which includes all the places visited in chronological order. The level of abstraction for each place is selected to satisfy n ≤ y. Abstraction method: Hierarchical agglomerative clustering based on locations and durations between stops. Given a trip x and a maximum number of places y, this predicate generates an ordered set z of n places which includes all the places visited sorted by duration. The level of abstraction for each place is selected to satisfy n ≤ y. Abstraction method: Hierarchical agglomerative clustering based on extended attributes of durations, including year, month, week, day, hour, etc. Given a trip x and a place y that was visited several times, this predicate finds the periodicity of the visits, described by z (integer) number of times, u is the time unit (D for day, M for month, etc.), and v is the periodicity represented as a duration (ISO 8601). Abstraction method: Regular expression matching over the input durations. Given a trip x and a place y that could be visited several times, this predicate generates the value z that represents the common date of the visits. Abstraction method: Hierarchical agglomerative clustering based on extended attributes of dates, including year, month, week, day, hour, etc.
Fig. 3. Example abstraction goals and their corresponding abstraction methods
288
M. Molina, A. Stent, and E. Parodi
For this purpose, we use knowledge bases with abstractions about time and space, as well as other domain specific representations. For example, for interval events we add a duration attribute; for locations we add city, state, country, and toponym. Event aggregation is done using clustering procedures and trend analysis. Instead of having general clustering methods to find any kind of aggregation, we use a fixed set of abstraction methods (each one based on different subsets of attributes) defined by named abstraction goals (Fig. 3). This is important to establish adequate control of the discourse planning. Most of the clustering and trend analysis methods we use are implemented in R. For example, we currently use methods for spatial clustering, temporal clustering, spatio-temporal clustering, clustering based on output of a statistical classifier, clustering based on event actors, and temporal trend analysis. For each domain, we can add new abstraction methods.
4 Generating the Sensor News Presentations The goal of presentation generation is to determine how to present information to the user. Our solution to this an on-line virtual newspaper following a journalistic style [10]. The journalistic layout and presentation style is understandable by a wide audience. It uses texts organized in headlines, summaries and progressive descriptions using natural language together with appropriate graphic illustrations.
Fig. 4. Example interactive presentation following a journalistic style
Generating Automated News to Explain the Meaning of Sensor Data
289
Our generated presentations follow a presentation style based on existing styles of newspapers (e.g, the New York Times). Presentation elements include titles, subtitles, tables, text elements, hyperlinks, and figures of various types (Fig. 4). The layout always includes text (headline and text body) and, optionally, one or several figures. Our solution uses a set of prefixed layouts; the best layout is automatically selected based on the number of figures and amount of text in the presentation to be generated. The user interacts with the presentation by clicking on hyperlinks in the text or by manipulating interactive coordinated graphics, or by selecting data points in the graphical components of a presentation. For example, Figure 4 illustrates some forms of text and graphics coordination. In the figure, some text is blue and underlined because the user has put the cursor on this text and it is a within-presentation link. When the user clicks this link, the 2D chart, a temporal series, is displayed (if it is not yet displayed) and highlighted. The user can manipulate the chart to consult values or to select time intervals. When the user changes the time interval, the map automatically shows the boat’s route in that interval. When the user clicks on a specific time point in the chart, the map shows the corresponding geographic location. In order to support this type of interaction with the required efficiency we designed a general software architecture (Figure 5) having the following main components: (1) components for content planning (the discourse planner and the data analyzer), (2) components for presentation planning integrating specialized components for natural language generation and graphics generation, and (3) the data base with raw sensor data and for the results of data analyses; all of these producing (4) an automatically generated hypermedia virtual newspaper (in HTML and JavaScript) accessible by remote web browsers through the Internet. An original characteristic of this architecture is that we separate the content of the presentation into two parts: (1) the discourse plan and (2) the data base with sensor data and abstractions. It is easier to efficiently manage large datasets with a database system (for example, a relational database) with general tools for data analysis (for example, R) and, separately, to use rich knowledge representations for the discourse plan (for example, logic predicates to represent RST relations and propositions).
User
Web Browser
User Query
Hypermedia presentation
Content Planner Data Analyzer
Analysis Goals Discourse Planner
Presentation Generation Discourse Plan
Natural Language Generator
Graphic Generator
Database: Sensor Data & Abstractions
Fig. 5. The general architecture for our automatic description generation system
290
M. Molina, A. Stent, and E. Parodi
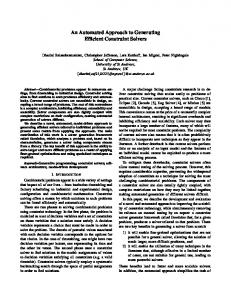
5 Evaluation We have evaluated our general design in different domains. For example, we developed a real-world application called VSAIH in the hydrology domain following the journalistic approach described in this paper. Figure 6 shows an example generated presentation with a headline, a body text with hyperlinks, and two graphics: an animated illustration showing the movement of a storm using pictures from meteorological radars, and an interactive map with the location of relevant sensors.
Flow above normal in the Ebro river at Ascó - The Ebro River at Ascó has recorded a flow of 362 m3/s which represents an increase of 10.0 m3/s compared to the previous hour. The normal flow at this point of the river is 308 m3/s. With respect to this, the following hydrological behavior can be highlighted. There have been changes in volume in 3 reservoirs in the Ebro River over the past 24 hours. The maximum decrease in volume has occurred in the Ribarroja reservoir with a decrease of 4.18 Hm3 over the past 24 hours.
Fig. 6. Example of web application in hydrology, with English translation underneath
VSAIH has operated continuously for more than one year. Every hour VSAIH generates a virtual newspaper of 20-30 pages of news summarizing 44,736 events corresponding to sensor data from the national hydrologic information system SAIH (see Section 2). Each page is generated in less than 5 seconds. To evaluate its practical utility, we compared VSAIH with existing web applications that present hydrological sensor data. We compared the time taken by general users to search and analyze data for given tasks relating to water management and flood alerts. Users took
Generating Automated News to Explain the Meaning of Sensor Data
291
up to about 5 hours (4 hours, 46 minutes) to synthesize information using other existing web applications. This represents the amount of time that users could save by using our application, which is significant, especially in the presence of emergencies. The development of VSAIH showed the feasibility and the practical utility of the type of application described in this paper. VSAIH was developed for a specific domain with static sensors (more details about this application domain can be found in [9]). In order to design a more general solution, we used other datasets from different domains, for example: wildlife tracking (1,438 measures) [12], ship traffic (8,307,156 measures, from the VOSclim project) [18], crime statistics (27,699,840 measures) [17], twitter data (7,589,964 measures), network traffic data (52,232 measures) and general geographic movements [11]. We found that the general design presented in this paper was appropriate for all these domains. The data representation (database design and file formats) and algorithms were reused in all cases. However, we found it necessary to perform the following main additional tasks to adapt our architecture for each domain: (a) create specific domain knowledge bases with new domain attributes and new abstraction functions for the data analysis task; and (b) extend/adapt the discourse patterns for the discourse planner.
6 Related Work Our system is related to intelligent multimedia presentation systems (such as the system prototypes WIP [19] and COMET [8]). Our solution uses the architecture typically adopted in multimedia presentation systems [1] (e.g., content planning, graphic generation, etc.) with specific knowledge and data representations designed for sensor data. In contrast to other multimedia presentation systems, our system also uses a special presentation style (a virtual newspaper with text explanations and interactive graphics) suitable for our task (generating explanatory descriptions to help non-expert users understand sensor data). Autobrief [5] is an experimental prototype related to our system. Autobrief generates presentations in the domain of transportation scheduling. Like our system, it is interactive and combines generated text and graphics. Autobrief was validated in one specific domain and generates basic presentations (with two or three lines of text and bar graphs). In contrast, our system was constructed to generate more complex presentations (with larger text segments and more complex graphics) based on the idea of a virtual newspaper. It has been validated in several domains (with millions of data points). In addition, our system uses a different representation that includes rhetorical relations to relate graphics and text (which may provide more portability). In the field of natural language generation, our solution has some similar general components to data-to-text systems (for weather forecasting [15] or medicine [6]). A significant problem of these systems is that they still don’t generate appropriate narratives (normally they mainly list the events in natural language) [14]. Our system is able to generate complex narratives (with rhetorical relations such as contrast, exemplify, cause, elaboration, etc.) thanks to the use of a data analyzer with a prefixed set of abstraction functions working in combination with a discourse planner with discourse patterns. Also, compared to data-to-text systems, our system is able to generate presentations including text and graphics.
292
M. Molina, A. Stent, and E. Parodi
7 Conclusions In this paper, we have identified a general problem: how to automatically generate explanations about the meaning of sensor data for non-expert users. To our knowledge, there is no previous research that identifies this problem as a whole and addresses it with a general solution. We argue that a solution to this problem helps to increase the utility of sensor networks. We propose a solution to this problem based on the idea of a virtual newspaper with automatically generated news. We designed an architecture that integrates a variety of techniques from automated data analysis, multimedia presentation systems (discourse planning, natural language generation, graphics generation), and web applications (hypermedia representations). Specific contributions of our proposal are: •
•
•
We designed a novel type of user interface with a presentation style that uses a journalistic metaphor (a headline and a body text, complemented by graphics) which is familiar to general users. For this presentation style, we identified certain types of typical narratives to explain the meaning of sensor data. We implemented the corresponding computational models to automatically generate such explanations. We permit users to interact with the system through hyperlinks and graphics manipulation. Our solution is web-based, allowing remote operation though the internet. In our architecture we pay special attention to efficiency and reusability of components. For example, we designed a data representation able to handle large data sets from diverse domains as well as abstractions over those data sets; we designed an efficient discourse planner (adapted from work on hierarchical task networks); and we reused existing tools for data mining. Our solution has been evaluated in a complex real-world domain showing efficiency (answer times in seconds) and practical utility (potential time savings of about 5 hours for certain tasks). We also have demonstrated the generality of our approach by applying our solution to different domains.
Our future plans related to this research work include the extension and further evaluation of specific components (e.g., natural language generation, and specific methods for data analysis) and generalizing knowledge bases together with other solutions to help developers construct domain models. For example, we plan to explore the applicability of representation standards related to sensor knowledge, as it is considered the context of the Semantic Web (e.g., [2]). Acknowledgements. The research leading to these results has received funding from the European Union Seventh Framework Programme (FP7/2007-2013) under grant agreement PIOF-GA-2009-253331 (Project INTERACTIVEX). This work was also partially supported by the Ministry of Science and Innovation of Spain within the VIOMATICA project (TIN2008-05837). The authors thank Javier Sánchez-Soriano and Alberto Cámara for the software development of system prototypes.
Generating Automated News to Explain the Meaning of Sensor Data
293
References 1. André, E.: The generation of multimedia presentations. In: Dale, R., Moisl, H., Somers, H. (eds.) A Handbook of Natural Language Processing: Techniques and Applications for the Processing of Language as Text, pp. 305–327. Marcel Dekker Inc., New York (2000) 2. Compton, M., Henson, C., Lefort, L., Neuhaus, H., Sheth, A.: A Survey of the Semantic Specification of Sensors. In: 2nd International Workshop on Semantic Sensor Networks, at 8th International Semantic Web Conference (2009) 3. Coyne, M.S., Godley, B.J.: Satellite tracking and analysis tool (STAT): an integrated system for archiving, analyzing and mapping animal tracking data. Marine Ecology Progress Series (2005) 4. Ghallab, M., Nau, D., Traverso, P.: Automated planning: Theory and practice. Morgan Kaufmann, San Francisco (2004) 5. Green, N., Carenini, G., Kerpedjiev, S., Mattis, J., Moore, J., Roth, S.: AutoBrief: an Experimental System for the Automatic Generation of Briefings in Integrated Text and Information Graphics. International Journal of Human-Computer Studies 61(1), 32–70 (2004) 6. Hunter, J., Gatt, A., Portet, F., Reiter, E., Sripada, S.: Using natural language generation technology to improve information flows in intensive care units. In: 5th Conf. on Prestigious Applications of Intelligent Systems (2008) 7. Mann, W., Thompson, S.: Rhetorical Structure Theory: Toward a functional theory of text organization. Text 8(3), 243–281 (1988) 8. McKeown, K.R., Feiner, S.K.: Interactive multimedia explanation for equipment maintenance and repair. In: DARPA Speech and Language Workshop (1990) 9. Molina, M., Flores, V.: A presentation model for multimedia summaries of behavior. In: 13th International Conference on Intelligent User Interfaces (2008) 10. Molina, M., Parodi, E., Stent, A.: Using the Journalistic Metaphor to Design User Interfaces That Explain Sensor Data. In: Campos, P., Graham, N., Jorge, J., Nunes, N., Palanque, P., Winckler, M. (eds.) INTERACT 2011, Part III. LNCS, vol. 6948, pp. 636– 643. Springer, Heidelberg (2011) 11. Molina, M., Stent, A.: A knowledge-based method for generating summaries of spatial movement in geographic areas. International Journal on Artificial Intelligence Tools 19(4), 393–415 (2010) 12. Obis-Seamap, http://seamap.env.duke.edu/ 13. The R Development Core Team. R: A Language and Environment for Statistical Computing. R Foundation for Statistical Computing, Vienna, Austria (2009), http://www.R-project.org 14. Reiter, E., Gatt, A., Portet, F., van der Meulen, M.: The importance of narrative and other lessons from an evaluation of an NLG system that summarises clinical data. In: Proceedings of the 5th International Conference on Natural Language Generation (INLG 2008), Salt Fork, OH (2008) 15. Reiter, E., Sripada, S., Hunter, J., Yu, J., Davy, I.: Choosing words in computer-generated weather forecasts. Artificial Intelligence 67(1-2), 137–169 (2005) 16. Serban, F., Kietz, J.-U., Bernstein, A.: An overview of intelligent data assistants for data analysis. In: Planning to Learn Workshop (PlanLearn 2010) at ECAI (2010) 17. UCR, Uniform Crime Reports, http://www.fbi.gov/ucr/ucr.htm 18. VOSclim, http://www.ncdc.noaa.gov/oa/climate/vosclim/vosclim.html 19. Wahlster, W., André, E., Finkler, W., Profitlich, H.J., Rist, T.: Plan-based integration of natural language and graphics generation. Artificial Intelligence 63, 387–427 (1993) 20. Witten, H., Frank, E.: Data Mining: Practical machine learning tools and techniques, 2nd edn. Morgan Kaufmann, San Francisco (2005)