Genetic Algorithms For The Tomographic Reconstruction Of 2D Concentration Fields Of Atmospheric Gas Claudio Belotti
Fabrizio Cuccoli, Alessandro Manneschi
IFAC-CNR Via Panciatichi, 64 - 50127 Firenze - ITALY
[email protected]
O.U. CNIT at the Department of Electronics and Telecommunications Via di Santa Marta, 3 - 50139 - Firenze, Italy
[email protected] Abstract—A Genetic Algorithm for environmental tomographic applications has been developed. This algorithm has been designed to be applied on the reconstruction of 2D concentration fields of atmospheric gas whose integral measurements are obtained by an open path tomographic system based on IR laser devices. Here we focus on the performance analysis of the genetic reconstruction algorithm applied to simulated two-dimensional scalar fields by processing a set of one dimensional measurements. Keywords-component; Genetic reconstruction, gas remote sensing
algorithm,
Genetic Algorithms (GAs) are adaptive search and optimization methods that mimic the genetic processes involving a population of biological organisms evolving according to the principles of natural selection and 'survival of the fittest' through the generations [5]. GAs use a population of 'individuals' each representing a possible solution to a given problem thus obtaining a parallel exploration of the solutions space.
tomographic
I. INTRODUCTION A Genetic Algorithm for tomographic data processing procedure in environmental applications based on remote sensing measurements is proposed. Genetic Algorithms (GA) have successfully been used in many applications, particularly where the search space is large, noisy, discontinuous or multimodal, thus making it difficult or unsuitable for classical optimization techniques [1]. A genetic approach to the tomographic reconstruction was proposed in [2]. Here we focus on the reconstruction of two-dimensional (2D) concentration fields of atmospheric gas by processing a set of linear concentration measurements that can be obtained by a mobile IR laser system
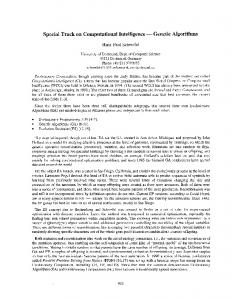
II. GA APPLICATION IN REMOTE SENSING The basis functions we use in this application are 2D Gaussian functions that are completely defined by 4 parameters: the strength H, the width W and the 2D position (xc,yc). Thus if using N basis functions to reconstruct the concentration field, 4xN parameters have to be estimated A GA individual is represented by the 4xN solution parameters, treated as genes, and joined together to form a string of values (referred to as a chromosome as shown in Fig.1). To each individual is associated through a fitness function (or a figure of merit) that is a single numerical value which is supposed to be proportional to the 'utility' or 'ability' of the individual.
The linear concentration measurement is based on the processing of the received IR laser radiation propagated along an open-air rectilinear link connecting a transmitter/receiver laser unit and a passive retroreflector device [3]. A set of linear concentration measurements located on a plane surface can be tomographically processed to retrieve the 2D gas concentration field on the same plane surface [4].
Fig-1 – A chromosome composed by a string of values.
Concentration fields are estimated as linear combination of a finite number of 2D basis functions. In our application the GA applied to tomographic data processing aims to find the best linear combination of 2D basis functions that minimize a global error function depending on the measurements set.
0-7803-8742-2/04/$20.00 (c) 2004 IEEE
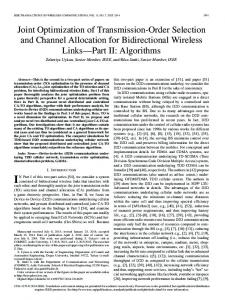
Fig. 2 - Crossover recombination between 2 chromosomes
2170
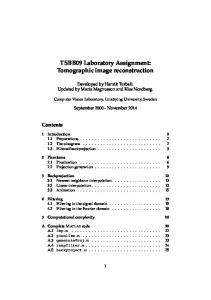
Fig. 3 - Mutation recombination on a chromosome
In our application the fitness function is defined by the RMS difference between the actual field measurements and those obtained by the GA individual. The first step of the proposed GA is the initialization of a population of individuals, then an iterative procedure allows the "genetic" evolution trough the selection and the generation of new individuals. The selection is based on the evaluation of the fitness values and the generation on the application of some genetic operators. GA ends once a prefixed threshold value on the fitness function is reached or, alternatively, after a predefined number of generations. The GA is usually initialized to a population of individuals each carrying randomly assigned genes, otherwise initialization can be forced to exploit a-priori information. The number of individuals of the population is determined by a trade-off between adequate solution space sampling and computation requirements. A whole new population of possible solutions is produced from the current 'generation', mating individuals to produce a new set exploring the most promising areas of the search space. The new generation contains a higher proportion of the characteristics possessed by the good members of the previous generation. In this way, over many generations, good characteristics are spread throughout the population, being mixed and exchanged with other new good characteristics. At each generation, individuals are selected randomly from the population using a scheme that favours the more fit ones. Their chromosomes are recombined, producing offsprings which will comprise the next generation.
Fig. 4 - Simulated 2D field and the tomographic network
III. RESULTS GA has been tested on a large set of simulated 2D concentration fields in order to evaluate the reconstruction performances. As simulated fields we considered those constituted by one, two and three separated maximum concentration areas. Figure 4 shows a simulated field constituted of three maximum areas and the measurements network composed by 21 links; Figure 5 shows the integral values of such configuration that are the input data to the GA, jointly with the tomographic network. One of the parameters of the tomographic reconstruction is the number N of basis functions. It can be pre-assigned in order to exploit any available apriori information on the field features (in the case of the field shown in Fig. 4 N = 3). Here, we tested the algorithm with different values of N in order to analyze the behavior of the solution in function of the number of maximum concentration areas in the simulated field. In order to show how GA converges to the final solution, here we discuss the genetic evolution of the two position genes Xc Yc assuming N=4. Fig. 6 shows the initial distribution of such genes.
Recombination is obtained using the operators of crossover and mutation. Crossover takes two individuals, and cuts their chromosome strings at some randomly chosen position, to produce two 'head' segments, and two 'tail' segments (see Fig. 2). The tail segments are then swapped over to produce two new full length chromosomes. The two offspring each inherit some genes from each parent. This is known as single point crossover. Mutation is applied to each child individually after crossover. It randomly alters each gene with a small probability (see Fig. 3). The traditional view is that crossover is the more important of the two techniques for rapidly exploring a search space. Mutation provides a small amount of random search helping to avoid local minima trapping. Fig. 5 – Integral measurements considering the situation shown in Fig
0-7803-8742-2/04/$20.00 (c) 2004 IEEE
2171
Fig. 6 - Basis function centres (xc,yc) (red markers) distribution for a randomly generated GA population at the first generation. The black empty squares are the positions of the three maximum areas of the 2D field of fig. 4
Figure 7 shows the genetic evolution after 100 and 1000 generations. It is evident how the position genes tends to converge to the central positions of the three maximum areas of the 2D field. Such convergence behavior is always followed independently of N. Using a value of N greater than or equal to the number of maximum regions led to a proper reconstruction of the 2D field. For N strictly greater than the number of maximum (4 or more for the case shown in Fig 4), the algorithm determines negligible values for the strength gene H to the exceeding basis functions. Figure 8 shows one example of reconstructed field for the case N=4. In order to check the robustness of the proposed GA a test about the impact of the initial, random generated population on the final solution was made. This test is based on the qualitatively analysis of the solutions obtained by 100 trials on the same input data set starting from 100 random initial distributions.
Fig. 8 - Example of reconstructed field with N=4 basis functions
This dispersion is spread along the direction of that measurement link crossing both the two lower right maximum areas. Such behavior is typical and it is due to the topology of the measurement network with respect to the position of the maximum areas of the 2D field. Therefore the analysis of the gene convergence, jointly with the network topology, gives useful information about the correctness of the basis function position in the final reconstructed field. The same analysis has been made on the other two genes (W and H), but the evaluation of their genetic evolution is much complicated since the same effect on a measurement link of the tomographic network can be obtained with a large value of strength and a small width or by the opposite (small strength, large width). However the dispersion for H and W is generally higher than that obtained for the position genes.
Also for this test only the position genes xc, yc are considered. Figure 9 shows the final distribution of the position genes after 1000 generations considering 100 random trials. Notice that all the 100 solutions converge to the maximum area centered in (0.35,0.35) while a dispersion is present for the other two areas.
Fig.7 - Basis function centres distribution for a GA population at the 100th (left) and 1000th (rigth) generation
0-7803-8742-2/04/$20.00 (c) 2004 IEEE
Fig.9 - Basis function centers distribution for a GA population at the 1000th generation considering 100 different randomly generated initial populations
2172
REFERENCES
IV. CONCLUSIONS A genetic algorithm for tomographic reconstruction has been developed and tested on simulated two-dimensional scalar fields. The obtained results show correct reconstruction of the simulated fields and robustness with respect to the initial conditions. Solutions proposed will be compared to the stochastic tomographic algorithm of [4] in order to evaluate the reconstruction differences in terms of final reconstruction errors, solution stability and processing time. Moreover GA will be tested on true CO2 concentration data provided by measurement campaigns in geothermal and volcanic areas. ACKNOWLEDGMENT
[1] [2]
[3] [4]
[5]
Smith J.E., “Genetic Algorithms” in “Handbook of Global Optimization”, Volume 2, 275-362. Kluwer Academic Publishers, 2002. K. D. Kihm, K. Okamoto, D. Tsuru, H. S. Ko. “Adoption of a genetic algorithm (GA) for tomographic reconstruction of line-of-sight optical images”. Experiments in Fluids, 22, 137-143, 1996. GasFinder 2.0,Portable System, Operation Manual. Cuccoli F., Tanelli S., Facheris L., Giuli D.; "Infrared Tomographic System for Monitoring the Two-Dimensional Distribution of Atmospheric Pollution over Limited Areas"; Geoscience and Remote Sensing, IEEE Transactions on, Volume: 38 Issue: 4 Part: 2, 1922-1935. July 2000. Goldberg D. E., "Genetic Algorithms in Search, Optimization and Machine Learning". Addison-Wesley, 1989.
The software for this work used the GAlib genetic algorithm package, written by Matthew Wall at the Massachusetts Institute of Technology.
0-7803-8742-2/04/$20.00 (c) 2004 IEEE
2173