AbstractâMethod for Geography Markup Language: GML based representation of time series of assimilation data and its application to animation content ...
(IJARAI) International Journal of Advanced Research in Artificial Intelligence, Vol. 2, No.4, 2013
Geography Markup Language: GML Based Representation of Time Serie of Assimilation Data and Its Application to Animation Content Creation and Representations Kohei Arai 1 Graduate School of Science and Engineering Saga University Saga City, Japan
Abstract—Method for Geography Markup Language: GML based representation of time series of assimilation data and its application to animation content creation and representations is proposed. It is validated the proposed method with NCEP/GDAS assimilation data. Also usefulness of the proposed interpolation method with tweening method is confirmed for unequal time interval of the time series data. Keywords-assimilation data; GML; NCEP/GDAS; tweening method of interpolation
I.
INTRODUCTION
Geography Markup Language: GML1 is proposed by Open GIS Consortium: OGC 2 and is International Standardization Organization: ISO standard of open Geographic Information System: GIS [1],[2]. It is available to represent 3D GIS data with GML and also to represent time series of 3D imagery data. On the other hands, four dimensional assimilation data is available for four dimensional meteorological data representations such as NCEP/GDAS3 , NASA/DAO4 , etc. It allows visual perceptions and manipulations. Therefore, the proposed method may be useful for such purposes with the four dimensional assimilation data.
The following section describes the proposed method followed by implementation and experiments. Then conclusion is described together with some discussions. II.
PROPOSED METHOD
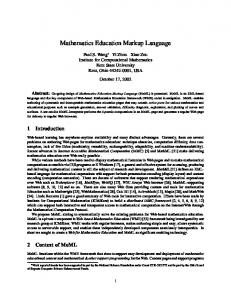
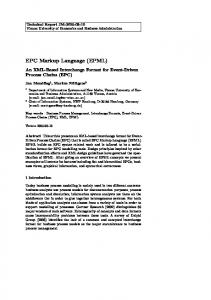
A. Open GIS Open GIS is proposed by Open GIS Consortium: OGC. Open GIS allows collection of geographical data and information through internet in terms of distributed data servicing system based on client server model. Conceptual configuration of Open GIS is shown in Figure 1.
GML based representation is based on client/server system essentially. Therefore, the required assimilation data have to be searched and downloaded. Assimilation data search starts with meta5 search followed by actual assimilation data. Therefore, data search procedure is required for implementations. Also interpolation method is required for equalization of time intervals between assimilation data because the assimilation data is unequal time interval of data. Tweening 6 method is employed for interpolation. Thus the equal time interval of assimilation can be represented and manipulated smoothly. Fig. 1. 1
http://www.opengeospatial.org/standards/gml http://www.opengeospatial.org/ 3 http://www.mmm.ucar.edu/mm5/mm5v3/data/gdas.html 4 http://gmao.gsfc.nasa.gov/ 2
5
http://ja.wikipedia.org/wiki/%E3%83%A1%E3%82%BF%E3%83%87%E3% 83%BC%E3%82%BF 6 http://en.wikipedia.org/wiki/Inbetweening
Conceptual configuration of Open GIS system
Meanwhile, abstracted specification of Open GIS is shown in Table 1 On the other hand, implementation specification is shown in Table 2. Implementation specification includes simple feature, catalog, grid coverage, web map service interface, Geography Makeup Language: GML, web feature service, etc. Essentially, Open GIS system is web based GIS
18 | P a g e www.ijarai.thesai.org
(IJARAI) International Journal of Advanced Research in Artificial Intelligence, Vol. 2, No.4, 2013
system. GML is XML 7 based data description language for geographical data. TABLE I.
which connects middle points of the two adjacent lines is called tweening (in between line). Thus interpolations can be done between two adjacent data.
SPECIFICATION OF OPEN GIS SYSTEM
Fig. 2. TABLE II.
IMPLEMENTATION SPECIFICATION OF OPEN GIS
Tweening Algorithm
Equal time interval of assimilation data file format is converted to GIF8 for animation. Then animated assimilation data can be represented.
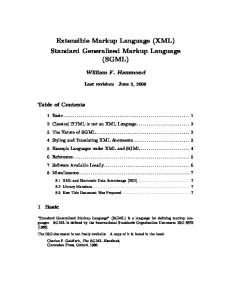
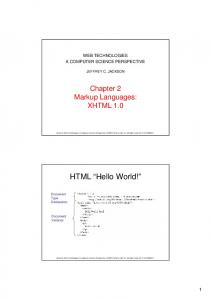
B. Process Flow of the Proposed System Figure 2 shows process flow of the proposed GIS animation and representation based n Open GIS. First, client makes search request for date, region, layer, altitude spatially and temporally. Meta data, then, is searched from the server. After that, search results are down loaded from the server. It is not always that the time interval is constant. In order to demonstrate animation of assimilation data, it is better to show equal time interval of assimilation data periodically. Server provided assimilation data, however, are unequal time interval of time series data. Therefore, some interpolation is required for conversion from unequal time interval of data to equal time interval data. Tweening is utilized for the conversion. Tweening algorithm is as follows, Assuming two data point values, A and B, i-th tweening point, Ti is expressed by equation (1) (1) where N denotes the number of tweening points. Tweening points of the simplest case are shown in Figure 2. In Figure 2, there are only two adjacent data (line in this case). The line 7
http://ja.wikipedia.org/wiki/Extensible_Markup_Language
Figure 2 Process flow of the proposed GIS animation and representation based on Open GIS
8
http://www.tohoho-web.com/wwwgif.htm
19 | P a g e www.ijarai.thesai.org
(IJARAI) International Journal of Advanced Research in Artificial Intelligence, Vol. 2, No.4, 2013
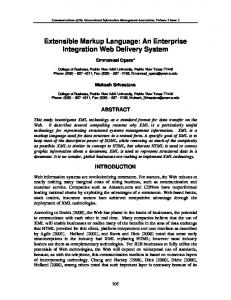
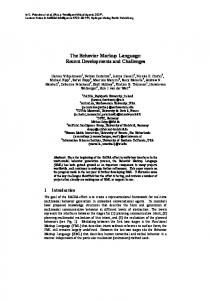
C. Example of GIS Representation with NVIS of GRASS Retrieved GIS data can be represented with NVIS 9 of GRASS 10 software. GRASS is Free Open Source Software: FOSS of GIS. In the GRASS, there is NVIS for GIS representations.
Fig. 3.
The entire query is listed in Table 3. Meanwhile, the ranges for the query parameters are listed in Table 4. Through this web interface, the meta data and the assimilation data in concern can be retrieved with the entire query of attributed parameter for the assimilation data in concern. Then retrieved data is obtained as shown in Figure 7.
Example of GIS representation with NVIS of GRASS software
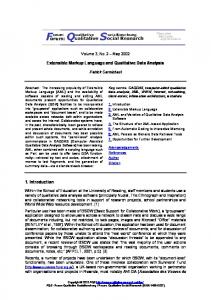
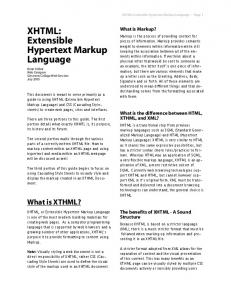
D. Assimilation Data NCEP (National Center for Environmental Prediction)/ GDAS (Global Data Assimilation Model) has 360 by 181 of meshed data of air temperature, relative humidity, cloud fraction, ozone mixing ratio, etc. at the number of altitudes which are predicted every 6 hours a day. NCEP/GDAS is described with GRIB format11 and can be read with wgrib12 of command. Example of NCEP/GDAS of air temperature on the surface is shown in Figure 4. Also example of NCEP/GDAS data of surface air temperature in GML expression is shown in Figure 5.
Fig. 4. Example of NCEP/GDAS assimilation data of surface air temperature
III.
EXPERIEMENT
A. Meta Data Search and Assimilation Data Search Web design is conducted for meta data and assimilation data search. Figure 6 shows the designed web interface of search engine. In this example, the entire query is input from the dialog box in the Figure 6.
Fig. 5. Example of NCEP/GDAS data of surface air temperature in GML expression
9
http://nvisinc.com/index.php http://grass.fbk.eu/ 11 http://en.wikipedia.org/wiki/GRIB 12 http://www.cpc.ncep.noaa.gov/products/wesley/wgrib.html 10
20 | P a g e www.ijarai.thesai.org
(IJARAI) International Journal of Advanced Research in Artificial Intelligence, Vol. 2, No.4, 2013
interval and the time interval is not equal as shown in Figure 9, interpolation is required in space and time domains. Tweening algorithm is utilized for the interpolations. TABLE IV. Date Geographica l region
RANGES FOR THE QUERY PARAMETERS
2001/06/01-2010/05/31 North Boundary(-90-90 degree) South Boundary(-90-90 degree) East Boundary(-180-180 degree)
Layer Name Altitude
Fig. 6. search
West Boundary(-180-180 degree) Air temperature, Relative Humidity, Total Column Ozone, Cloud Fraction, Precipitable Water 1013-100hPa
Designed web interface for meta data search and assimilation data
TABLE III.
ALL THE QUERIES FOR SEARCHING META DATA AND ASSIMILATION DATA
Title
Value
Date
Year Month Day Hour Minite Second
Region
East end Fig. 7.
West end
Example of retrieved assimilation data.
North end South end Coordinate System
Latitude resolution Longitude resolution Unit of geographical coordinate Map projection
Object type Layer name Altitude File name File location Format
B. Retrieved Assimilation Data Example of the retrieved assimilation data is shown in Figure 8. Figure 8 (a) shows the retrieved surface relative humidity while Figure 8 (b) shows that of surface air temperature. Retrieved assimilation data are obtained by altitude by altitude and by time by time. Since the altitude
(a)Relative humidity
21 | P a g e www.ijarai.thesai.org
(IJARAI) International Journal of Advanced Research in Artificial Intelligence, Vol. 2, No.4, 2013
Fig. 10. example of the animation of four dimensional assimilation data representation
IV. CONCLUSION Method for Geography Markup Language: GML based representation of time series of assimilation data and its application to animation content creation and representations is proposed. It is validated the proposed method with NCEP/GDAS assimilation data. Also usefulness of the proposed interpolation method with tweening method is confirmed for unequal time interval of the time series data.
(b)Air temperature Fig. 8.
Example of retrieved assimilation data
ACKNOWLEDGMENT The author would like to thank Mr. Keiji Ono for his effort to implement GIS system and to conduct the experiment with four dimensional assimilation data. [1] [2]
Fig. 9. Example of four dimensional assimilation data with equal space and time intervals which is derived from those with unequal space and time intervals through tweening algorithm of interpolation
After that, these assimilation data format is converted to GIF format for animation representations. Thus animation of four dimensional assimilation data representation can be done as shown in Figure 10.
REFERENCES K.Arai, Jave based methods for remote sensing satellite imagery data processing, Morikita Publishing Co. Ltd., 2001. Kohei Arai, Cahpter 4: A sea surface temperature estimation method for ocean areas and seasons u sing a GIS as Neural Netwrok, Sediment and Ecohydraulics INTERCOH 2005, T.Kusuda, H.Yamanishi, J.Spearman and J.Z.Gailani, Edt. Elsevier, ISBN:978-0-444-53184-1, 43-51, 2008.
AUTHORS PROFILE Kohei Arai, He received BS, MS and PhD degrees in 1972, 1974 and 1982, respectively. He was with The Institute for Industrial Science, and Technology of the University of Tokyo from 1974 to 1978 also was with National Space Development Agency of Japan (current JAXA) from 1979 to 1990. During from 1985 to 1987, he was with Canada Centre for Remote Sensing as a Post Doctoral Fellow of National Science and Engineering Research Council of Canada. He was appointed professor at Department of Information Science, Saga University in 1990. He was appointed councilor for the Aeronautics and Space related to the Technology Committee of the Ministry of Science and Technology during from 1998 to 2000. He was also appointed councilor of Saga University from 2002 and 2003 followed by an executive councilor of the Remote Sensing Society of Japan for 2003 to 2005. He is an adjunct professor of University of Arizona, USA since 1998. He also was appointed vice chairman of the Commission “A” of ICSU/COSPAR in 2008. He wrote 30 books and published 332 journal papers
22 | P a g e www.ijarai.thesai.org