with day of the week, season of the year, and various lunar variables (lunar phase, dis- tance of the moon from the earth, and moon-sun tidal index).
Perceptual and Motor Skills, 1992, 74, 483-488.
O Perceptual and Motor S l d s 1992
GEOPHYSICAL VARIABLES AND BEHAVIOR: LXVIII. DISTAL AND LUNAR VARIABLES AND TRAFFIC ACCIDENTS I N SASKATCHEWAN 1984 TO 1989 '"" W. H. LAVERTY, I. W. KELLY, AND M. FLYNN U n i u e r s i ~of Saskatchewan
J. ROTTON Florida International U n i v e r s i ~ Summary.-The daily total number of traffic accidents and traffic accident severity for the years 1984 to 1989 in Saskatchewan were analyzed to estimate relationships with day of the week, season of the year, and various lunar variables (lunar phase, distance of the moon from the earth, and moon-sun tidal index). A regression model with both a linear term and a trigonometric term was fitted to the data. No relationship between lunar cycles and total accidents or severity of accident was found. A larger number of total accidents was found during the winter months and weekends; however, more severe accidents tended to occur during the summer months. A slight linear trend was uncovered for total accidents over the time period under consideration.
Traffic accidents are a major concern in Canada. In Saskatchewan alone for the years 1984 to 1989 on average over thirty-three thousand accidents were reported yearly, with annual estimated property damages of ninety million dollars. In addition, two hundred deaths occur each year on Saskatchewan highways. The yearly Saskatchewan Traffic Accident Facts ( 1990) published by Saskatchewan Highways and Transportation provides information on annual Saskatchewan traffic accidents in relation to location, time of occurrence, injuries, fatalities, vehicle factors, and environmental circumstances such as road surface and weather conditions. The present study involves a more sophisticated analysis utilizing regression. Not only were we concerned with any linear trend over the six-year time period under consideration (1984-1989) but also included was a trigonometric polynomial term for modelling deterministic cyclical patterns. We decided to include lunar variables such as lunar phase, lunar distance from the earth, and an over-all lunar-solar tidal index in our model. The belief that lunar variables are related to the number and severity of traffic accidents is widespread among emergency hospital staff and those in law 'The authors thank Dwight McNau hton and Saskatchewan Highways and Transportation for roviding the data on which chis stu$ was based. 'Requests for reprints should be addressed to I. W. KeUy, Department of Educational pychology, University of Saskatchewan, Saskatoon, Canada S7N OWO. A transcript of the data for this study is on file in Document NAPS-04927. Remit $13.75 for photocopy or $4.00 for fiche to Microfiche Publications, POB 3513, Grand Central Station, New York, NY 10163.
484
W. H. LAVERTY, ETAL.
enforcement even though the lunar hypothesis is not supported by empirical research (Rotton & Kelly, 1985; Culver, Rotton, & Kelly, 1988).
DATACOLLECTION AND METHODOLOGY The daily total number of reported traffic accidents (200,545), injuries (34,739), and fatalities (1094) were obtained from Saskatchewan Highways and Transportation for the years 1984 to 1989 (n = 2192 days). The two response variables of concern in this study were (i) total daily accidents and (ii) a daily severity index that was defined as injuries plus fatalities per accident. In this study we fitted a regression model with a linear term (for trend) and a trigonometric term (for deterministic cyclical patterns). In addition, we included terms for day of the week, lunar phase (the 29.5 synodic lunar cycle was divided into four equal intervals-new moon, first quarter, full moon, and third quarter), lunar distance from the earth (where the mean moon distance from the earth is 384,000 km), and luni-solar tidal index. This index is approximately proportional to the magnitude of the combined lunar-solar tidal force. It is based on a model developed by astronomer Nick Sanduleak (1985). This model takes into account the relative positioning of the earth, sun, and moon and the varying earth-moon and earth-sun distances, but assumes a l l three bodies move in a common plane.
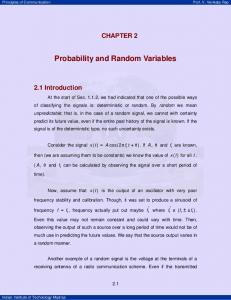
RESULTS A model containing a linear trend and a trigonometric polynomial term for modelling yearly cyclical variation and day of week was fitted using stepwise regression for each response variable (total accidents, severity index) separately. This model yielded the equations found in Table 1. An examination of the equations indicates a small linear trend (0.8139 accidents per year for total daily accidents). Fig. 1 indicates a seasonal effect; a higher number of TABLE 1
REGRESSIONEQUATIONS SHOWING TRENDS, SEASONAL,AND DAYOF THE WEEKEFFECTS Total No. of Accidents = 75.90745 + 0.8139 Time - 9.46169 sin [Zi~Time] - 3.21174 sin [4rTime] - 3.97336 sin [8xTime] + 12.79857 cos [2?rTirne]+ 8.69761 cos [4rTirne] - 3.71242 cos [6~Time]+ Day of the Week Effect where
Day of the Week Effect =
0.00000 if day = 7.35318 if day = 7.68737 if day = 13.89801 if day = 31.96849 if day = 28.39572 if day = 0.00000 if day =
(continued on next page) Note.-Time
= year-1984.
Monday Tuesday Wednesday Thursday Friday Saturday Sunday
TRAFFIC ACCIDENTS: DISTAL AND LUNAR VARIABLES
485
TABLE 1 (CONT'D) REGRESS~ON EQUATIONS SHOWING TRENDS, SEASONAL, AND
DAYOF THE WEEKEFFECTS
Injuries/Fatalities per Accident = 0.31014 - 0.00721 sin [ZrTirne] + 0.00985 sin [BrTime] - 0.00931 sin [10?rTimel - 0.00651 sin [lZ~Time] - 0.07931 cos [ZrTime] + 0.01068 cos [6sTirne] + 0.00715 cos [lOaTime] +Day of the Week Effect where
Day of the Week Effect =
Note.-Tie
-0.05307 -0.06797 -0.05477 -0.06245 -0.04581 0.00000 0.00000
if if if if
day = day = day = day = if day = if day = if day =
Monday Tuesday Wednesday Thursday Friday Saturday Sunday
= year-1984.
total accidents occur during the winter months. In addition, Fridays and Saturdays are associared with larger total accident frequencies than the other days of the week. O n the other hand, the severity index is not related to any linear trend but a higher injurieslfatalities per accident ratio occurred during
Total Number
of Accidents
lso
Per Day
,m 50
Year
Injuries and Fatalities Per
OS-
Accident 7
Year
FIG. 1. Trend and seasonal effects for accident data
486
W. H. LAVERTY. ETAL
the summer months. Also, more severe accidents tend to occur on weekends (Saturdays and Sundays). A second analysis was performed with the addition of five lunar variables including three dummy variables representing the four phases of the synodic lunar cycle, and lunar distance and the luni-solar tidal index. As Table 2 indicates, for both total accidents and severity of accidents nonsignificant results were obtained in regard to the lunar variables. Although the lunar variables combined for total accidents approached significance ( p = 0.06), it should be pointed out that with the very large sample (n = 200,545 total accidents), extremely small effects will be detected. The partial correlations ranged from -0.044 (p = 0.039) for tidal index to 0.036 ( p = 0.089) for lunar distance. I t should be noted that the only partial correlation that reached statistical significance was trivial and was also opposite to what one might expect, given Lieber's 'biological tides hypothesis' (Lieber, 1978), that is, there was a negative correlation between combined moon-sun tidal pull and total automobile accidents. TABLE 2 SUMMARY: ANALYSIS OF VARIANCE FORTESTINGEFFECTOF LUNARVARLABLES Source Total Analysis Trend Variables Lunar Variables Residual Total Injury-Fatality Analysis Trend Variables Lunar Variables Residual Total
SS
df
MS
F
P
727499.3 1 5948.40 1239251.10 1972698.81
12 5 2173 2190
60624.94 1189.68 570.30
106.30 2.09