Bob Larkin. 2 .... (Friedman School of Nutrition Science & Policy, Tufts University) are thanked for sharing interim data-scraping outcomes that compared ...
Geospatial Monitoring of Cropping System Dynamics and Production Footprints in Maine Sherri
1 DeFauw ,
Bob
2 Larkin ,
Patrick
3 English ,
Aaron
4 Hoshide ,
Andrew
5 Plant
and John
2 Halloran
1Pennsylvania
State University, Dept of Agricultural Economics, Sociology & Education, University Park PA 2USDA, ARS, New England Plant, Soil & Water Lab, Orono ME 3Mississippi State University, Delta Research & Extension Center, Stoneville MS 4University of Maine, School of Economics 5UMaine Cooperative Extension, Houlton ME INTRODUCTION Tracking the spatial interdependencies of cropping systems is an often overlooked component of agricultural sustainability. Geospatial frameworks help resolve patterns and trends in production environments at multiple scales that may enable improvements in adaptive management strategies which enhance yield, increase whole-farm profitability, and foster sustainable land and water use. The objectives of this investigation were to: (1) assess production footprints for Maine cropping systems using 2008-2011 Cropland Data Layer (CDL), Common Land Unit (CLU), digital elevation models (DEM) and National Agriculture Image Program (NAIP) datasets; (2) examine geospatial relationships of potato, small grains, corn, and broccoli; (3) interrelate production areas with agri-environmental indicators (Soil Survey Geographic – SSURGO 2.2); and (4) evaluate dominant crop sequences and potential economic impacts of select alternate crops across 3 yrs (2008-2010) using a 324-ha potato farm model. Gauging these relationships helps food system researchers assess economies of scale linked to agro-ecoregions, productive capacity pools, and land quality.
Table 1. Net farm income (NFI) ha-1 for row and forage crop enterprises (listed by production scale) for a 324-ha Maine farm. N
Figure 4. Spatial interdependencies derived from 2008-2011 CDLs (w/ “raw” values rounded to nearest hundred ha).
N
Figure 3. Four-year production footprints for potato (dark brown pixels), “small grains” aggregation (purple – combines barley, oat, rye, spring and winter wheat), corn (amber), and broccoli (green).
USDA, NASS 2008-10 CDLs
Cropland Data Layer Time-series
Potato
Corn
intercept = 3548.608 beta = 0.818 R-squared = 0.844
1:3,000,000
2009 – 28,200 ha 2010 – 29,300 ha
1:250,000
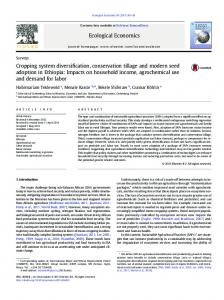
Figure 1. Cropland data layer (CDL) time-series with inset (on right) showing 3-yr mosaic of potato fields (around Caribou and Presque Isle, Aroostook County, ME).
Soybean
intercept = 2940.267 beta = 0.929 R-squared = 0.953
intercept = 5210.317 beta = 0.983 R-squared = 0.962
intercept = 1802.040 beta = 1.015 R-squared = 0.979
Barley
Canola
2008 - 26,800 61,900 ha ha
b
c
a Assumes
perennial stand (years) for alfalfa, haylage, dry hay, and pasture (5), and clover (3). b Dry hay and straw harvested as round bales. For small grain+ straw, yield per hectare and price per metric ton c Spring wheat. d Establishment year only. for both straw and grain. e Yield per hectare required to have NFI per hectare identical to potatoes at each of the four production scales evaluated.
Table 2. NFI ha-1 for potato rotations on a 324-ha Maine farm.
Presque Isle ME
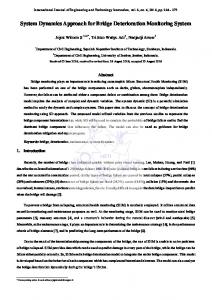
MATERIALS and METHODS Georeferenced data for cropland/land use patterns (based on CDL/NLCD classifiers), farmland delineations (CLU), soils (SSURGO – farmland and erodibility classifiers), topography (NED 10 m) and NAIP datasets were integrated in ArcGIS (v.10). Producers and users accuracies for remotely-sensed crops (56 m resolution CDLs, Fig. 1) varied from year to year depending on image acquisition dates, planting dates, row crop adjacencies, field boundary complexity, weed species incursions, use of cover crops and/or strip cropping. Crop areas extracted from CDLs were compared with county-level Census of Agriculture records (Fig. 2). Small grains (barley (B), oat (O), rye (R), spring and winter wheat) were aggregated to improve aerial extent assessments. CLUs were then used to constrain CDL classification errors. Economic Analyses. Crop sequences in potato production systems derived from the 2008-2010 CDL map products were used to assess the net farm income (NFI) for potatoes and the top 12 rotation crops. NFI was calculated in Excel spreadsheets for both individual crop enterprises as well as whole-farm scenarios. Representative enterprise and whole-farm budgets were constructed for potatoes and potato rotation crops. Sensitivity analyses were run to provide break-even yields for each potato rotation crop. In addition, “short-run” (S-R) and “long-run” (L-R) analyses were conducted in an attempt to account for potential yield impacts associated with rotation length. S-R assumed constant potato yields (31.66 Mg ha-1); L-R assumed an increase 28.6% in 3-yr versus the traditional (or baseline) 2-yr rotations, whereas potato-potato-crop X (PPX) and continuous potatoes are expected to have potato yields that are 14.3% and 28.6% lower than potato-crop X two-year rotations (Myers et al. 2008; Mohr et al. 2011). USDA, NASS
S
Figure 5. Spatial interdependencies derived from 4-yr CDLs using ‘cropland’ CLU delineations (hectare values have been rounded to nearest hundred).
a
Fort Fairfield ME
S
Alfalfa
intercept = 3615.312 beta = 1.073 R-squared = 0.833
intercept = 6912.622 beta = 0.762 R-squared = 0.506
Figure 2. Crop-specific comparisons of county-level Census of Agriculture/Survey areas (on y-axis) with aerial extents extracted from CDLs (on x-axis) for all years throughout the US.
RESULTS Geospatial integration of CDL and CLU layers with soils revealed a 4-yr potato footprint estimated at 56,200 ha with 67% and 27% residing on ‘prime farmland’ (PF) and ‘farmland of statewide importance’ (FSI), respectively. Over 85% of potato production soils require the highest standards in conservation practices as they are classified ‘potentially highly erodible land’ (PHEL) or ‘highly erodible land’ (HEL) (DeFauw et al. 2012). Geospatial interdependency of potato-small grains (barley, rye, oat, spring and winter wheat) had an estimated 4-yr cropland overlap of 77% (Fig. 3-6). Broccoli (Br) was grown on 13% of the 4-yr potato cropping system land base (Fig. 3,5,6), whereas 6% was shared with corn (Fig. 3,5). Forecast models were developed to account for rotational complexity; the 6-yr land base estimate for sustaining Maine’s potato systems is approx. 67,000 ha, small grains may occupy 65,000 ha, corn approx. 22,000 ha, and 10,000 ha for broccoli (Fig. 7). NFIs ha-1 for enterprises & rotation crops are summarized in Table 1 & 2.
Figure 6. Comparison of raster scenes including: a USDA, FSA, NAIP 18 June 2009 (1 m resolution); b CDL 2009 (56 m) with B=deep pink, Br=orange, P=brown, R=purple; c RGB composite showing crop sequence mosaic from 2008-10 CDLs with P-B-P (purple), P-Br-B (bright green), B-P-B (dark green), Br-R-P (bright red). Scale:1:24,000.
a Two
Figure 7. Production footprint ‘6-yr forecasts’ derived from CDL datasets (2008-2011) and CLU delineations.
years of potatoes followed by a third year of rotation crop. b One year of potatoes followed by second year of rotation crop. c One year of potatoes followed by two years of rotation crops. d Dry hay and straw harvested as round bales. e Spring wheat. f Short-run assumes potato yields are the same across rotations. Yields of other crops in rotation with potatoes are held constant. g Long-run assumes potato yields are impacted by rotation effects on potato yield. Three-year rotations assume 28.6% higher yield than two-year rotations, while PPX and continuous potatoes have 14.3% and 28.6% lower yields than two-year rotations respectively (Myers et al. 2008, Mohr et al. 2011). Yields of other crops in rotation with potatoes are held constant.
CONCLUDING REMARKS Agronomists and farmers are tasked with attempting to double food production over the next 30 years which may entail spatial reallocation and optimization of crop water and energy footprints to better comply with ‘localized’ soil and water resource constraints. Distinctive shifts in Maine agroecosystems occur from north to south with more intensively managed irrigated farms to the north undergirded by the southern “dairy belt”. Over 25 years ago, Hepler and colleagues (1985) noted a shift toward increased dependence on PF soils in cropping systems (especially potato). Our latest findings indicate that 67% of the 4-yr potato production footprint (CDL-CLU derived) resides on prime farmland; ~50,000 ha require the highest standards in soil conservation (PHEL or HEL). Potato is in the top tier of crops with the highest erosion risk as harvest-related erosion rates are of the same order of magnitude (almost 10 Mg ha-1 yr-1) as water and tillage erosion on sloping land (Auerswald et al. 2006). Across 4 years, ~600 ha was detected in continuous potato. Potato systems in 2-year rotations involved ~14,000 ha (out of 22,000-23,000 ha planted yr-1) suggesting farmers have diversified their operations and appear to be shifting to rotations of 3+ years. The geospatial methodologies developed also facilitate monitoring shifts in crop adjacencies and thus provide a basic framework to evaluate future finerscale dynamics of yield impacts as well as pest and/or pathogen pressures (and associated resistance issues) that may develop as a result of these configurations. Assessments linking land use, agri-environmental indicators and current crop sequences in key agroecosystems (such as potato or corn) serve to help producers, communities and policy makers begin to gauge land base requirements, spatio-temporal stability of productive capacity pools, natural resource use, land quality, farmscape economies and potential food systems security risks at multiple scales. REFERENCES Auerswald K, G Gerl and M Kainz. 2006. Influence of cropping system on harvest erosion under potato. Soil Till Res 89: 22-34. DeFauw SL, RP Larkin, PJ English, JM Halloran and AK Hoshide. 2012. Geospatial evaluations of potato production systems in Maine. Am J Potato Res DOI: 10.1007/s12230-012-9271-2 (6Oct2012) Hepler PR, LH Long, KJ LaFlamme and JH Wenderoth. 1985. Field appraisal of resource management systems FARMS: Crop yield and quality relationships with soil erosion 1982. Maine Agricultural Experiment Station, Orono, Bulletin 811: 1-21. Mohr, RM, K Volkmar, DA Derksen, RB Irvine, M Khakbazan, DL McLaren, MA Monreal, AP Moulin and DJ Tomasiewicz. 2011. Effect of rotation on crop yield and quality in an irrigated potato system. Am J Potato Res 88: 346-359. Myers P, CS McIntosh, PE Patterson, RG Taylor and BG Hopkins. 2008. Optimal crop rotation of Idaho potatoes. Am J Potato Res 85: 183-197. ACKNOWLEDGEMENTS The authors (SLD and RPL) gratefully acknowledge funding from the USDA's National Institute of Food and Agriculture (NIFA) under grant no. 2011-68004-30057. Scott A. Samson (Geosystems Research Institute, Mississippi State University) supplied timely advice that was genuinely appreciated. Lindsay Hodgman and Tara King (USDA, NRCS – Bangor, ME) are kindly thanked for their assistance with SSURGO-related concerns. Chris Peters and Graham Jeffries (Friedman School of Nutrition Science & Policy, Tufts University) are thanked for sharing interim data-scraping outcomes that compared county-level Census of Agriculture/Survey harvests with “raw” CDL extracts nationwide.