Dept. of Computer Science, National Tsing Hua University, Taiwan. {gavins ..... the B.S. degree in computer science from National Tsing Hua. University in 1999 ...
A Two-Phase Pitch Marking Method for TD-PSOLA Synthesis Cheng-Yuan Lin and Jyh-Shing Roger Jang Dept. of Computer Science, National Tsing Hua University, Taiwan {gavins,jang}@cs.nthu.edu.tw
Abstract. This paper describes a robust two-phase pitch marking method based on peak-valley decision and dynamic programming. In the first phase, we select either peaks or valleys for pitch mark candidates according to its similarity to an estimated pitch curve. In the second phase, we define state and transition probabilities, and then employ dynamic programming to find the most likely pitch marks. We have also designed different tests to demonstrate the feasibility of the proposed approach.
1 Introduction In concatenative speech synthesis, TD-PSOLA [2] (Time-Domain Pitch Synchronous Overlap and Add) is the most widely used method for pitch/duration modification. An essential part of TD-PSOLA is pitch marking, which tries to find the glottal closure instant (GCI) in order to perform synchronous analysis. If the result of pitch marking is not good, TD-PSOLA will produce low-quality speech. As a result, it is very important to have an efficient and effective pitch marking method, especially for realtime pitch scaling in various applications, such as voice changers in karaoke machines. Pitch marking is a time consuming and error prone task, which has been tackled by several approaches [11][10][1], including GCI detection and wavelet-based algorithm. In the approach using GCI detection, there are two major approaches: one is the maximum likelihood method and the other is derivative of glottal airflow. Moulines et al. [8] proposed a pitch marking method to detect abrupt changes at GCI. On the other hand, M. Sakamoto [5][7] proposed an automatic pitch marking using waveletbased features, where GCI was detected by searching for local maxima in the wavelet domain. In this paper, we propose a two-phase algorithm for detecting pitch marks in a reliable manner. In phase 1, we need to decide to use pitch marks at peaks (local maxima) or valleys (local minima). This is motivated by our experiments which indicate that, in most cases, valley-based pitch marks are more robust than peak-based ones. Consequently, we develop a quick scheme for choosing peaks or valleys as our candidates for a detailed pitch marking method in phase 2. In phase 2, we use dynamic programming to extract optimal pitch marks. Our computation is based on speech waveform only, so it is more efficient than wavelet-based approach [7]. The
proposed approach is similar to Viterbi decoding [6] which is commonly used in hidden Markov models (HMM) for speech recognition. The key point is to define state and transition probabilities, which is explained later this paper. This paper is organized as follows. Section 2 introduces a quick scheme that we use to determine whether to use peak or valley-based pitch marks. Section 3 explains a robust pitch marking method using dynamic programming. Section 4 describes our experiments to demonstrate the performance of the proposed two-phase approach. Section 5 gives conclusions of this paper.
2 Pitch Marks at Peaks or Valleys Pitch marks are almost always located at peaks (local maxima) or valleys (local minima) of a speech waveform. When we play a waveform, it would produce virtually the same perceptual effect if we flip the waveform up side down. This would make most people think that pitch marks at peaks and valleys will produce almost the same effect for TD-PSOLA’s pitch/duration modification. However, according to our experience, the effect could be quite different. The difference between pitch marks at peaks and valleys may be attributed to two facts. First of all, the glottal airflow is not symmetric with respect to its mean value. Secondly, the recording device (microphone and corresponding circuits) may not have symmetric response either. As a result, it is important to evaluate and select pitch marks at peaks or valleys before inventing a better method for detecting pitch marks. Before detecting the pitch marks, we need to identify the pitch contour of a given voiced segment. This is accomplished by the common practices of using ACF (AutoCorrelation Function) or AMDF [9] (Average Magnitude Difference Function) on each frame to find a framed-based pitch value. Here for computational simplicity, we adopt AMDF for pitch tracking. We also use a median filter to remove pitch errors and ensure continuity in pitch contour. Once we obtain the pitch value of a frame in a voiced segment, we can use the identified fundamental period as a basis for finding the pitch marks in the frame. This simplest pitch marking (SPM) method can be summarized as follows: 1.
Find the global maximum of the waveform. Denote its time coordinate as tm .
2.
This is the first pitch mark. Search other pitch marks to the right of tm by finding the maximum in the search region [t m + f * T0 , t m + ( 2 − f ) * T0 ] , where T0 is the pitch period
3.
and f is factor whose range could be 0.5~0.9, usually is set 0.7. Repeat the same procedure until all pitch marks (maximum points) to the right of the global maximum are found Repeat step 3 to find pitch marks to the left of tm . (The search region should be
[t m − f * T0 , t m − ( 2 − f ) * T0 ] instead.)
The above algorithm can find peak-based pitch marks. A similar method can be easily conceived to find valley-based pitch marks. As mentioned earlier, these two types of pitch marks do not have the same performance under the same pitch marking method. Hence we need to have a quick method to do peak/valley decision before using a sophisticated method for pitch marking. The algorithm is listed as follows: 1.
Perform SPM to find the peak and valley based pitch marks. Denote the corresponding instantaneous pitch curves as Pp and Pv , respectively.
2.
Find the pitch contour from each frame and interpolate the pitch contour to have the same length as Pp and Pv . Make peak/valley decision based on their similarity to the interpolated (or “roughly correct”) pitch curves.
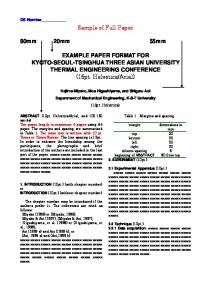
The following figure shows the result of peak-based pitch marking. Its deviation from the interpolated pitch curve is quite obvious. (The speech waveform is one of the Mandarin Chinese syllables) Waveform and pitch marks wave pitch marks
0.2
Amplitude
0.1 0 −0.1 −0.2 −0.3 −0.4 1000
2000
3000
4000
5000
6000
7000
8000
Two pitch curves: one is estimated by AMDF pitch tracking and the other is estimated by distance of pitch marks
Frequency (Hz)
340
Correct Pitch Pitch estimated from pitch marks
320 300 280 260 240 10
20
30
40
50
60
70
80
90
100
Fig.1. The result from peak searching based pitch marking.
The following figure shows the result of valley-based pitch marking. And the result is better with less deviation.
Waveform and pitch marks wave pitch marks
0.2
Amplitude
0.1 0 −0.1 −0.2 −0.3 −0.4 1000
2000
3000
4000
5000
6000
7000
8000
Two pitch curves: one is estimated by AMDF pitch tracking and the other is estimated by distance of pitch marks Correct Pitch Pitch estimated from pitch marks
Frequency (Hz)
320 300 280 260 240 10
20
30
40
50
60
70
80
90
100
Fig.2. The result from valley searching based pitch marking.
We enlarge a part of Fig.4 to investigate the deviation between sample indices 5000 and 5050, as shown next. Waveform and pitch marks
wave pitch marks
0.2
Amplitude
0.1 0 −0.1 −0.2
Wrong pitch mark
Correct pitch mark
−0.3 −0.4 5150
5100
5050
5000
4950
Two pitch curves: one is estimated by AMDF pitch tracking and the other is estimated by distance of pitch marks
Frequency (Hz)
320
Correct Pitch Pitch estimated from pitch marks
300 280 260 240 53
54
55
56
57
58
59
60
61
Fig.3. The enlarged partial section of figure 2
62
63
It is obvious that the deviation comes from the fact that we always pick the minimum point instead of the correct one which does not have the minimal value. To overcome this problem, we propose the use of dynamic programming for robust pitch marking, as explained in the next section.
3 Dynamic Programming based Pitch Marking Based on the analysis and approach presented in the previous section, we can roughly choose peaks or valleys as better candidates for pitch marks. After this peak/valley decision is made, we still need to apply a more sophisticated algorithm for finding the exact locations of the pitch marks in a voice segment. For simplicity in the following discussion, we shall assume that we have picked peaks as candidates for pitch marks. If valleys are picked, we can simply flip the signals up side down and follow the same discussion. It is obvious that good candidates of pitch marks should have the following two characteristics: 1. 2.
Their magnitude should be large. Their distances to the next adjacent pitch marks represent instantaneous pitch. Since pitch should be a smooth function, the distance (as a function of the pitch mark index) should also be smooth.
However, these two criteria are not always in agreement. As a result, we propose a method based on dynamic programming to find the best pitch marks. Specifically, we shall preserve N candidates in each search region instead of only one pitch mark in the aforementioned quick and dirty method. In this paper, the value of N is 3 for achieving the optimal tradeoff between performance and efficiency. Since the above two criteria are sometimes contradictory, we convert the criteria into probabilities and then try to find the optimum pitch marks with the maximal accumulated probability. The approach to find the optimal pitch marks is close to Viterbi search, in which dynamic programming is used to find the optimal path in an efficient manner. This is achieved via the following three steps. 1. 2.
3.
Compute the state probability of each candidate in a search region. The state probability of a candidate (peak) is roughly proportional to its height. Compute the transition probability of each candidate in a search region. The transition probability depends on how close the distance to the average pitch period of the entire voice segment. Apply dynamic programming to find the up-to-now optimal accumulated probability until all candidates are processed. Then back track to find those pitch marks that contribute to the optimal accumulated probability. Details of these steps will be explained in the following sub-sections.
3.1 State Probabilities Each search region contains at most n pitch-mark candidates. The state probability associated with candidate j in search region i should be related to the height of candidate j . In other words, the higher the candidate is, the more likely it is a pitch mark. In view of this, first we define a relative measure indicating the degree of “high” for candidate j in search region i :
si ( j ) =
hi ( j ) − hmin , hmax − hmin
Where j ranges from 1 to n ; hi ( j ) is the height of candidate j in region i ; and
hmax and hmin are the maximum and minimum of the voice segment, respectively. Furthermore, we need to normalize si ( j ) to obtain the state probability si ( j ) of candidate j at search region i : si ( j ) = Where
α
siα ( j ) n
∑s k =1
α
i
,
(k )
is a parameter that can be used to adjust the relative importance of
si ( j ) . This normalization procedure will make the summation of state probabilities within a given search region equal to 1.
3.2 Transition Probabilities Since each search region have n candidates, we need to construct an n × n matrix for each search region (except for the last one), representing the transition probabilities of n candidates within an given search region to those within the next one. To find the transition probability, first we need to find the “most likely” pitch. This is achieved by interpolating the pitch curve obtained from each frame using the common practice of pitch tracking. Once the most likely pitch is derived, we can find the transition probability according to the difference between the “instantaneous” pitch (of two candidates located in adjacent search regions) and the “most likely” one. Before computing the transition probability, we need to define a relative measure indicating the degree of “similar” between the “instantaneous” and “most likely” pitch frequencies, as follows:
t i ( j1 , j 2 ) =
1 1+ β f −
fs d ,
Where f is the “most likely” pitch frequency at the middle between search regions i and i + 1 ; f s is the sampling rate; d is the distance (in terms of sample points) between candidate j1 and j2 ;
β
is a parameter for fine tuning the similarity.
By using the above similarity measure, the transition probability ti ( j1 , j2 ) from candidate j1 in search region i to candidate j2 in search region i + 1 can be expressed as follows:
ti ( j1 , j2 ) =
tiγ ( j1 , j2 ) n
∑t γ ( j , k) k =1
Where
γ
i
1
,
is a parameter that can be used to adjust the relative importance of
ti ( j1 , j2 ) . This normalization procedure will make the summation of transition γ
probabilities emitting from a given candidate equal to 1. 3.3 Recurrent Relation via Dynamic Programming In the formulation of dynamic programming, we should use log probabilities to lessen truncation and round-off errors. Let us define P(i, j ) as the optimal accumulated log probability from the beginning to candidate j in search region i . The recurrent relation can be expressed as follows: P (i , j ) = max (P (i − 1, k ) + log 10 (t i (k , j ))) + log 10 ( si ( j )) , k
B (i , j ) = arg max (P (i − 1, k ) + log 10 (t i (k , j ))) , k
Where B (i, j ) records the optimal previous candidate at candidate j of search region i . The boundary condition of the above recurrent relation can be expressed as: P(1, j ) = log10 ( s1 ( j )) , for j=1 to n. The optimal accumulated log probability can be found as.
max P(m, j ) j =1~ n
And all the other optimal pitch marks can be backtracked by using the information recorded at B (i, j ) . In a preliminary experiment, we used the same speech waveform that was adopted in the first phase to examine the performance of this scheme. The following figure demonstrates that the proposed approach does outperform the simple pitch marking procedure introduced earlier.
Wave form
0.2
wave pitch marks
0.1
Amplitude
0
−0.1
−0.2
−0.3
−0.4
1000
2000
3000
4000
5000
6000
7000
8000
Two pitch curves: one is estimated by AMDF pitch tracking and the other is estimated by distance of pitch marks
310
Frequency (Hz)
300
Correct Pitch Pitch estimated from pitch marks
290
280
270
260
250
240
10
20
30
40
50
60
70
80
90
100
Fig.4. The result of pitch marking based on dynamic programming.
Some implementation techniques that can improve the efficiency of the proposed approach is covered in the next section. 3.4 Parameters Estimation In the definitions of state and transition probabilities, there are three parameters α , β , and γ that can be used to adjust the relative importance of several similarity/distance measures. The values of these parameters are usually identified via a gradient-free optimization scheme, such as downhill Simplex method [4] on a training dataset. The identified parameters are then used on a test set to verify the performance of the proposed approach. 3.5 Efficiency Consideration In practice, the SPM (Simplest Pitch Marking) does not always perform unsatisfactorily. For efficiency consideration, we can accept the result from SPM on either peaks or valleys if its variance of corresponding pitch vector is smaller than a threshold. During the computation of dynamic programming, we can also apply common speedup mechanisms, such as beam search (which is often used in Viterbi decoding for speech recognition), to save the computation time. These efficiency considerations are important for real-time implementation of pitch scaling, for applications such as voice changers in karaoke machines.
4 Experiments We design three different experiments for speed, error rates and MOS [3] (Mean Opinion Score) values, respectively. The speech data is derived from about 400 different voiced segments with more than five hundred seconds duration. Moreover, the CPU of test machine is Pentium IV 1.6 GHz. The error rate is defined as follows:
ErrorRate =
counts of error pitch marks counts of all pitch marks
The correct pitch marks were labeled by computers first using the simplest pitch marking, and then corrected by human. We use 1/3 of the data for training the parameters α , β , and γ using downhill Simplex method, and the other 2/3 for testing the performance. The same test data was used for testing other approaches. The results are shown in the next table. Table 1. The performance comparison of three characteristics for each method.
Baseline 1 (peaks only) Baseline 2 (valleys only) Baseline 3 (peaks or valleys) Wavelet method Our method (two-phase)
Speed (second) Error rates (%) 1.6 4.51%
MOS (score) 3.65
1.5
3.68%
3.71
3.0
3.13%
3.75
9.7 4.1
1.33% 1.27%
3.93 4.02
In terms of speed, the baselines are in general fastest but with higher error rates. In terms of error rates, both 2-phase and wavelet methods can achieve lower error rates than baselines. Based on speech and error rates, it is obvious that our approach is faster than the wavelet method with almost the same low error rate. We also used these pitch-marking methods for TD-PSOLA to scale the pitch an octave up and down. 10 persons were invited to assess to the synthesized speech quality based on MOS values of 1 to 5. From the last column of the table, it is obvious that MOS is inversely related to the error rates. Again, the proposed method can achieve a slightly better MOS with much less computation than the wavelet method.
5 Conclusions In this paper, we have presented a two-phase pitch marking algorithm. Its efficiency and effectiveness has been validated by several experiments. We also tested the proposed method by incorporating its use in TD-PSOLA and the resulted subject tests based on MOS values demonstrate how it can outperform other methods considering the tradeoffs between computing time and precision.
6 References [1]
[2]
[3] [4] [5]
A. K. Krishnamurthy and D. G. Childers, ”Two-Channel Speech Analysis,” IEEE Trans. on Acoustic, Speech and Signal Processing, Vol. 34, No. 4,730-743, August 1986 F. Charpentier and Moulines, “Pitch-synchronous Waveform Processing Technique for Text-to-Speech Synthesis Using Diphones,” European Conf. On Speech Communication and Technology, pp.13-19, Paris, 1989. ITU-T, Methods for Subjective Determination of Transmission Quality, 1996, Telecommunication Unit. J. A. Nelder and R.Mead. “A simplex method for function minimization.” Computer Journal, 7:308-313, 1964 Kobayashi, M., M. Sakamoto, T. Saito, Y. Hashimoto, M. Nishimura, and K. Suzuki, “Wavelet analysis used in text-to-speech synthesis,” IEEE Transactions on Circuits and Systems-II, Analog and Digital Signal Processing, 45(8), 1998, pp. 1125-1129.
[6]
Lawernce Rabiner Biing-Hwang Juang, “Fundamentals of speech recognition”, Prentice Hall published, page 339-340.
[7]
M. Sakamoto, T. Saito, "An Automatic Pitch-Marking Method using Wavelet Transform," Proc. of ICSLP2000, vol. 3, pp. 650-653, Beijing., Oct. 2000.
[8]
Moulines, E.; Emerard, F.; Larreur, “A real-time French text-to-speech system generating high-quality synthetic speech,” ICASSP-90, International Conference on 36 April 1990, Pages: 309 - 312 vol.1
[9]
Proakis, J. R. J. G. and Hansen, J. H. L. "Discrete-time processing of speech signals," New York, Macmillan Pub. Co., 1993.
[10] T. V. Ananthapadmanabha, B. Yegnanarayana, ”Epoch extraction of voiced speech,” IEEE Trans. Acoustic, Speech and Signal Processing, Vol. 23, No. 11, 562-570, Dec., 1975. [11] Y. M. Cheng, D. O’Shaughnessy, ”Automatic and reliable estimation of glottal closure instant and period,” IEEE Trans. Acoustic, Speech and Signal Processing, Vol. 37, No. 11, 1805-1815, Dec., 1989.
Biography Cheng-Yuan Lin was born in Taiwan in 1977. He received the B.S. degree in computer science from National Tsing Hua University in 1999, and the M.S degree in the same affiliation in 2001. Since 2003, he has been a PhD candidate in the same department. His research interests include speech/singing/music synthesis, speaker/speech/music recognition and audio signal processing. E-mail: gavins@cs,nthu.edu.tw
J.-S. Roger Jang was born in Taiwan in 1962. He received the B.S. degree in electrical engineering from National Taiwan University in 1984, and the Ph.D. degree in EECS Department at the University of California at Berkeley, in 1992. He worked for the MathWorks, Inc. during 1993-1995, and coauthored the Fuzzy Logic Toolbox. Since 1995, he has been with the Department of Computer Science, National Tsing Hua University, Taiwan. He has published two books: "Neuro-Fuzzy and Soft Computing" (1997, Prentice Hall) and "MATLAB Programming and Applications" (2000, CWeb Publisher, in Chinese). Dr. Jang's research interests include melody/music recognition, biometric identification, pattern recognition, neural networks and fuzzy logic. E-mail: jang@cs,nthu.edu.tw