1999; Mansoor et al., 2004; Doyle and Rogers, 2005; and Sonmez and .... Chung and Rogers. 144 ..... 1:62,500; while St. Charles and Jefferson Counties were.
GIS-Based Virtual Geotechnical Database for the St. Louis Metro Area JAE-WON CHUNG J. DAVID ROGERS Department of Geological Sciences and Engineering, 1400 North Bishop Avenue, Missouri University of Science and Technology, Rolla, MO 65409
Key Terms: Virtual Geotechnical Database, Compilation, Geologic Maps, Geostatistics ABSTRACT The St. Louis metropolitan area is the focus of the U.S. Geological Survey’s Earthquake Hazard Program’s plan for assessing the likely risks of an earthquake emanating from the New Madrid Seismic Zone or the Wabash Valley Seismic Zone, which are the most active seismic zones recognized in the Midwestern United States. The St. Louis metro area includes portions of eight counties located both in Missouri and Illinois that abut the state boundary formed by the Mississippi River. The Illinois and Missouri geological surveys have prepared geologic maps and data sets that employ dissimilar geodata information, differing map units, map scales, and storage formats, with geodata stored in analog or digital formats. This research sought to combine the dissimilar geodata sets and to integrate them into a single Virtual Geotechnical Database within an accepted geographic information system (ArcGIS), which could be manipulated to retrieve subsurface data and to perform an array of spatial analyses. The geodatabase is intended to promote standardization of geologic interpretations between Missouri and Illinois and will be available to other researchers. The existing body of data was manipulated to extract useful information on the surficial geology, loess thickness, bedrock geology, well locations, and measured values of shear wave velocity, which could be conjoined to create stand-alone GIS information layers. ‘‘Depth-to-bedrock’’ refers to the lithologic contact with early Paleozoic-age strata recognized by formational assignments across the two states. Depth-to-bedrock and groundwater table elevations underling the study area were interpolated using geostatistical methods of ordinary kriging and cokriging, respectively. INTRODUCTION A geographic information system (GIS) provides scientists, engineers, and planners with a platform to
manipulate georeferenced data for local geotechnical, geologic, and hydrologic conditions related to mineral resource distribution, natural hazard assessments, and the prediction of subsurface conditions (Couture and Guzzetti, 2004). As a result, GIS-based geodata have become widely applied in earthquake hazard assessment (Luna and Frost, 1998; Hitchcock et al., 1999; Mansoor et al., 2004; Doyle and Rogers, 2005; and Sonmez and Gokceoglu, 2005), fire-rainfall– induced landslide hazard mapping (Carrara et al., 1995; Dai and Lee, 2002; Donati and Turrini, 2002; and Cannon et al., 2004), mineral resource estimation (Zhou et al., 2007), volcanic hazard assessment (Gaspar et al., 2004; Gogu et al., 2006), and borehole data management (Chang and Park, 2004; McCarthy and Graniero, 2006). In 2004, the St. Louis metropolitan area was identified by the U.S. Geological Survey (USGS) Earthquake Hazard Program (EHP) as one of the urban areas (i.e., Memphis, St. Louis, and Evansville) slated for detailed study in the Central and Eastern United States over the following decade. The USGSEHP project for urban seismic hazard mapping represents the initial program of external research funded by the USGS National Earthquake Hazard Reduction Program (NEHRP). Its intended purpose was to (1) develop an internet-accessible database for use by scientists, engineers, insurance industry, government agencies, and the public at large; (2) produce hazard assessment maps for seismically induced ground movement hazards, such as lateral spread and liquefaction; and (3) systematically describe the risks of hazards posed by earthquakes likely to emanate from the New Madrid Seismic Zone (NMSZ) in the Upper Mississippi Embayment and the Wabash Valley Seismic Zone (WVSZ), which are the most active seismic zones recognized in the Midwestern United States (upper left corner of Figure 1). The St. Louis metro area comprises parts of four counties in Missouri and four counties in Illinois, which are separated by the Mississippi River. Over the past century the Missouri and Illinois geological surveys have carried out independent investigations in
Environmental & Engineering Geoscience, Vol. XVI, No. 2, May 2010, pp. 143–162
143
Chung and Rogers
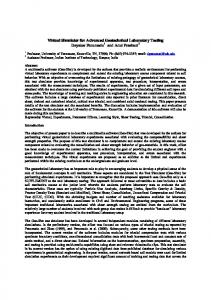
Figure 1. The St. Louis metropolitan area, Missouri and Illinois, was arbitrarily described by the 29 U.S. Geological Survey (USGS) quadrangles shown here, which are georeferenced to Universal Transverse Mercator (UTM) Zones 15 and 16. The southern St. Louis metro area is approximately 200 to 300 km north of the New Madrid Seismic Zone (NMSZ) and 210 to 260 km east–southeast of the Wabash Valley Seismic Zone (WVSZ).
the St. Louis area, without coordination of effort. The state surveys also collected geological information from various sources in their respective states. Though unintended, both state surveys produced different mapping criteria (depositional environment versus map units), disparate mapping scales, and dissimilar data storage systems. Existing geologic, hydrologic, or geotechnical records in the St. Louis area have not been merged into a single geodatabase or protocol, even though the USGS attempted to compile consistent geologic maps across the state boundary during the 1990s using the St. Louis 309 3 609 quadrangle at 1:100,000 scale (Schultz, 1993; Harrison, 1997). The St. Louis 309 3 609 quadrangle covers a substantial portion of the St. Louis metro study area, which is described by 29 USGS 7.5-minute quadrangles (described later). An acute need exists to conjoin dissimilar geodata information from Missouri and Illinois, because the state geological surveys were precluded from preparing products that extend into one another’s jurisdiction. The Technical Working Group of the USGS’s St. Louis Area Earthquake Hazard Mapping Program felt that the project needed a geodatabase compiled in a GIS format that would either consider, or contain, the relevant topographic, hydrologic, geologic,
144
and geophysical data, which will eventually be accessible to everyone associated with the USGS-EHP multiyear program. In the balance of this article we describe this GISbased virtual geotechnical database (VGDB; Swift et al., 2004) for the St. Louis metro area; it is intended to encourage scientists and engineers to standardize geologic interpretations, avoid duplicative efforts and costs in years to come, and prepare a series of products for assessing seismic site response and making preliminary evaluations of liquefaction potential in this area. The stated objectives were to (1) collect existing geodata from the geological surveys, public agencies, and private sector sources, (2) input these into Environmental Systems Research Institute’s ArcGIS v.9.1, and (3) interpolate the depth-to-bedrock prediction in the Paleozoic age basement formations, as well as predictions of prevailing groundwater elevations between measured data points. The GIS information layers produced from the VGDB included the following:
N N N
surficial geology (unconsolidated materials), loess thickness, bedrock basement geology (underlying unconsolidated materials),
Environmental & Engineering Geoscience, Vol. XVI, No. 2, May 2010, pp. 143–162
St. Louis Geotechnical Database
N N N N
well collar locations, shear wave velocity (VS) measurement locations and values, permanent groundwater table elevations, and underlying bedrock basement interface elevations.
BACKGROUND St. Louis Metropolitan Area The study area encompasses 29 USGS 7.5-minute quadrangles in the greater St. Louis metropolitan area of Missouri and Illinois, encompassing a land area of 4,432 km2 (Figure 1). The topographic elevations in the study area vary between 116 m and 288 m above mean sea level (1989 National Geodetic Vertical Datum, NGVD). The St. Louis area includes the confluences of the Missouri, Illinois, and Meramec Rivers with the Mississippi River, and it encompasses low-lying alluvial floodplains developed along these rivers, which are generally bounded by locally dissected loess-covered uplands. The topography of the bedrock surface appears to have been carved by glacial and fluvial processes during the preIllinois, Illinois, and Wisconsin glacial episodes (Goodfield, 1965; Allen and Ward, 1977; Grimley et al., 2001; and Grimley and Phillips, 2006). The most likely source of high-amplitude ground motions is earthquakes emanating from the seismically active NMSZ, located 200 to 380 km south of St. Louis, and to a lesser extent from the WVSZ, located 210 to 260 km east–southeast of St. Louis. The NMSZ produces about 300 recorded earthquakes each year (since records began in 1974), and it is credited with producing four moment magnitude 7.1 to 7.7 earthquakes between December 1811 and February 1812 (Hough et al., 2000; Atkinson and Beresnev, 2002; and Bakun and Hopper, 2004). Much less is known about the WVSZ, which has been recognized for only the past decade (McNulty and Obermeier, 1999; Street et al., 2004; and Obermeier et al., 2005). The WVSZ produces about 100 recorded earthquakes per year and is believed to spawn one magnitude 7 earthquake about once every millennium. Paleoliquefaction features have been documented along the riverbanks in the St. Louis (Tuttle et al., 1999; Tuttle, 2005), and some of those have been interpreted and/ or dated by 14C methods as having formed around the time of the 1811–12 quakes. Current Geodata within St. Louis The Missouri Division of Geology and Land Survey (MoDGLS, 2006, 2007) has prepared a CD-ROM
titled Missouri Environmental Geology Atlas (MEGA) of GIS data layers for the entire state. These GIS data layers include bedrock geology, surficial geology (soils), alluvial deposits, well collar locations, known sinkholes, designated wetlands, and contour lines of Paleozoic age bedrock basement rocks and static groundwater levels. Palmer et al. (2005, 2006) at the MoDGLS has also collected and edited geotechnical borings from the Missouri Department of Transportation, and other agencies who have drilled in the St. Louis area. As part of the USGS-EHP project, MoDGLS recently completed a map showing the surficial geology of the Wentzville Quadrangle (Palmer et al., 2009). Nevertheless, most of the 7.5 minute quadrangles on the Missouri side of the St. Louis area remain unmapped or unpublished, while those that have been mapped remain in analog formats. The Illinois State Geological Survey (ISGS) has compiled the logs of approximately 17,000 borings in the four counties adjoining St. Louis (Jersey, Madison, St. Clair, and Monroe Counties). These boring logs have been collected through regulatory programs of the state and have been maintained in a digital database (Oracle) available to the public for a retrieval and copy fee. During the past decade the ISGS has undertaken a project to compile reliable surficial and bedrock geologic maps at a scale of 1:24,000. These maps have employed the latest geologic information using ArcGIS. These STATEMAP 1:24,000 scale quadrangles funded by the USGS cover the St. Louis metro area east of the Mississippi River. The surficial geology map series for four Illinois counties are also available in GIS formats from ISGS. Additionally, the elevations of the Paleozoic bedrock basement and the thickness of glacial drift state-wide have been digitized in GIS formats. OVERVIEW OF VGDB DEVELOPMENT The GIS-based VGDB is composed of several thematic data sets defined according to the type of information. The existing data used in this study comprise (1) geologic maps from the USGS, the MoDGLS, and the ISGS; (2) geotechnical boreholes and water well logs from the MoDGLS, the ISGS, and private companies (e.g., URS Corporation, Reitz & Jens, Inc., Geotechnology, etc.); (3) VS data measured by the USGS, the ISGS, and Missouri S & T (4) digital raster graphics (DRGs) of 29 USGS quadrangles, each covering 7.59 latitude and longitude; and (5) 10 3 10–m and 30 3 30–m grid digital elevation models (DEMs) of these 7.59 quadrangles, provided by the USGS. The DRGs were georeferenced for use in determining the map coordinates of the objects at a scale of 1:24,000, and then the
Environmental & Engineering Geoscience, Vol. XVI, No. 2, May 2010, pp. 143–162
145
Chung and Rogers Table 1. Input data sets for the geodata layers developed in this study. Layers
Input Data in Attribute Table
Surficial geology Loess thickness Bedrock geology Borehole information VS values and locations Groundwater table Depth to bedrock Additional USGS sources Ground elevations Topographic map
Feature Type
Geologic symbols, unit, and description Major contour lines (ft) Geologic symbols, unit, description, and geologic structures Boring location and records VS values and locations Measured/estimated depth (m) Measured/estimated depth (m)
Vector Vector Vector Vector Vector Vector Vector
(polygons) (polylines) (polygons, polylines) (points) (points) (points)/raster (cell) (points)/raster (cell)
DEM (10-m or 30-m resolution) 7.5-Minute quadrangle
Raster (cell) Raster (cell)
VS 5 shear wave velocity; USGS 5 U.S. Geological Survey; DEM 5 digital elevation model.
29 DRG quadrangles were electronically stitched together to create a seamless file. The stitched DEMs are used to obtain the topography of ground surface and to estimate the positions of the groundwater table as well as bedrock surface from ground surface or sea level. These geodata layers were constructed using ArcGIS v.9.1. The map and borehole data used to compile the geodata layers were collected as vector shapefiles directly or from the analog hard copies. Hard copy maps were scanned, rectified into a raster format, and manually digitized into a vector format. Data descriptions and values for individual spatial objects in the vector layers were input into attribute tables. The input data sets for presenting each layer in this study are summarized in Table 1. Detailed data sources for each GIS layer and descriptions of dissimilar map units employed by geological surveys are compiled in Chung (2007). Whenever possible, this study used the Universal Transverse Mercator (UTM) grid coordinates, which are expressed as distances in meters to the east and north. Figure 1 shows UTM grid Zones 15 and 16, referencing the 29 USGS 7.59 quadrangles within the St. Louis area. COMPILATION OF GEODATA Surficial Geologic Map The surficial geologic map is generally intended to characterize the unconsolidated sediments capping the Paleozoic-age bedrock basement. These materials are collectively referred to as the soil cap by most engineering seismologists, and these unconsolidated materials can exert a profound influence on seismic site response as a result of impedance contrasts at the interface between the bedrock and the unconsolidated cover (Borcherdt and Gibbs, 1976; Kramer, 1996; and Street et al., 1997). Information on surficial materials
146
is useful for (1) understanding the recent depositional environment, (2) estimating engineering characteristics of those unconsolidated materials exposed at the ground surface, upon which most structures are founded, and (3) determining those areas capable of magnifying incoming seismic energy, which can damage man-made infrastructure and/or trigger widespread ground failure, through liquefaction and lateral spreading. Compilation Surficial geologic data were collected from 17 different sources (Figure 2), including publications of the MoDGLS, ISGS, and USGS. Schultz (1993) compiled unpublished data from various sources (Goodfield, 1965; Allen and Ward, 1977; and Lineback, 1979), summarized in a USGS Open File Map at a scale of 1:100,000. The Missouri portion of Schultz’s map was manually digitized by the authors, and the descriptions of geologic units were tabulated in GIS attribute tables. The Illinois portion of the study area was mapped at scales of 1:24,000 to 1:100,000 by the ISGS, and the corresponding GIS shapefiles were provided by Grimley (2007). The surficial geology of Jefferson County, MO, has not been mapped at a useful scale (,1:100,000), so it was not entered into the VGDB. The GIS shapefiles from Missouri and Illinois were combined into a seamless information layer (Figure 2). Correlations were derived between the respective surficial geologic units and subsurface rocks recognized in this study. The descriptions used by Schultz (1993) for Missouri and those employed by the ISGS for Illinois are compared in Table 2. Disparity of Mapped Units and Scales A vexing aspect of constructing a seamless surficial geologic map of the St. Louis area was the disparity between mapped units and scales in Missouri and
Environmental & Engineering Geoscience, Vol. XVI, No. 2, May 2010, pp. 143–162
St. Louis Geotechnical Database
Figure 2. Compiled surficial geologic map and data sources of the St. Louis metropolitan area in a geographic information system (GIS) vector format. Note unmapped area in Jefferson County, MO.
Environmental & Engineering Geoscience, Vol. XVI, No. 2, May 2010, pp. 143–162
147
Chung and Rogers Table 2. Correlation of recognized surficial geologic units and their respective map symbols. This Study Time Scale
Interpretation
Holocene (post-glacial)
Holocene over Pleistocene
Pleistocene (Wisconsinan)
Man-made fill or cut Residuum Alluvium Alluvial or colluvial fans Alluvium (backswamp, channel-fill, or overbank) Alluvium (point bar or channel) Colluvium Alluvium over lake deposits Alluvium (clayey) or lake deposits Lake sediment (slackwater)
Symbol af(dg) R Qa or c c(f) c(c)
Missouri (Schultz, 1993) Symbol
Unit
af R Qa
Artificial fill Residuum Alluvium
c(s) Qp(py) c/e
Qp —
Peyton —
c(c)-e Qtd
Outwash Loess
h Ql(pr)
— Ql
Terrace deposits — Loess
Loess over ice-contact drift
Ql(pr/pl-h)
—
—
Ql(pr/pl) Ql(pr/pb)
Pleistocene (Illinoian)
Loess over outwash Loess over till over lake sediment Lake sediment
Qtd or tr
Qtd
Qt or g
Qt
Pre-Illinoian (Kansan)
Till and ice marginal sediment Till
Terrace deposits Till
Qt K B
K B
Karst Bedrock
Paleozoic
Bedrock
Illinois. The State of Missouri has traditionally employed depositional environment mapping at scales greater than 1:62,500 to compile their geologic maps, although the MoDGLS recently completed a map of the Wentzville quadrangle at scale of 1:24,000 (Palmer et al., 2009). The MoDGLS recently resumed detailed mapping of surficial deposits on their side of the metro area. Completion of these new maps over the next few years should reduce the level of uncertainty in the stratigraphy of the surficial materials on the Missouri side resulting from numerous data gaps. The State of Illinois has utilized formational mapping of recognized map units by correlating stratigraphy, as well as by interpreting depositional environments. The ISGS recently completed their mapping of all the 1:24,000 scale quadrangles in the eastern St. Louis area, funded by the USGS STATEMAP program. The Mississippi River Valley contains numerous oxbows, abandoned channels, point bars, and backswamps, many of which have been filled with silt and sandy clay fill to enable reclamation and development. The ISGS has named the recent alluvium the Cahokia Formation and has subdivided the formation into three facies (sandy,
148
Symbol
Unit
dg — c c(f) c(c)
Disturbed ground — Cahokia Fm Cahokia-Fan Cahokia-Clayey
c(s)
Cahokia-Sandy
py c/e
Peyton Fm Cahokia Fm over Equality Fm Cahokia-Clayey or Equality Fm Equality Fm
c(c)–e
Qtd or e
Pleistocene (Wisconsinan over Illinoian)
Illinois (ISGS publications)
e h pr
tr
Henry Fm Peoria and Roxana silts (pr) (pr) over Pearl Fm- Hagarstown M (pr) over Pearl Fm (pr) Over Glasford Fm-Petersburg silt Teneriffe silt
g
Glasford Fm
pr/pl-h pr/pl pr/pb
— — R
— — Bedrock
clayey, and fan). In some of the elevated uplands east of the Mississippi floodplain, the ISGS was able to distinguish between the Peoria and Roxana Silts (loess) and, occasionally, was able to identify some of the underlying units (e.g., loess over Pearl Formation, loess over Glasford Formation, etc.). Loess Thickness Map It has been recognized that loess thickness affects soil development and productivity as well as soil management for engineering and other uses (Fehrenbacher et al., 1986; Rahn, 1996). Soil studies note that late Wisconsinan loess forms the major parent material of Midwestern soils (Fehrenbacher et al., 1986). Some of the more common engineering problems associated with loess in the St. Louis area have included (1) slope failures along river bluffs and at steep railroad and highway cuts after the material becomes saturated, (2) foundation failures where the loess becomes saturated, usually because of poor drainage, and (3) subsurface erosion and piping of fine-grained particles, which have little apparent cohesion (Su, 2001).
Environmental & Engineering Geoscience, Vol. XVI, No. 2, May 2010, pp. 143–162
St. Louis Geotechnical Database
Figure 3. Isopach map showing the combined thickness of loess deposits of varying ages in the St. Louis metropolitan area and the spatial distribution of data sources. Loess deposits are locally absent in the floodplains, thickest along the river bluffs bordering the Missouri and Mississippi Rivers, and then thin rapidly with increasing distance from the main river valleys.
Loess Thickness The Peoria silt and the underlying Roxana silt form the two major loess deposits in the study area, both of which are interpreted as windblown deposits of Wisconsinan age (Goodfield, 1965; Fehrenbacher et al., 1986). The loess is thickest along the bluffs bordering the modern Missouri and Mississippi Valleys. The loess thins rapidly away from these bluffs because the loess grains in this area were probably provided by three distinct depositional sources, whereas in the St. Charles and northern St. Louis areas, along the lower Missouri River valley, the loess grains are attributed to a single source (Goodfield, 1965; Allen and Ward, 1977; Fehrenbacher et al., 1986; and Grimley et al., 2001). The loess at greater distances from the major river valleys is typically finer grained. An exponential model is commonly considered to provide the best explanation for the observed decrease in loess thickness away from the major river valleys (Fehrenbacher et al., 1986).
Counties, Missouri; and the work of the ISGS for the four counties in Illinois (Figure 3). The Missouri portions mapped by Goodfield (1965) and Thorp and Smith (1952) were manually digitized, and the values of loess thickness (in feet) were input into an attribute table in ArcGIS. The Illinois portion was mapped by the ISGS, and the corresponding GIS shapefile was provided by Grimley (2007). The compiled map illustrating the total reported thickness of loess (combination of Peoria, Roxana, and lower Loveland units in feet, map unit Ql of Figure 2) is presented in Figure 3. The Illinois portion was mapped at scales between 1:24,000 and 1:100,000; the City and County of St. Louis were mapped at a scale of approximately 1:62,500; while St. Charles and Jefferson Counties were mapped at the considerably smaller scale of 1:2,500,000. With such severe contrasts in scale, a much greater level of uncertainty exists for the predictions of loess thickness in St. Charles and Jefferson Counties as compared with the rest of the study area. Bedrock Geology
Map Compilation The isopach maps of loess thickness in the St. Louis area were digitally compiled into a GIS format. The sources of these data included Goodfield’s dissertation (1965) covering St. Louis County; the work of Thorp and Smith (1952) for St. Charles and Jefferson
Bedrock geologic maps provide information for geotechnical earthquake engineers and seismologists on (1) the host basement rock and geologic structure and (2) general information about the relative stability of foundation conditions and excavations (Satterfield, 1977; Devera and Denny, 2003; and
Environmental & Engineering Geoscience, Vol. XVI, No. 2, May 2010, pp. 143–162
149
Chung and Rogers
Devera, 2004). Surface exposures of the underlying Paleozoic-age basement rocks (herein referred to as bedrock) are limited in the St. Louis area as a result of the thick cover of Quaternary loess, glacial till, residuum, and/or alluvial deposits. Most of the bedrock outcrops are in river cut bluffs, highway and railroad cuts, and quarries. The oldest exposed rock in the study area is an Ordovician-age formation in Jefferson County. The youngest mapped units are rocks of Pennsylvanian age. The Quaternary and Tertiary deposits (map units Qal, Qt, and Tg) would not normally be included, but they are not well defined in Missouri, as shown in Figure 4. The Paleozoic bedrock units underlying the Mississippi River floodplains are defined on the Illinois side, but not on the Missouri side. The geologic structures were plotted on the basis of published maps (Harrison, 1997; Devera, 2000; and Denny, 2003) and digital format in the MEGA (MoDGLS, 2006, 2007). These geologic structures include asymmetric folds and related faults, such as the St. Louis Fault Zone roughly parallel to the Mississippi River. Harrison (1997) interpreted the St. Louis Fault Zone as a right-handed strike-slip fault and suggested that minor earthquakes since 1974 are likely related to this feature. Compilation Bedrock geologic maps (Figure 4) were compiled from the publications of the MoDGLS, ISGS, and the USGS. The maps of the House, Maxville, and Oakville quadrangles (1:24,000 scale) in Missouri were manually digitized, and the descriptions of geologic units were compiled in attribute tables. The bedrock geology of the St. Louis 309 3 609 quadrangle (1:100,000 scale) was integrated by the USGS (Harrison, 1997), while the corresponding GIS shapefiles were kindly provided by Harrison. This map formed the basis of the Missouri portion. The state-wide map (1:500,000 scale) of Illinois was prepared by Kolata (2005), and the Illinois portion of the study area was provided by the ISGS as a series of GIS shapefiles. The five digitized maps included three 7.59 quadrangles in Missouri, Harrison’s (1997) map, and Kolata’s (2005) Illinois state map. These maps were combined and integrated to produce the first seamless map of the bedrock geology of the St. Louis metro area in a single GIS shapefile (Figure 4). The map symbols and unit correlations for the bedrock geologic map are presented in Table 3. Disparity of Map Scales A challenging problem in stitching the bedrock geologic maps was the disparity of scale between
150
three 1:24,000 scale quadrangles south of St. Louis and the 1:100,000 scale St. Louis quadrangle near the St. Louis–Jefferson County boundary. The different scales created joining problems at the map boundaries. This problem was solved by editing the boundary areas of the St. Louis quadrangle on the basis of unpublished 1:24,000 scale bedrock geologic maps. These GISformatted maps were conjoined after the mismatching edges were edited (Chung, 2007). Borehole Information Borehole records of geotechnical logs, stratigraphic borings, and water wells are extremely useful reference data for geologic, hydrologic, and geotechnical applications. Palmer et al. (2005, 2006) at the MoDGLS developed a borehole geotechnical database for the Missouri side of the study area, which was funded by the USGS-NEHRP in 2001, 2002, and 2005. This database was intended to serve as a compilation of fundamental soil properties for mapping surficial materials and earthquake hazards in the St. Louis area (Geology and Land Survey Staff, 2006). The boring records were acquired from the Missouri Department of Transportation (MoDOT) and other public agencies, such as the St. Louis Metropolitan Sewer District and Bi-State-Metrolink. Most of the MoDOT geotechnical borings were drilled for highway and bridge construction. The data sources are identified by project and boring number convention to document where they were drilled and to link to the original boring logs (Palmer et al., 2006). The ISGS has collected and maintained logs for boreholes drilled in Illinois by the Illinois Department of Transportation (IDOT) and regulatory agencies of the state. The ISGS archives consist of (1) all borings and water wells permitted by the Illinois Department of Mines and Minerals and by the Illinois Department of Public Health and county health departments and (2) some engineering borings submitted by the IDOT and selected consulting firms. Each borehole has a unique identifier numbered using the American Petroleum Institute code. Compilation The borehole information databases presently maintained by the MoDGLS and the ISGS were provided by these agencies in Microsoft Access 97 and spread-sheet formats, respectively. The borehole records covered 2,394 sites in Missouri and 4,817 sites in Illinois. There are mostly multiple drill logs with different dates or different purposes per borehole. Boring locations in Missouri were annotated in UTM coordinates (Zone 15), while those in Illinois were
Environmental & Engineering Geoscience, Vol. XVI, No. 2, May 2010, pp. 143–162
St. Louis Geotechnical Database
Figure 4. Compiled bedrock geologic map and the areal distribution of the five data sources of the St. Louis metropolitan area in a seamless geographic information system (GIS) vector format.
originally referenced with the geographic coordinate system (latitude/longitude). The ISGS boring locations were converted to UTM coordinates (Zones 15 and 16) for this study. The GIS map in Figure 5
presents data objects and the number of borehole positions within the study area. The borehole data in the VGDB were used for interpolating the groundwater table and depths to bedrock.
Environmental & Engineering Geoscience, Vol. XVI, No. 2, May 2010, pp. 143–162
151
152
Quaternary
System Holocene
Kinderhookain
Osagean
Meramerician
Atokan Unconformity Chesterian
Series
Environmental & Engineering Geoscience, Vol. XVI, No. 2, May 2010, pp. 143–162 Decorah Plattin Limestone Joachim Dolomite St. Peter Sandstone
Mohawkian
Fern Glen and Bachelor Chouteau Limestone ,,,,,,,,,,,,,,,,,,,,,,,,,,, Bushberg Sandstone and Glen Park Limestone Cedar Valley Limestone Joliet Kankakee/Edgewood Limestone ,,,,,,,,,,,,,,,,,,,,,,, MaQuoketa Shale Cape Limestone/Kimmswick Limestone
,,,,,,,,,,,,,,,,,,,,,,,, Pleasanton Group Modesto Formation/McLeansboro Group Shelburn-Patoka Carbondale Marmaton Group Cherokee Group Tradewater ,,,,,,,,,,,,,,,,,,,,,,,,,, Yankeetown Sandstone Renault Limestone Aux Vases Sandstone Ste. Genevieve Limestone Lower Pope Group Unconformity St. Louis Limestone Salem Warsaw Keokuk-Burling Limestone
,,,,,,,,,,,,,,,,,,,,,,,, Grover Gravel
Alluvium Terrace Deposit
Formation
Champlainian/Mohawkian
,,,,,,,,,,,, Unconformity Devonian Upper Devonian Erian Silurian Niagaran Alexandrian ,,,,,,,,,,, Unconformity Ordovician Cincinatian/Champlainian/Mohawkian
,,,,,,,,,,, Mississippian
Pleistocene ,,,,,,,,,,,,,,,,,,,,,, Unconformity Mesozoic Tertiary Pliocene Miocene ,,,,,,,,,,,,,,,,,,,,,, Unconformity Paleozoic Pennsylvanian Missourian Desmoneisian
Cenozoic
Era
Op Oj Osp
Om Ok
Db DSu
Mfgc
Msl Ms Mw Mkb
Msg Mpl
Myra
Pp Pmo Psp Pcar Pm Pc Pt
Tg
Qal Qt
Odp
Okd
Omk
Mc
Mkbf
Mws
Pmc
Symbol
Table 3. Correlation of recognized bedrock geologic units and map symbols used in the St. Louis metropolitan area, Missouri and Illinois.
P
Chung and Rogers
St. Louis Geotechnical Database
Figure 5. Borehole locations and types in the St. Louis metropolitan area, Missouri and Illinois, in a seamless geographic information system (GIS) vector format.
Discussion A common problem associated with attempting correlations between borings of dissimilar age, intent, and source are the disparate information they often contain, such as differences in stratigraphic interpretations, contrasting unit names and descriptions, the type of boring, the intended purpose of the boring, historic shifts in stratigraphic nomenclature, the level of geologic detail, and the experience of the person logging the boring. All of these factors tend to introduce uncertainties, although logs of borings by certain agencies may contain consistent quality and may be large in number (the uncertainty would arise from attempting to correlate high-quality subsurface data with adjacent boring poor-quality logs). The borehole databases maintained by Missouri and Illinois contain many different kinds of logs. Table 4 shows a tabulation of boring type (originally named by MoDGLS and ISGS) and the respective number of borehole records used in the subject study. Accurate locations of water wells and geotechnical borings are crucial metadata for assessing hazards because the physical spacing between these data points influences the uncertainty of predicted positions, between adjacent borings or wells. For example, there is a paucity of reliable subsurface data in the undeveloped portions of eastern St. Charles County,
in the lowland floodplain bordering the confluence of the Missouri and Mississippi Rivers (shown in Figure 5). The baseline borehole distributions layer in the VGDB may enable researchers to assign increased levels of uncertainty in the data gaps and allow priorities to be established for subsurface exploration and geophysical evaluations during the balance of the multi-year EHP. Shear Wave Velocity (VS) and Site Amplification NEHRP Site Classification When estimating the potential severity of shaking at any given site during an earthquake, the simplest way of accounting for local site conditions is to consider the impedance contrast likely to be generated at the bedrock/soil cap interface at that location. This estimate is commonly made by comparing the VS of the unconsolidated surficial materials (so-called soil cap) with that of the deeper weathered or unweathered bedrock. Seismic shaking tends to increase on sites that are blanketed by low-density sediments, with corresponding lower abilities to propagate shear wave energy (Kramer, 1996). The principal physical attribute in these evaluations is the respective Vs of the adjoining geologic units (soil cap versus the underlying bedrock). Shear wave velocities are usually estimated from in situ
Environmental & Engineering Geoscience, Vol. XVI, No. 2, May 2010, pp. 143–162
153
Chung and Rogers Table 4. Borehole type and information contained on logs. State
Borehole Type
No. of Records
Item
Missouri
Bedrock Core log Grain size Material (soil survey) Physical (geotechnical) property Water wells Highway log (Geotechnical) highway engineering Highway head Log (soil survey) Water wells
2,338 729 93 2,330 1,906
Depth to bedrock, bedrock type Core recovery (percent), Rock Quality Designation (RQD) Grain size analysis of soil Description of soil material Standard Penetration Test (SPT) N-value, Cone Penetration Test (CPT), USCS class, unit weight (water content, percent), liquid limits, and plastic index Depth to groundwater Description of soil material Standard Penetration Test (SPT) N-value
Illinois
961 857 496 2,226 3,636 4,728
Description of geotechnical boring Description of soil material Description of water well
USCS 5 Unified Classification System.
measurements (Stokoe and Woods, 1972; Fumal and Tinsley, 1985; Woods, 1994; and Park et al., 1999), but can also be estimated from laboratory evaluations of recovered rock cores, such as the resonant column test (Drnevich et al., 1978; Shirley and Hampton, 1978; and Robertson et al., 1995). Softer, unconsolidated soils, such as those recently deposited in floodplains or alluvial fans, are generally more susceptible to ground motion amplification and may be prone to ground failures, such as cyclic softening, liquefaction, and lateral spreads (Idriss and Boulanger, 2008). Previous studies have demonstrated that the mean VS in the upper 30 m (VS30 5 30 m/shear wave travel time to 30 m in seconds; Borcherdt, 1994) is inversely correlated with the average horizontal spectral amplification of earthquake ground motion (Borcherdt and Gibbs, 1976; Borcherdt et al., 1991). To assess the susceptibility to ground amplification, in 1994 the NEHRP defined six types of soil caps, or soil profiles (SA, SB, SC, SD, SE, and SF), based on their respective VS values (Borcherdt, 1994). The descriptions of seismic site classes defined in terms of VS30 in accordance with
NEHRP provisions are shown in Table 5 (BSSC, 2003). Compilation A total of 117 VS profiles within the St. Louis area were measured and provided to our study group by another team at Missouri S&T (Hoffman, 2007), the USGS (Williams, 2007; Williams et al., 2007), and the ISGS (Bauer, 2007). The locations of these VS tests and codings for their respective sources were plotted using GIS. Each value of VS30 and the data sources are shown in Figure 6. The compiled VGDB of VS values are expected to aid researchers in assessing potential seismic site response, in preparing seismic hazards maps, in applying the seismic design tenants of the 2003 International Building Code (adopted by St. Louis and St. Charles Counties in 2006), and in influencing planning products for the St. Louis area. INTERPOLATION OF GEODATA Estimation of Bedrock Surface
Table 5. NEHRP site classification (BSSC, 2003). Soil Site Class SA SB SC SD SE SF
Average VS (m/s) in the Upper 30 m
General Description
VS . 1,500 Hard rock 760 , VS # 1,500 Rock with moderate fracturing and weathering 360 , VS # 760 Very dense soil, soft rock, highly fractured and weathered rock 180 , VS # 360 Stiff soil VS # 180 Soft clay soil — Soils requiring site-specific evaluations
NEHRP 5 National Earthquake Hazard Reduction Program; VS 5 shear wave velocity.
154
The position of the bedrock–soil cap interface is of great import to assessments of seismic site response (Borcherdt et al., 1991; Kramer, 1996). Sites underlain by thick accumulations (.14 m) of unconsolidated sediments appear to be more prone to magnification of ground motion than are those on shallow bedrock in the St. Louis area (Rogers et al., 2007). Data Besides the geotechnical borings mentioned above, additional information on depth to bedrock came from the following sources: (1) 1,540 sites in Missouri from the MEGA (MoDGLS, 2007); (2) 311 geotech-
Environmental & Engineering Geoscience, Vol. XVI, No. 2, May 2010, pp. 143–162
St. Louis Geotechnical Database
Figure 6. Locations and sources for values of average shear wave velocity (VS30) in the upper 30 m across the St. Louis metropolitan area.
nical borings in the Columbia Bottom quadrangle, measured and provided by URS Corporation; (3) 58 boring logs along two highway and bridge alignments (State Route 364/Page Ave. Extension) explored by Sverdrup Civil, Inc.; and (4) 17 seismic reflection profiles performed by the USGS (Williams et al., 2007). Of the geotechnical borings, boreholes that did not pierce the bedrock interface were also analyzed to prevent the initial approximation from underestimating bedrock depth in valley areas. Interpolation The depth-to-bedrock predictions between sampled sites were interpolated, and corresponding uncertainties were computed using ordinary kriging with the spherical model provided by ArcGIS Geostatistical Analyst. Kriging, a geostatistical technique, has the ability to honor a true value at a sampled site and to provide estimates from data points in close proximity and its uncertainties, at unmeasured sites; thus, the kriging technique shows reasonably accurate results in areas where abundant data are clustered, but these results are much less accurate in those areas where sparse data exist (Journel and Huijbregts, 1978; Dunlap and Spinazola, 1984; and Isaaks and Srivastava, 1989). This procedure estimates unsampled values by calculating the weights assigned to the individual neighboring points. These weights depend
in the spatial relationship between values and distances between the sampled and unsampled data points. These spatial relationships are quantified by constructing a semivariogram, which is fundamental to geostatistical analyses (Isaaks and Srivastava, 1989; Johnston et al., 2001; and Kelkar and Perez, 2002). Semivariograms are built on the assumption that closer data pairs exhibit similar values but that those separated by greater distance can be expected to exhibit increasingly dissimilar values. In semivariogram graphs, the lag on the X-axis is the distance between data points, and the semivariance on the Y-axis represents its dissimilarity. In a theoretical curve, the Y intercept is known as the nugget; a non-zero nugget implies that points infinitesimally close to one another have different values. The lag value and its semivariance value, at which the curve flattens out, are called the range and sill, respectively. The adequacy of the fitted model is determined on the basis of prediction errors between the actual and estimated values. Using ordinary kriging, the estimated value at an unsampled location is obtained by the relationship Z� (X0 ) ~
n X i~1
li Z(Xi ),
n X
li ~ 1
ð1Þ
i~1
where Z*(X0) 5 estimated value at X0, Z(Xi) 5 sample value at Xi, and where li 5 weighting factor.
Environmental & Engineering Geoscience, Vol. XVI, No. 2, May 2010, pp. 143–162
155
Chung and Rogers
Kriging errors increase in areas lacking data, and additional data points or hand contouring may be required to produce an acceptable predictive model. The study area was divided into geomorphic regions of alluvial-filled lowland floodplains and loess or till-covered uplands, east and west of the Mississippi River, because data collected in these areas permits the kriging calculation to converge much better than does kriging calculated on the basis of data taken over the entire study area. The depthto-bedrock prediction in these geomorphic subregions was generated using 5,121 subsurface data points that pierced the bedrock basement, and the prediction was then adjusted with another 3,165 borings that did not encounter the bedrock interface. We compared several of the best-fit theoretical models with the collected well data and determined that spherical models and lag sizes to semivariograms for uplands and lowland floodplains (Figure 7) resulted in a kriged root-mean-square standardized error closer to 1.0 and mean prediction errors closer to zero than in any of the other models. On the basis of the fitted semivariogram model, the kriged predictions of bedrock depth with its standard error were produced (shown in Figure 8); the bedrock escarpments formed by river bluffs were added to the final map in order to provide a more realistic portrayal of the predicted bedrock–soil cap interface. Position of Groundwater Table Accurate predictions of the groundwater table elevations are important for evaluating water resources, stability of excavations, and evaluation of waste disposal sites and in predicting seismic hazards, such as lateral spreading or liquefaction, which are commonly associated with shallow groundwater tables.
channels and 3,126 data points along perennial streams in uplands, and its collar elevations (of the wells) were estimated from 10-m DEM. Interpolation Cokriging, the multivariate extension of kriging, was considered to be suitable for contouring groundwater tables because of the ability of cokriging to improve the estimates at unmeasured locations, using the ground elevations as covariables (Hoeksema et al., 1989). This is because groundwater elevations are markedly influenced by the overlying topography (Dunne and Leopold, 1978; Todd, 1980). The various applications of cokriging have been described by Journel and Huijbregts (1978), Myers (1982), Isaaks and Srivastava (1989), Johnston et al. (2001), and Kelkar and Perez (2002). The cokriging equation to estimate a datum at new location has been expressed as: Z� (X0 ) ~
n X
lZ i Z(XZi ) z
i~1
m X
The measured and inferred values of groundwater elevation within the St. Louis area were collected to estimate elevation of the permanent groundwater surface. The input data consisted of (1) 1,069 well logs recorded between January 1959 to December 2005 and (2) 3,595 inferred points of watercourses (perennial channels), where the elevation of groundwater table is assumed to be coeval with the exposed water surface. Actual data records were collected from water wells, environmental monitoring wells, or geotechnical borings compiled by the MoDGLS and the ISGS. Data points of perennial watercourses consist of 469 elevations along the major river
lW k W (XW k ),
k~1 n X
lZ i ~ 1 and
i~1
Data Set
156
Figure 7. Fitted spherical semivariogram used by ordinary kriging for mapping depth-to-bedrock predictions.
m X
lW k ~ 0
ð2Þ
k~1
where Z*(X0) 5 estimated value at X0, Z(XZi) 5 sample value located at XZi, W(XWk) 5 covariable value located at XWk, lzi 5 weighting factor at XZi, and lWk 5 weighting factor at XWk. Based on the well observations in the dissected uplands around St. Louis, the groundwater table tends to mimic the topography; cokriging allowed predictions using groundwater elevation as the primary variable and topography as a covariable. For the cokriging covariable, 17,473 ground elevations (on 500-m grids) were extracted from 30-m DEMs using MICRODEM software. Figure 9 shows the best-fitted semivariogram, which is the spherical
Environmental & Engineering Geoscience, Vol. XVI, No. 2, May 2010, pp. 143–162
St. Louis Geotechnical Database
Figure 8. Depth-to-bedrock map predicted by ordinary kriging (upper) and corresponding standard error map (lower), showing effect of variations in sample spatial distributions.
Environmental & Engineering Geoscience, Vol. XVI, No. 2, May 2010, pp. 143–162
157
Chung and Rogers
model. Figure 10 presents the locations of well logs and inferred watercourse points and the cokriging map of predicted groundwater elevations and the corresponding distribution of estimated error. CONCLUSIONS This article provides an overview of how seven data layers were developed into a GIS VGDB for the St. Louis metropolitan area in Missouri and Illinois. This compilation combined significant quantities of dissimilar geologic, hydrologic, geophysical, and topographic data from an array of public agencies and private sector sources that were stored in dissimilar analog and electronic formats. The data sources included 17 publications addressing surficial geologic mapping, which were adjusted, manipulated, georeferenced, and compiled into a single composite map in a GIS format. In order to correlate and conjoin so much dissimilar data, various schemes were employed, often using innovative techniques, as well as techniques suggested by other scientists working on similar problems in other parts of the United States (Gray et al., 1991; Whitfield et al., 1993; and Stoeser et al., 2005). These included developing practical techniques for joining maps of dissimilar vintage and scales and co-mingling of different stratigraphic nomenclature across the Missouri–Illinois border. Five data sources on loess thickness were compiled to produce a predictive thickness map of the Peoria and Roxana silts and the older Loveland loess, which mantle the elevated uplands ringing the study area. Loess deposits in St. Charles and Jefferson Counties in Missouri were mapped at a much smaller scale (1:2,500,000) as compared to the rest of the metro area, which was mapped at scales ranging from 1:24,000 to 1:100,000. These disparities in scale lead to increased uncertainties in the predicted thicknesses in those areas mapped at gross scales (.1:500,000). Bedrock geology maps prepared by the Missouri and Illinois state geological surveys and the USGS were analyzed and integrated into a seamless bedrock geologic map in a GIS format. Numerous problems with edge-matching between dissimilar scales of mapping had to be overcome. A number of innovative approaches were attempted before settling on a technique that overlaid USGS 1:24,000 DRGs on the 1:100,000 DLG base map, which allowed geologic contacts to be shifted slightly on the larger scale (1:24,000) map so that they would have smooth connections with those shown on the smaller scale (1:100,000) map. Borehole records at 7,211 sites were collected from the Missouri and Illinois state geological surveys for
158
Figure 9. Fitted spherical semivariogram used in cokriging prediction of groundwater elevations.
their respective portions of the study area, east and west of the Mississippi River. These data were converted to a compatible georeferenced format and input into the VGDB. The subsurface data in the VGDB were used for interpolating the late Quaternary stratigraphy, depth-to-bedrock, and predicted variations in groundwater elevations. In situ VS measurements taken from 117 locations were compiled and plotted to predict seismic site soil classes using arithmetic mean VS30 values for unconsolidated surficial sediments blanketing the study area, in accordance with the NEHRP site classes in the 2003 International Building Code (adopted by St. Louis and St. Charles Counties). Predicted elevations of the weathered and dissected Paleozoic bedrock basement and groundwater levels were interpolated using ordinary kriging and cokriging techniques, respectively. The depth-to-bedrock predictions were initially contoured with data to define the position of bedrock surface and were then refined further by including adjacent borings that did not penetrate bedrock. By including these additional borings, undulations of the weathered bedrock basement were more realistically modeled. Groundwater elevations in less sampled areas were estimated with the aid of topography data as cokriging covariables, which necessitated more intense sampling intensity (500-m grids). This approach resulted in much more realistic predictions of depth to bedrock and depth to groundwater across the study area, which reflect the paleodrainages of the dissected loess-covered uplands bordering the broad alluvial-filled valleys that characterize the St. Louis area. ACKNOWLEDGMENTS The authors would like to express their gratitude to David Shaver at the USGS Mid-Continent Geographic Science Center for his many useful suggestions; to David Grimley and Andrew Phillips at the
Environmental & Engineering Geoscience, Vol. XVI, No. 2, May 2010, pp. 143–162
St. Louis Geotechnical Database
Figure 10. Maps of predicted groundwater elevations based on cokriging (upper), with data points and the corresponding standard error (lower).
Environmental & Engineering Geoscience, Vol. XVI, No. 2, May 2010, pp. 143–162
159
Chung and Rogers
ISGS for discussing and providing the surficial geology map; to James Palmer at the MoDGLS for providing subsurface data; to Eugene Schweig of the USGS for supporting the acquisition of electronic format data from cooperating agencies; to Richard Harrison at the USGS for providing his bedrock geologic mapping, as well as that of A. P. Schultz; and to David Hoffman at Missouri S&T, Rob Williams of the USGS, and Robert Bauer of ISGS, who provided subsurface data and shear wave velocity measurements. We would also like to express our appreciation to the other members of the St. Louis Area Hazard Mapping Project–Technical Working Group for their advice, overview, and comments. This work was supported by the USGS-NEHRP under awards 05HQAG0147 and 06HQGR0155. The authors also wish to thank Jeff Keaton, Bill Haneberg, and Greg Hempen for their thoughtful comments and suggestions. REFERENCES ALLEN, W. H., JR. AND WARD, R. A., 1977, Soil. In Howe, W. B. and Fellows, L. D. (Editors), The Resources of St. Charles County, Missouri Land, Water, and Minerals: Missouri Geological Survey, Department of Natural Resources, Rolla, MO, pp. 108–145. ATKINSON, G. M. AND BERESNEV, I. A., 2002, Ground motions at Memphis and St. Louis from M 7.5–8.0 earthquakes in the New Madrid seismic zone: Bulletin Seismological Society America, Vol. 92, No. 3, pp. 1015–1024. BAKUN, W. H. AND HOPPER, M. G., 2004, Magnitudes and locations of the 1811–1812 New Madrid, Missouri, and the 1886 Charleston, South Carolina, earthquakes: Bulletin Seismological Society America, Vol. 94, No. 1, pp. 64–75. BAUER, R. A., 2007, personal communication, Illinois State Geological Survey, Champaign, IL. BORCHERDT, R.; WENTWORTH, C. M.; JANSSEN, A.; FUMAL, T.; AND GIBBS, J., 1991, Methodology for predictive GIS mapping of special study zones for strong ground shaking in the San Francisco Bay region, CA. In: Fourth International Conference on Seismic Zonation. Stanford, CA, pp. 545–552. BORCHERDT, R. D., 1994, Estimates of site-dependent response spectra for design (methodology and justification): Earthquake Spectra, Vol. 10, pp. 617–654. BORCHERDT, R. D. AND GIBBS, J. F., 1976, Effects of local geological conditions in the San Francisco Bay region on ground motions and the intensities of the 1906 earthquake: Bulletin Seismological Society America, Vol. 66, pp. 467–500. BRILL, K. J., 1986, Geologic Map of the Kirkwood 7.59 Quadrangle Jefferson and St. Louis Counties, Missouri: Missouri Department of Natural Resources, Geological Survey and Resource Assessment Division, scale 1:24,000. BRILL, K. J., 1987, Geologic Map of the Webster Groves 7.59 Quadrangle St. Louis County, Missouri: Missouri Department of Natural Resources, Geological Survey and Resource Assessment Division, scale 1:24,000. BRILL, K. J., 1988, Geologic Map of the Manchester 7.59 Quadrangle Jefferson and St. Louis Counties, Missouri: Missouri Department of Natural Resources, Geological Survey and Resource Assessment Division, scale 1:24,000. BUILDING SEISMIC SAFETY COUNCIL (BSSC), 2003, NEHRP Recommended Provisions for Seismic Regulations for New
160
Buildings and Other Structures. Part 1: Provisions (FEMA 450): Building Seismic Safety Council, Federal Emergency Management Agency, Washington, DC. CANNON, S. H.; GARTNER, J. E.; RUPERT, M. G.; AND MICHAEL, J. A., 2004, Emergency Assessment of Debris-Flow Hazards from Basins Burned by the Padua Fire of 2003, Southern California: U.S. Geological Survey Open-File Report 2004-1072, U.S. Geological Survey, 14 p. CARRARA, A.; CARDINALI, M.; GUZZETTI, F.; AND REICHENBACH, P., 1995, Multivariate regression analysis for landslide hazard zonation, geographical information systems in assessing natural hazards. In Carrara, A. and Guzzetti, F. (Editors), Geographical Information Systems in Assessing Natural Hazards: Kluwer Academic, Dordrecht, The Netherlands, pp. 135–175. CHANG, Y. S. AND PARK, H. D., 2004, Development of a web-based geographic information system for the management of borehole and geological data: Computers Geosciences, Vol. 30, No. 8, pp. 887–897. CHUNG, J.-W., 2007, Development of a Geographic Information System–Based Virtual Geotechnical Database and Assessment of Liquefaction Potential for the St. Louis Metropolitan Area: Unpublished Ph.D. Dissertation, University of Missouri, Rolla, MO, 156 p. COUTURE, R. AND GUZZETTI, F., 2004, Includes special issue—geodatabases for natural hazards and risk assessment—multidisciplinary approaches in natural hazards—preface: Natural Hazards Earth System Sciences, Vol. 4, No. 2, pp. 183–185. DAI, F. C. AND LEE, C. F., 2002, Landslide characteristics and slope instability modeling using GIS, Lantau Island, Hong Kong: Geomorphology, Vol. 42, No. 3–4, pp. 213–228. DENNY, F. B., 2003, Bedrock Geology of Granite City Quadrangle, Madison and St. Clair County, Illinois: Illinois State Geological Survey, scale 1:24,000. DEVERA, J. A., 2000, Bedrock Geologic Map of Columbia Quadrangle, Monroe and St. Clair Counties, Illinois: Illinois State Geological Survey, scale 1:24,000. DEVERA, J. A., 2004, Bedrock Geology of Bethalto Quadrangle, Madison and Macoupin Counties, Illinois: Illinois State Geological Survey, scale 1:24,000. DEVERA, J. A., unpublished, Surficial Geology of Oakville Quadrangle, Monroe County, Illinois and St. Louis County, Missouri: Illinois State Geological Survey, scale 1:24,000. DEVERA, J. A. AND DENNY, F. B., 2003, Bedrock Geology of Edwardsville Quadrangle, Madison County, Illinois: Illinois State Geological Survey, scale 1:24,000. DONATI, L. AND TURRINI, M. C., 2002, An objective method to rank the importance of the factors predisposing to landslides with the GIS methodology: Application to an area of the Apennines, (Valnerina; Perugia, Italy): Engineering Geology, Vol. 63, No. 3–4, pp. 277–289. DOYLE, B. C. AND ROGERS, J. D., 2005, Seismically induced lateral spread features in the western New Madrid seismic zone: Environmental Engineering Geoscience, Vol. 11, No. 3, pp. 251–258. DRNEVICH, V. P.; HARDIN, B. O.; AND SHIPPY, D. J., 1978, Modulus and damping of soils by the resonant-column method. In Dynamic Geotechnical Testing, American Society for Testing and Materials, Special Technical Publication STP 654: American Society for Testing and Materials, Philadelphia, PA, pp. 91–125. DUNLAP, L. E. AND SPINAZOLA, J. M., 1984, Interpolating WaterTable Altitudes in West-Central Kansas Using Kriging Techniques: U.S. Geological Survey Water-Supply Paper 2238, 19 p.
Environmental & Engineering Geoscience, Vol. XVI, No. 2, May 2010, pp. 143–162
St. Louis Geotechnical Database DUNNE, T. AND LEOPOLD, L. B., 1978, Water in Environmental Planning: W. H. Freeman, San Francisco, CA, 818 p. FEHRENBACHER, J. B.; JANSEN, I. J.; AND OLSON, K. R., 1986, Loess Thickness and its Effect on Soils in Illinois: Department of Agriculture Bulletin 782, University of Illinois, Urbana, IL, 14 p. FUMAL, T. E. AND TINSLEY, J. S., 1985, Mapping shear-wave velocities of near-surface geologic materials. In Ziony, J. I. (Editor), Evaluating Earthquake Hazards in the Los Angeles Region—An Earth-Science Perspective: U.S. Geological Survey Professional Paper 1360, pp. 127–149. GASPAR, J. L.; GOULART, C.; QUEIROZ, G.; SILVEIRA, D.; AND GOMES, A., 2004, Dynamic structure and data sets of a GIS database for geological risk analysis in the Azores volcanic islands: Natural Hazards Earth System Sciences, Vol. 4, No. 2, pp. 233–242. GEOLOGY AND LAND SURVEY STAFF, 2006, Missouri ready to rock? New Madrid fault a national priority: Missouri Resources, Vol. 23, No. 3, pp. 2–5. GOGU, R. C.; DIETRICH, V. J.; JENNY, B.; SCHWANDNER, F. M.; AND HURNI, L., 2006, A geo-spatial data management system for potentially active volcanoes—GEOWARN project: Computers Geosciences, Vol. 32, No. 1, pp. 29–41. GOODFIELD, A. G., 1965, Pleistocene and Surficial Geology of the City of St. Louis and the Adjacent St. Louis County, Missouri: Unpublished Ph.D. Thesis, University of Illinois, Urbana, Champaign, IL, 207 p. GRAY, H. H.; BLEUER, N. K.; LINEBACK, J. A.; SWADLEY, W. C.; RICHMOND, G. M.; MILLER, R. A.; GOLDTHWAIT, R. P.; WARD, R. A. (STATE COMPILATIONS); RICHMOND, G. M.; AND FULLERTON, D. S. (EDITED AND INTEGRATED), 1991, Quaternary Geologic Map of the Louisville 4u 3 6u Quadrangle, United States: U.S. Geological Survey, Miscellaneous Investigations Series Map I-1420 (NJ-16), scale 1:1,000,000. GRIMLEY, D. A., 1999, Surficial Geology of Alton Village Quadrangle (Illinois portion), Madison County, Illinois: Illinois State Geological Survey, scale 1:24,000. GRIMLEY, D. A., 2002, Surficial Geology of Elsah Quadrangle, Jersey and Madison Counties, Illinois: Illinois State Geological Survey, scale 1:24,000. GRIMLEY, D. A., 2005, Surficial Geology of Bethalto Quadrangle, Madison and Macoupin Counties, Illinois: Illinois State Geological Survey, scale 1:24,000. GRIMLEY, D. A., 2007, personal communication, Illinois State Geological Survey, Champaign, IL. GRIMLEY, D. A., 2009, Surfical Geology of Columbia Quadrangle, St. Clair and Monroe Counties, Illinois: Illinois State Geological Survey, scale 1:24,000. GRIMLEY, D. A., in review, Surfical Geology of O’Fallon Quadrangle, St. Clair County, Illinois, Unpublished: Illinois State Geological Survey, scale 1:24,000. GRIMLEY, D. A. AND LEPLEY, S. W., 2005, Surficial Geology of Wood River Quadrangle, Madison County, Illinois: Illinois State Geological Survey, scale 1:24,000. GRIMLEY, D. A. AND MCKAY, E. D., 1999, Surficial Geology of Grafton Quadrangle (Illinois Portion), Jersey and Calhoun Counties, Illinois: Illinois State Geological Survey, scale 1:24,000. GRIMLEY, D. A. AND MCKAY, E. D., 2004, Surficial Geology of French Village Quadrangle, St. Clair County, Illinois: Illinois State Geological Survey, scale 1:24,000. GRIMLEY, D. A. AND PHILLIPS, A. C., 2006, Surficial Geology of Madison County, Illinois: Illinois State Geological Survey, scale 1:100,000. GRIMLEY, D. A.; PHILLIPS, A. C.; FOLLMET, L. R.; AND WANG, H., 2001, Quaternary and environmental geology of the St. Louis Metro East area. In Malone, D. (Editor), Guidebook for Fieldtrips for the Thirty-Fifth Annual Meeting of the North-
Central Section of the Geological Society of America: Illinois State Geological Survey Guidebook 33, Champaign, IL, pp. 21–67. GRIMLEY, D. A.; PHILLIPS, A. C.; AND LEPLEY, S. W., 2007, Surficial Geology of Monk Mound Quadrangle Madison and St. Clair Counties, Illinois: Illinois State Geological Survey, scale 1:24,000. HARRISON, R. W., 1997, Bedrock Geologic Map of the St. Louis 309 3 609 Quadrangle, Missouri and Illinois: U.S. Geological Survey, Miscellaneous Investigations Series Map I-2533, scale 1:100,000. HITCHCOCK, C. S.; LOYD, R. C.; AND HAYDON, W. D., 1999, Mapping liquefaction hazards in Simi Valley, Ventura County, California: Environmental Engineering Geoscience, Vol. 5, No. 4, pp. 441–458. HOEKSEMA, R. J.; CLAPP, R. B.; THOMAS, A. L.; HUNLEY, A. E.; FARROW, N. D.; AND DEARSTONE, K. C., 1989, Cokriging model for estimation of water table elevation: Water Resources Research, Vol. 25, No. 3, pp. 429–438. HOFFMAN, D., 2007, personal communication, National Hazards Mitigation Research Institute, Missouri University of Science and Technology, Rolla, MO. HOUGH, S. E.; ARMBRUSTER, J. G.; SEEBER, L.; AND HOUGH, J. F., 2000, On the Modified Mercalli Intensities and magnitudes of the 1811–1812 New Madrid, Central United States earthquakes: Journal Geophysical Research, Vol. 105, No. B10, pp. 23839–23864. IDRISS, I. M. AND BOULANGER, R. W., 2008, Soil Liquefaction during Earthquakes: Earthquake Engineering Research Institute, Oakland, CA, 237 p. ISAAKS, E. H. AND SRIVASTAVA, R. M., 1989, Applied Geostatistics: Oxford University Press, New York, 561 p. JOHNSTON, K.; VER HOEF, J. M.; KRIVORUCHKO, K.; AND LUCAS, N., 2001, Using Arcgis Geostatistical Analyst: Environmental Systems Research Institute Press, Redlands, CA, 316 p. JOURNEL, A. G. AND HUIJBREGTS, C., 1978, Mining Geostatistics: Academic Press, New York, 600 p. KELKAR, M. AND PEREZ, G., 2002, Applied Geostatistics for Reservoir Characterization: Society of Petroleum Engineers, Richardson, TX, 264 p. KOLATA, D. R., 2005, Bedrock Geology of Illinois: Illinois State Geological Survey, scale 1:500,000. KRAMER, S. L., 1996, Geotechnical Earthquake Engineering: Prentice Hall, Upper Saddle River, NJ, 653 p. LINEBACK, J. A., 1979, Quaternary Deposits of Illinois: Illinois State Geological Survey, scale 1:500,000. LUNA, R. AND FROST, J. D., 1998, Spatial liquefaction analysis system: Journal Computing Civil Engineering, Vol. 12, No. 1, pp. 48–56. MANSOOR, N. M.; NIEMI, T. M.; AND MISRA, A., 2004, A GISbased assessment of liquefaction potential of the City of Aqaba, Jordan: Environmental Engineering Geoscience, Vol. 10, No. 4, pp. 297–320. MCCARTHY, J. D. AND GRANIERO, P. A., 2006, A GIS-based borehole data management and 3D visualization system: Computers Geosciences, Vol. 32, No. 10, pp. 1699–1708. MCNULTY, W. E. AND OBERMEIER, S. F., 1999, Liquefaction evidence for at least two strong Holocene paleo-earthquakes in central and southwestern Illinois, USA: Environmental Engineering Geoscience, Vol. 5, No. 2, pp. 133–146. MIDDENDORF, M. A. AND BRILL, K. G., 2002, Geologic Map of the Oakville 7.59 Quadrangle Jefferson and St. Louis Counties, Missouri: Missouri Department of Natural Resources, Geological Survey and Resource Assessment Division, scale 1:24,000.
Environmental & Engineering Geoscience, Vol. XVI, No. 2, May 2010, pp. 143–162
161
Chung and Rogers MISSOURI DIVISION OF GEOLOGY AND LAND SURVEY (MODGLS), 2006, Missouri Environmental Geology Atlas [CD-ROM]: Missouri Department of Natural Resources–Division of Geology and Land Survey, Rolla, MO. MODGLS, 2007, Missouri Environmental Geology Atlas [CDROM]: Missouri Department of Natural Resources–Division of Geology and Land Survey, Rolla, MO. MYERS, D. E., 1982, Matrix formulation of co-kriging: Mathematical Geology, Vol. 14, No. 3, pp. 249–257. OBERMEIER, S. F.; OLSON, S. M.; AND GREEN, R. A., 2005, Field occurrences of liquefaction-induced features: A primer for engineering geologic analysis of paleoseismic shaking: Engineering Geology, Vol. 76, pp. 209–234. PALMER, J.; MESKO, T.; CADORET, J.; JAMES, K.; AND JONES, R., 2006, St. Louis, Missouri Surficial Materials Database, Unpublished Map: Missouri Department of Natural Resources, Division of Geology and Land Survey, Rolla, MO. PALMER, J.; MESKO, T.; JAMES, K.; CADORET, J.; AND JONES, R., 2005, St. Louis, Missouri Area Surficial Materials Database: U.S. Geological Survey Final Technical Report, 48 p. PALMER, J. R.; SIEMENS, M. A.; AND GAUNT, D., 2009, Surficial Material Geologic Map of the Wentzville 7.59 Quadrangle, St. Charles County, Missouri: Missouri Department of Natural Resources, Division of Geology and Land Survey, scale 1:24,000. PARK, C. B.; MILLER, R. D.; AND XIA, J., 1999, Multichannel analysis of surface waves: Geophysics, Vol. 64, No. 3, pp. 800–808. PHILLIPS, A. C., 2003, Surficial Geology of Edwardsville Quadrangle, Madison County, Illinois: Illinois State Geological Survey, scale 1:24,000. PHILLIPS, A. C., 2004, Surficial Geology of Collinsville Quadrangle, Madison and St. Clair Counties, Illinois: Illinois State Geological Survey, scale 1:24,000. PHILLIPS, A. C.; GRIMLEY, D. A.; AND LEPLEY, S. W., in review, Surficial Geology of Granite City Quadrangle, Madison and St. Clair Counties, Illinois: Illinois State Geological Survey, scale 1:24,000. RAHN, P. H., 1996, Engineering Geology: An Environmental Approach: Prentice Hall, Englewood Cliffs, NJ, 657 p. ROBERTSON, P. K.; SASITHARAN, S.; CUNNING, J. C.; AND SEGO, D. C., 1995, Shear-wave velocity to evaluate in-situ state of Ottawa sand: Journal Geotechnical Engineering, Vol. 121, No. 3, pp. 262–303. ROGERS, J. D.; KARADENIZ, D.; AND KAIBEL, C. K., 2007, Seismic response modeling for Missouri River highway bridges: Journal Earthquake Engineering, Vol. 11, No. 3, pp. 400– 424. SATTERFIELD, I. R., 1977, Rock. In Howe, W. B. and Fellows, L. D. (Editors), The Resources of St. Charles County, Missouri Land, Water, and Minerals: Missouri Geological Survey, Department of Natural Resources, Rolla, MO, pp. 146–153. SCHULTZ, A. P., 1993, Map Showing Surficial Geology of the St. Louis 30360 Minute Quadrangle: U.S. Geological Survey Open-File Report 93-288, scale 1:100,000. SHIRLEY, D. J. AND HAMPTON, L. D., 1978, Shear wave measurements in laboratory sediments: Journal Acoustical Society America, Vol. 63, No. 2, pp. 607–613. SONMEZ, H. AND GOKCEOGLU, C., 2005, A liquefaction severity index suggested for engineering practice: Environmental Geology, Vol. 48, No. 1, pp. 81–91. STINCHCOMB, B. L. AND FELLOWS, L. D., 2002, Geologic Map of the Maxville 7.59 Quadrangle Jefferson and St. Louis Counties, Missouri: Missouri Department of Natural Resources, Geological Survey and Resource Assessment Division, scale 1:24,000.
162
STOESER, D. B.; GREEN, G. N.; MORATH, L. C.; HERAN, W. D.; WILSON, A. B.; MOORE, D. W.; AND VAN GOSEN, B. S., 2005, Preliminary Integrated Geologic Map Databases for the United States Central States: Montana, Wyoming, Colorado, New Mexico, Kansas, Oklahoma, Texas, Missouri, Arkansas, and Louisiana: U.S. Geological Survey Open-File Report 2005-1351. STOKOE, K. H., II AND WOODS, R. D., 1972, In situ shear wave velocity by cross-hole method: Journal Soil Mechanics Foundations Division, Proceedings American Society Civil Engineers, SM 5, pp. 443–460. STREET, R.; BAUER, R.; AND WOOLERY, E., 2004, Short note: Magnitude scaling of the prehistorical earthquakes in the Wabash Valley seismic zone of the central United States: Seismological Research Letters, Vol. 75, No. 5, pp. 637–641. STREET, R.; WANG, Z.; WOOLERY, E.; HUNT, J.; AND HARRIS, J., 1997, Site effects at a vertical accelerometer array near Paducah, Kentucky: Engineering Geology, Vol. 46, No. 3–4, pp. 349–367. SU, W.-J., 2001, Engineering problems caused by loess in the St. Louis metro east area. In Malone, D. (Editor), Guidebook for Fieldtrips for the Thirty-Fifth Annual Meeting of the NorthCentral Section of the Geological Society of America: Illinois State Geological Survey Guidebook 33, Champaign, IL, pp. 68–70. SWIFT, J. N.; TURNER, L. L.; BENOIT, J.; STEPP, J. C.; AND ROBLEE, C. J., 2004, Archiving and Web Dissemination of Geotechnical Data: Development of a Pilot Geotechnical Virtual Data Center; PEER Lifelines Project 2L02, Consortium of Organization for Strong-Motion Observation System. THORP, J. AND SMITH, H. T. U., 1952, Pleistocene Eolian Deposits of the United States, Alaska, and Part of Canada: Geological Society of America, New York, scale 1:2,500,000. TODD, D. K., 1980, Groundwater Hydrology: Wiley, New York, 535 p. TUTTLE, M. P., 2005, Paleoseismological Study in the St. Louis Region: U.S. Geological Survey Final Technical Report, 29 p. TUTTLE, M. P.; CHESTER, J.; LAFFERTY, R.; DYER-WILLIAMS, K.; AND CANDE, B., 1999, Paleoseismology Study Northwest of the New Madrid Seismic Zone: U.S. Nuclear Regulatory Commission, NUREG/CR-5730, 96 p. WHITFIELD, J. W., 2002, Geologic Map of the House Spring 7.59 Quadrangle Jefferson County, Missouri: Missouri Department of Natural Resources, Geological Survey and Resource Assessment Division, scale 1:24,000. WHITFIELD, J. W.; WARD, R. A.; DENNE, J. E.; HOLBROOK, D. F.; BUSH, W. B.; LINEBACK, J. A.; LUZA, K. V.; JENSEN, K. M.; FISHMAN, W. D. (STATE COMPILATIONS); RICHMOND, G. M.; AND WEIDE, D. L. (EDITED AND INTEGRATED), 1993, Quaternary Geologic Map of the Ozark Plateau 4u 3 6u Quadrangle, United States: U.S. Geological Survey, Miscellaneous Investigations Series Map I-1420 (NJ-15), scale 1:1,000,000. WILLIAMS, R. A., 2007, personal communication, U.S. Geological Survey, Golden, CO. WILLIAMS, R. A.; ODUM, J. K.; STEPHENSON, W. J.; AND HERRMAN, R. B., 2007, Shallow P- and S-wave velocities and site resonances in the St. Louis region, Missouri–Illinois: Earthquake Spectra, Vol. 3, pp. 711–726. WOODS, R. D., 1994, Geophysical Characterization of Sites: International Science Publisher, New York, 141 p. ZHOU, W.; CHEN, G.; LI, H.; LUO, H.; AND HUANG, S. L., 2007, GIS application in mineral resource analysis—a case study of offshore marine placer gold at Nome, Alaska: Computers Geosciences, Vol. 33, No. 6, pp. 773–788.
Environmental & Engineering Geoscience, Vol. XVI, No. 2, May 2010, pp. 143–162