Global Drinking Water Quality Index. Authorship. The main authors of this report
are Carrie Rickwood and Geneviève M. Carr. The figures and diagrams were ...
___________________________
Global Drinking Water Quality Index Development and Sensitivity Analysis Report
Global Drinking Water Quality Index Development and Sensitivity Analysis Report Prepared and published by the United Nations Environment Programme Global Environment Monitoring System (GEMS)/Water Programme © 2007 United Nations Environment Programme Global Environment Monitoring System/Water Programme. ISBN 92-95039-14-9
This document may be reproduced in whole or in part in any form for educational or not-for-profit purposes, without special permission from the copyright holders, provided that acknowledgement of the source is made. GEMS/Water would appreciate receiving a copy of any publication that uses this reference guide as a source. No use of this publication may be made for resale or for any other commercial purpose whatsoever, without prior written permission from GEMS/Water. The contents of this publication do not necessarily reflect the views of UNEP or of UNEP GEMS/Water Programme, nor do they constitute any expression whatsoever concerning the legal status of any country, territory, city, of its authorities, or of the delineation of its frontiers or boundaries. Mention of a commercial company or product in this report does not imply endorsement by UNEP or of UNEP GEMS/Water. The use of information from this publication concerning proprietary products for publicity or advertising is not permitted. A PDF version of this document may be downloaded from the GEMS/Water website at http://www.gemswater.org
UNEP GEMS/Water Programme Office c/o National Water Research Institute 867 Lakeshore Road Burlington, Ontario, L7R 4A6 CANADA website: http://www.gemswater.org tel: +1-905-336-4869 fax: +1-905-336-4582 email:
[email protected]
Global Drinking Water Quality Index
Authorship The main authors of this report are Carrie Rickwood and Geneviève M. Carr. The figures and diagrams were created by Kelly Hodgson. Advice and editing were provided by Richard Robarts and Sabrina Barker. The following people participated in the peer review of this report, and their contributions are greatly appreciated: R.M. Bhardwaj, Ministry of Environment & Forests ‘Parivesh Bhawan,’ India Salif Diop, United Nations Environment Programme, Kenya Oscar E. Natale, Instituto Nacional de Agua, Argentina Harold van Niekerk, Department of Water Affairs and Forestry, South Africa Alexander de Sherbinin, CIESIN, Columbia University, USA Leendert Vijselaar, DACAAR, Afghanistan Monique Dubé, University of Saskatchewan, Canada Ilia Bounari, Division de la Qualité et Pollution des Eaux, Niger Ali Abdul-Zahra Zebon Al-Lami, Ministry of Environment, Iraq
1
____________________________________________________________________________________
Development and Sensitivity Analysis Report
Contents Chapter 1 Introduction ....................................................................................................................................3 Composite Indices of Water Quality – a Review ....................................................................................3 Model Selection ...........................................................................................................................................6 Chapter 2 Benchmark, Parameter, and Station Selection ...........................................................................8 Guideline Selection .....................................................................................................................................8 World Health Organisation drinking water guidelines ....................................................................8 Non-detects and Zeros..............................................................................................................................11 Global Coverage - Sampling Frequency.................................................................................................12 Measurement Consistency – the ‘Four by Four’ Rule ..........................................................................13 Chapter 3 Derivation and Application of the Index..................................................................................15 Canadian Water Quality Index (CWQI) Equation................................................................................15 WQI Designations .....................................................................................................................................16 Global Water Quality Index .....................................................................................................................16 Chapter 4 Validation and Sensitivity Analysis ..........................................................................................19 1) F1, F2 and F3 Analysis............................................................................................................................19 2) Parameter Contributions and Correlation Analysis.........................................................................21 Conclusions ...........................................................................................................................................27 Global Water Quality Index – Revised ...................................................................................................28 3) Sensitivity Analysis...............................................................................................................................28 AWQI .....................................................................................................................................................31 HWQI .....................................................................................................................................................32 Conclusions from Sensitivity Analysis ..............................................................................................33 Conclusions ................................................................................................................................................33 Chapter 5 .........................................................................................................................................................35 Vistula River, Poland: Case Study ..........................................................................................................35 Validation of the indices ......................................................................................................................37 1. Kiezmark – Station 021001..........................................................................................................37 2) Warsaw – Station 021002 ............................................................................................................43 3) Kraków – Station 021003.............................................................................................................48 Conclusions from the Case Studies....................................................................................................53 Chapter 6 Future Developments..................................................................................................................55 References .......................................................................................................................................................57
____________________________________________________________________________________
2
Global Drinking Water Quality Index
Chapter 1 Introduction As the principal United Nations body on environment, the UN Environment Programme (UNEP) had been tasked by UN-Water to lead on freshwater quality and aquatic ecosystem data and information inputs to the World Water Assessment Programme, and the main WWAP output, the World Water Development Report series. Part of this task involves developing global water quality indicators and ultimately, a global water quality index. UNEP delegated this responsibility to its GEMS/Water Programme, with direction to convene an international experts’ workshop designed to implement the indicators and index requirements. The workshop, attended by a group of selected indicator specialists, was convened at IAEA headquarters in Vienna, Austria (May 4th – 6th 2005) with the objective of reviewing the topic of water quality indicators/indices and making recommendations and suggestions on approaches and actions that GEMS/Water might consider in its future operations. The experts’ first recommendation was that GEMS/Water should develop a pilot study to develop an index to assess the global status of drinking water in source water supplies (UNEP GEMS/Water, 2005). The experts’ recommendation report is available on the GEMS/Water website. This report presents the results of implementing the experts’ first recommendation. It outlines an approach taken to develop a global water quality index, as well as preliminary sensitivity analysis and validation of the index against real water quality data. Limitations to the index are discussed, as well as next steps.
Composite Indices of Water Quality – a Review Any number of water quality measurements can serve, and have already been used, as indicators of water quality. However, there is no single measure that can describe overall water quality for any one body of water, let alone at a global level. As such, a composite index that quantifies the extent to which a number of water quality measures deviate from normal, expected or ‘ideal’ concentrations may be more appropriate for summarizing water quality conditions across a range of inland water types and over time. Although there is no globally accepted composite index of water quality, some countries and regions have used, or are using, aggregated water quality data in the development of water quality indices. Most water quality indices rely on normalizing, or standardizing, data parameter by parameter according to expected concentrations and some interpretation of ‘good’ versus ‘bad’ concentrations. Parameters are often then weighted according to their perceived importance to overall water quality and the index is calculated as the weighted average of all observations of interest (e.g., Pesce and Wunderlin, 2000; Stambuk-Giljanovic, 1999; Sargaonkar and Deshpande, 2003; Liou et al., 2004; Tsegaye et al., 2006). Summaries of the indices are given in Table 1, a full review of each index follows. Pesce and Wunderlin (2000) compared the performance of three water quality indices on the Suquía River in Argentina. All three indices were calculated using observations for 20 different parameters that were normalized to a common scale according to observed concentrations and expected ranges. The ‘objective’ and ‘subjective’ indices were then calculated as a function of the normalized values, the relative weight assigned to each parameter, and, in the case of the subjective index, a constant that represented the visual impression of the contamination level of a monitoring station.
3
____________________________________________________________________________________
Development and Sensitivity Analysis Report
A third index, the ‘minimal’ index, was calculated as the average of the normalized values for only three parameters (dissolved oxygen, conductivity, and turbidity). The study reported that the minimal index was well correlated to the objective index, and that both water quality indices were generally correlated to the measured concentrations of different parameters. In a study similar to the Argentinean one, Stambuk-Giljanovik (2003) compared the performance of several water quality indices for Croatian waters. All indices are similar to the objective index used in Argentina in that field measurements were normalized, or scored, on a parameter by parameter basis according to their observed concentrations and then a weighted average index was calculated from the normalized values. The indices were tested with data for nine water quality parameters collected monthly over one year at 50 sites in Croatia. Examination of the different water quality indices found that two modified arithmetic indices were best suited for discriminating sites according to water quality condition (good versus poor). Liou et al. (2004) developed an index of river water quality in Taiwan that is a multiplicative aggregate function of standardized scores for temperature, pH, toxic substances, organics (dissolved oxygen, BOD, ammonia), particulate (suspended solids, turbidity), and microorganisms (faecal coliforms). The standardized scores for each water quality parameter are based on predetermined rating curves, such that a score of 100 indicates excellent water quality and a score of 0 indicates poor water quality. The index relies on the geometric means of the standardized scores. Tsegaye et al. (2006) developed a chemical water quality index based on data from 18 streams in one lake basin in northern Alabama that summed the concentration of seven water quality parameters (total nitrogen, dissolved lead, dissolved oxygen, pH, and total, particulate and dissolved phosphorus) after standardizing each observation to the maximum concentration for each parameter. Kim and Cardone (2005) developed a water quality index that evaluates changes in water quality over time and space. The Scatterscore index identifies increases or decreases in any water quality parameter over time and/or space. It does not rely on water quality standards or guidelines and can include an unlimited number of parameters. It was developed primarily to detect positive or negative changes in water quality around mining sites in the United States, but could be applied to non-impacted sites as well. Sargaonkar and Deshpande (2003) developed the Overall Index of Pollution (OIP) for Indian rivers based on measurements and subsequent classification of pH, turbidity, dissolved oxygen, BOD, hardness, total dissolved solids, total coliforms, arsenic, and fluoride. Each water quality observation was scored as Excellent, Acceptable, Slightly Polluted, Polluted, and Heavily Polluted, according to Indian standards and/or other accepted guidelines and standards such as World Health Organization and European Community Standards. Once categorized, each observation was assigned a pollution index value and the OIP was calculated as the average of each index value. The Well-being Assessment (Prescott-Allen, 2001) calculates a number of indices to assess global human and environmental condition. The indices were developed under two main categories: 1) Human well-being, including indices for health and population, which assesses both health life expectancy and total fertility rate, and, indices for wealth which assesses average household and national wealth; and
____________________________________________________________________________________
4
Global Drinking Water Quality Index
2) Ecosystem well-being, which includes assessment of both air, such as greenhouse gases and ozone depleting substances and water, such as inland water quality, river conversion and water withdrawal. To establish an overall Well-being Index, the human and ecosystem indices are combined. The method yields a score for each country, with the top scores translating into a high quality of life for a low environmental price and the lower scores translating into a low quality of life for a high environmental price. The Environmental Performance Index (Esty et al., 2006) is composed of 16 indicators that represent various policy-relevant objectives on a global scale. There are six policy categories: environmental health, air quality, water resources, biodiversity and habitat, productive natural resources and sustainable energy. These six categories are placed into two broad objectives: Environmental Health and Ecosystem Vitality which are then combined to give the overall Environmental Performance Index (EPI). To calculate the EPI, each of the 16 indicators are converted to a proximity-to-target measure and placed onto a 0 to 100 scale (100 is the target and zero is the worst observed value). Principle components analysis is then conducted with all the indicators to distinguish weights for each indicator and groupings into specific objectives and/or policy categories. Those without a clear designation on the PCA are placed into their policy categories after literature review and expert consultation. The EPI score is calculated on a country by country basis that results in a global ranking of countries. Instead of normalizing observed values to subjective rating curves, the Canadian Water Quality Index (CWQI) compares observations to a benchmark, where the benchmark may be a water quality standard or site specific background concentration (CCME, 2001; Khan et al., 2003; Lumb et al., 2006). The CWQI quantifies for one station, over a predetermined period of time (typically one year), the number of parameters that exceed a benchmark, the number of records in a dataset that exceed a benchmark, and the magnitude of exceedance of the benchmark. The index is flexible in terms of the benchmarks that are used for calculation, and depends on the information required from the index: that is, guidelines for the protection of aquatic life may be used (when available) if the index is being calculated to quantify ecological health of the water, or drinking water quality guidelines may be used if the interest in the index is in drinking water safety. Alternatively, information describing natural background conditions for a station or region may be used as benchmarks when trying to quantify deviation from natural conditions. Sites at which water quality measurements never or rarely exceed the benchmark have high CWQI scores (near 100), whereas sites that routinely have measurements that exceed benchmarks have low CWQI scores (near 0). Similar to indices of economic strength, such as Gross National Product (GNP), these water quality indices take information from a number of sources and combine them to develop an overall snapshot of the state of the national system. Even though there is considerable debate as to which measures should be included in the derivation of an index, and which information the index provides to the general public and to policy makers, there is some agreement that water quality indices are useful tools for comparing water quality across systems and over time. They can also provide a benchmark for evaluating successes and failures of management strategies aimed at improving water quality.
5
____________________________________________________________________________________
Development and Sensitivity Analysis Report
Table 1: Summary of indices developed which assess water quality either on a national or global level Index
Objective
The Scatterscore index
Water quality
The Well-being of Nations Environmental Performance Index
Human and Ecosystem Environmental health and ecosystem vitality River health
Index of River Water Quality
Overall Index of Pollution
River health
Chemical Water Quality Index
Lake basin
Water Quality Index for Freshwater Life
Inland waters
Method Assesses increases or decreases in parameters over time and/or space Assesses human indices against ecosystem indices Uses a proximity-to-target measure for sixteen indices categorized into six policy objectives Uses multiplicative aggregate function of standardized scores for a number of water quality parameters Assessment and classification of a number of water quality parameters by comparing observations against Indian standards and/or other accepted guidelines e.g. WHO Assesses a number of water quality parameters by standardizing each observation to the maximum concentration for each parameter Assesses quality of water against guidelines for freshwater life
Use/ Distribution Mining sites, USA Globally
Author Kim and Cardone (2005)
Globally
Prescott-Allen (2001) Levy et al. (2006)
Taiwan
Liou et al. (2004)
India
Sargaonkar and Deshpande (2003)
USA
Tsegaye et al. (2006)
Canada
CCME (2001)
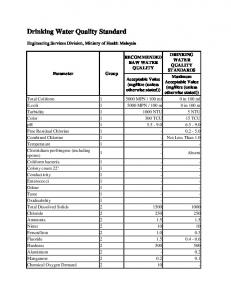
Model Selection There are many global water quality issues, and a number of priority issues of concern. One of these is safeguarding human drinking water supplies. The protection of source water quality for domestic use (drinking water, abstraction etc) was identified by the experts’ group as a priority for assessment. It was selected because of its significance to human health; could be conducted on a global scale; and the approach for assessment would be user-based and involve application of common guidelines such as those from the World Health Organisation (WHO) across multiple water quality monitoring stations. The experts’ group selected the CWQI as the model that UNEP GEMS/Water programme should follow in developing the global water quality index. This model was selected as it requires the use of a benchmark or guideline which allowed us to compare values to the World Health Organisation’s Drinking Water Quality Guidelines (WHO, 2004; Table 2). The primary purpose of the WHO guidelines is to protect public health by describing guideline values for constituents of water or indicators of water quality. By applying the Canadian index model and WHO guidelines to our data set we were able to develop an index that uses globally accepted guidelines for drinking water.
____________________________________________________________________________________
6
Global Drinking Water Quality Index
The source for water quality data used to analyze and validate the index calculations is GEMStat, the online global database of water quality for inland waters maintained by GEMS/Water. GEMStat has over two million entries for lakes, reservoirs, rivers and groundwater systems, and its 2,800 monitoring stations include baseline, trend and flux stations (www.gemstat.org). GEMS/Water has recently broadened the scope of its datasets to cover parameters related to wastewater and sanitation, including metals, persistent organic pollutants, water-borne pathogens and micropollutants. The development of a global index of water quality will not only allow assessment of changes in water quality over time and space but also evaluate successes and shortcomings of domestic policy and international treaties designed to protect aquatic resources. For example, a global index will be one tool for tracking progress toward meeting the Millennium Development Goals and the Plan of Implementation of the World Summit on Sustainable Development, as well as other internationally agreed goals and targets. The approach developed and outlined in this report will be used as a framework for tailoring other types of global indices of water quality. The index described here will be used for source drinking water, but the data selection approach will be comparable for the development of other indices, such as biodiversity and eutrophication indices. This report is broken down into a development stage (chapters 2 and 3), sensitivity analysis (chapter 4), followed by validation of the index against real data, outlined in a case-study using data from the Vistula River, Poland (chapter 5). Finally, future development of the indices for drinking water quality is discussed (chapter 6).
7
____________________________________________________________________________________
Development and Sensitivity Analysis Report
Chapter 2 Benchmark, Parameter, and Station Selection The approach for developing an index for global source drinking water quality has three parts: 1) Selecting benchmarks (usually guidelines or standards) that are appropriate in assessing global water quality for human health; 2) Selecting parameters from GEMStat that have an appropriate benchmark and have reasonable global coverage; and 3) From this list, selecting only stations that measure parameters consistently on an annual basis.
Guideline Selection World Health Organisation drinking water guidelines Our first objective was to select water quality parameters that could be associated with an existing drinking water quality guideline. As the goal was to develop a global index, the parameters selected were based on those in the World Health Organisation’s Drinking Water Guidelines (Table 2.). To assess the robustness of these guidelines, comparisons with drinking water quality guidelines currently in place in the European Union, Australia and USA were conducted (Table 3). For this comparison we selected some of the most common parameters measured and reported in our database (ammonia, pH, chloride, iron, lead, arsenic, copper and faecal coliform bacteria) and compared values (Table 3). The guidelines for the parameters selected compared well across nations and international agencies, with little deviation from each other (Table 3). The only WHO guideline that was substantially higher than the others was ammonia (1.5 mg L-1), when compared to the EU and Australian guideline of 0.5 mg L-1. The ammonia guideline is set for aesthetic considerations rather than health (no health guideline exists for ammonia) due to its corrosive potential of copper pipes and fittings. The WHO guideline of 1.5 mg L-1 was set as an acceptability guideline based on taste and odour (specifically odour) and therefore was considered acceptable for the purposes of our index. It was concluded that based on the parameters selected, WHO drinking water quality guidelines were representative of a number of national guidelines currently in place, and, therefore were selected for use in our index development.
____________________________________________________________________________________
8
Global Drinking Water Quality Index
Table 2: List of WHO guidelines for chemicals held in GEMStat Chemical 2,4 –D Aldicarb Aldrin and dieldrin Aluminium Ammonia Antimony Arsenic
Unit mg L-1 mg L-1 mg L-1
Guideline 0.03 0.01 0.00003
Guideline remarks Applies to free acid
Guideline type Health Health Health
Source Agriculture Agriculture Agriculture
mg L-1 mg L-1 mg L-1 mg L-1
0.1 1.5 0.02 0.01
0.1-0.2-deposits Odour
Acceptability Acceptability Health Health
Treatment Natural
Atrazine Barium Benzene
mg L-1 mg L-1 mg L-1
0.002 0.7 0.01
Boron Cadmium
mg L-1 mg L-1
0.5 0.003
Provisional – trtmt limits
Health Health
Chloride Chromium
mg L-1 mg L-1
250 0.05
Acceptability Health
Natural
Copper
mg L-1
2
Health
Treatment
Cyanide
mg L-1
200-300 –> tastes salty Provisional – health effects uncertain Staining may occur below guideline
0.07
Health
DDT and metabolites Endrin Faecal coliform bacteria Fluoride
mg L-1
0.001
Health
mg L-1 counts/ 100mL
0.0006 0
Health Health
Industrial Human Pesticides for public health Agriculture
mg L-1
1.5
Hardness Hydrogen sulphide Iron Lead Lindane Manganese
mg L-1 mg L-1
200 0.05
mg L-1 mg L-1 mg L-1 mg L-1
0.3 0.01 0.002 0.4
Mercury
mg L-1
0.001
Nickel
mg L-1
0.02
Nitrate Nitrite
mg L-1 mg L-1
50 3
mg L-1
6.5 8 0.01
pH pH Selenium
9
Provisional – health effects uncertain
Health Health Health
Adjust for volume of water consumed 500: taste threshold 0.05-0.1 –-> taste and odour threshold Staining and taste
Taste, odour, appearance may be affected at or below guideline (~0.1mg L-1) Total mercury (inorganic plus organic) Provisional – health effects uncertain Short-term exposure Short-term exposure Long-term exposure; Provisional – health Minimum Maximum
Health
Agriculture Natural Industrial Human Natural Industrial Human
Natural
Acceptability Acceptability Acceptability Health Health Health
Health
Treatment Agriculture Natural
Health
Industrial Human Treatment
Health Health
Agriculture Agriculture
Acceptability Acceptability Health
Natural
____________________________________________________________________________________
Development and Sensitivity Analysis Report
Chemical Sodium Sulphate
Unit mg L-1 mg L-1
Guideline 200 250
Total dissolved solids Turbidity
mg L-1
600
NTU1
5
Zinc mg L-1 3 1Nephelometric turbidity units.
Guideline remarks Taste 250-1000; taste and odour, maybe laxative 600 – 1000; taste
Guideline type Acceptability Acceptability
Appearance; 0.1 median for disinfection 3-5 –> taste, films
Acceptability
Source
Acceptability
Acceptability
Table 3: Comparison of WHO drinking water guidelines for selected parameters against guidelines from the European Union (EU), United States (USEPA) and Australia Parameter WHO EU† USEPA Australia -1 Ammonia 1.5 mg L 0.50 mg L-1 No GL 0.50 mg L-1 pH 6.5-8 No G L-1 6.5-8.5 6.5-8.5 -1 Chloride 250 mg L 250 mg L-1 250 mg L-1 250 mg L-1 -1 -1 -1 Iron 0.3 mg L 0.2 mg L 0.3 mg L 0.3 mg L-1 -1 -1 -1 Lead 0.01 mg L 0.01 mg L 0.015 mg L 0.01 mg L-1 -1 -1 -1 Arsenic 0.01 mg L 0.01 mg L 0.01 mg L 0.007 mg L-1 -1 -1 -1 Copper 2.0 mg L 2.0 mg L 1.3 mg L 2.0 mg L-1 Faecal coliform 0 counts/100 mL 0 counts/100 mL 0 counts/100 mL No GL bacteria † WHO guidelines for drinking water were used as a basis for the standards for the EU Drinking Water Directive.
The WHO guidelines divide water quality parameters into two categories: i. ii.
Health guidelines, which take into account chemical and radiological constituents that have the potential to directly adversely affect human health; and Acceptability guidelines, which include parameters that may not have any direct health effects but result in objectionable taste or odour in the water.
Water that is highly turbid, highly coloured or that has an objectionable taste or odour could lead the consumer to believe that the water is unsafe. Microbial guidelines are also outlined by the WHO, to prevent contamination, and/or ingestion of water that is contaminated with human or animal (including bird) faeces. As these microbial guidelines are regarded as a human health issue, they are classed, for our purposes, under the health guidelines. When choosing the parameters to include in the index, we assessed microbial measurements because they are an important predictor of water quality and are commonly reported in GEMStat. However, the WHO guideline for faecal contamination is zero counts per 100 mL; that is, any detection within treated water intended for drinking is unacceptable. As the GEMS/Water monitoring stations, used in this index, can be classed as untreated water (i.e. source water), the current WHO guideline was considered too stringent. Guidelines for microbes in source water have been suggested elsewhere. For example, the Government of Swaziland set guidelines for drinking water quality in rural areas which included a faecal and total coliform bacteria guideline at 10 counts per 100 mL for untreated water intended for ____________________________________________________________________________________
10
Global Drinking Water Quality Index
drinking (Government of Swaziland, 1998). As microbial measurements were considered too important to omit from our index, a guideline of 10 counts per 100 mL was set for microbial parameters to account for the fact that GEMStat data are collected from untreated water as opposed to treated water intended for drinking. Following the decision to use the WHO guidelines, a drinking water quality index was developed using both health (including microbial) and acceptability measurements. In addition, based on the health and acceptability categories defined by the WHO, two further indices were developed to allow assessment of water quality on two scales 1) human health issues and 2) human acceptability issues. Therefore, the three indices developed were: 1) Drinking Water Quality Index (DWQI); which includes all parameters from the WHO guideline including microbes; and 2) Health Water Quality Index (HWQI); in which only health and microbial measurements are included to assess human health issues; and 3) Acceptability Water Quality Index (AWQI); which only includes acceptability measurements. From a purely human health perspective, the HWQI will provide a more relevant assessment of water quality as it includes only parameters that have the potential to result in adverse health effects in humans. The AWQI will provide assessment of the public’s perception of the quality of water, rather than specific health issues, as it assesses parameters that may cause unacceptable taste or odour. These parameters do not necessarily have any detrimental health effects. The DWQI is composed of both the HWQI and AWQI and, as such, will give an overall ‘big picture’ as to the quality of water. It is important to stress that while these indices should provide an overall picture of the quality of a body of water, they can not be relied upon to definitely determine if a water source is safe for drinking. Primarily because of a lack of available monitoring data, there are a number of parameters that were not included in the indices that could still adversely affect the safety or acceptability of water for drinking.
Non-detects and Zeros The inclusion of non-detects and zeros into the indices were assessed due to the possibility of bias into the equation. Parameters that have a non-detectable value are due to concentrations in the water-body that are below the detection-limit (either method or instrumental). The detection limit (DL) for any of the parameters, can be either lower or higher than the respective guideline, that is, a specific method may have a detection limit of 5 mg L-1, however the guideline is set at 2 mg L-1. If the DL is greater than the guideline we are not able to assess whether the true value is in exceedance or not. This means that regardless of whether the parameter is detected it will always be in exceedance of the guideline. In contrast, if the detection limit is less than the guideline then we would be certain that the level measured was not in exceedance. The inclusion of non-detects where the DL greater than the guideline may produce false exceedances, whereas we know that if the DL less than the guideline it is a true non-exceedance value. Due to this uncertainty when the DL greater than the guideline, all records with a value that was recorded as being ‘below detection’ and where the DL was greater than the guideline were removed. These are shown in Table 4. This does not mean that these parameters have been removed all together; only those observations that were reported as being non-detects and where the DL was greater than the guideline.
11
____________________________________________________________________________________
Development and Sensitivity Analysis Report
GEMStat contains some older records with reported values of zero that most likely represent measurements below analytical detection but where the detection limit is unknown. With the exception of faecal coliform bacteria (FCB), all zero values were removed from the database as they do not represent a true value and could produce false-negatives (i.e., non-exceedances), skewing the index in a favourable direction. In the case of FCB, zero is a true measure in that it implies that no FCB were detected in the sample.
Table 4: Parameters that had analytical methods with detection limits greater than the WHO guideline Detection Parameter Limits Arsenic 0.013 - 0.8 Cadmium 0.0038 - 5 Chromium 0.07-2 HEALTH Copper 5 Lead 0.011 - 1 Manganese 1 - 1.1 Mercury 2 - 200 Aluminum 0.102 - 1 ACCEPTABILITY Iron 0.5 - 1.2 MICROBE Faecal coliform bacteria 16 - 110000 Note: Detection limits show the range for different analytical methods. Guideline Type
Guideline 0.01 0.003 0.05 2 0.01 0.4 1 0.1 0.3 10
Units mg L-1 As mg L-1 Cd mg L-1 Cr mg L-1 Cu mg L-1 Pb mg L-1 Mn µg L-1 Hg mg L-1 Al mg L-1 Fe No. 100 mL-1 MF
Global Coverage - Sampling Frequency Further refinement of the test database was needed to ensure that the parameters included in the index were adequately represented globally. Minimum global and regional coverage for each parameter was chosen. We determined criteria for the percent coverage of countries within each region: Asia, Africa, Americas, Europe and Oceania. We selected three criteria: 20%, 35% and 50% coverage limits for each region to be assessed. That is, each parameter must be measured in either 20%, 35% or 50% of countries within each region. The results of this analysis are reported in Table 5. These data were broken down by WHO criteria: Acceptability, Health and Microbes.
____________________________________________________________________________________
12
Global Drinking Water Quality Index
Table 5: Parameters measured in 20%, 35% and 50% of countries in all regions: Europe, Asia, Africa, Americas and Oceania. Parameters are divided according to their category
20%
35%
50%
Acceptability Ammonia Chloride Iron pH Sodium Sulphate Zinc
Ammonia Chloride Iron pH Sodium Sulphate Zinc Ammonia Chloride Iron pH Sodium
Health Arsenic Boron Cadmium Chromium Copper Fluoride Lead Manganese Mercury Nitrate Nitrite Copper Fluoride Lead Manganese Nitrate Nitrite
Microbes Faecal coliform bacteria
Copper Fluoride Manganese Nitrate
Faecal coliform bacteria
Faecal coliform bacteria
It is evident that microbe and acceptability parameters are quite consistent at all three levels. However, at 35% and 50% a number of parameters under the health criteria are lost. Under the 20% criteria, a wider selection of parameters is included and, as such, improves the relevance of the indices (specifically HWQI). For this reason, the 20% criterion was selected as a global distribution guideline for the development of the indices. Thus, each parameter included in the index had to be measured in at least 20% of countries in each of the major regions. Once these parameters were selected, three databases were created: 1) Drinking Water, 2) Health and 3) Acceptability. Once the databases were created, further refinement within each database was required.
Measurement Consistency – the ‘Four by Four’ Rule Following selection of water quality parameters based on water quality guideline availability, as well as based on global and regional coverage of the different water quality parameters, the three databases that were generated for index calculation were further refined to only include data from stations where monitoring of several parameters was consistent over time. It is recommended by the Canadian Council of Ministers for the Environment (CCME, 2001), that a water quality index should not be calculated for a station with any fewer than four parameters and four sampling visits per year. Data should be selected from stations that have measured a minimum of any four
13
____________________________________________________________________________________
Development and Sensitivity Analysis Report
parameters per year, and, that each of these parameters is measured at least four times per year, hence, the ‘Four by Four’ (4x4) rule. This rule ensures that only stations that regularly monitor parameters are included. Of course, by including this rule we are limiting our analysis to only those monitoring stations that have adequate replication, resulting in elimination of stations that have, for example, only three monitoring phases per year. It is suggested for future development that this rule be assessed to provide some analysis of the number and location of stations eliminated when this rule is implemented and a comparison with alternative rules e.g. a 3 x 3 rule be conducted. For the purposes of this investigation, the 4x4 rule was applied to each database (Drinking, Health and Acceptability). This led to three refined databases with parameters selected that had met all of the following criteria: 1) Measured >20% country coverage in each region: Asia, Africa, Europe, Oceania and Americas; 2) Measured at least four times per year at stations that had measured at least four parameters; and 3) Had detection limits less than guideline and zeros removed (except for FCB). The index calculation was then run on each database resulting in three indices: 1) Drinking Water Quality Index (DWQI; all parameters regardless of WHO designation); 2) Health Water Quality Index (HWQI; health and microbial criteria only); and 3) Acceptability Water Quality Index (AWQI; acceptability criteria only). The calculation of the indices is described in the following chapter.
____________________________________________________________________________________
14
Global Drinking Water Quality Index
Chapter 3 Derivation and Application of the Index The index equation is based on the water quality index (WQI) endorsed by the Canadian Council of Ministers of the Environment (CCME, 2001). The index allows measurements of the frequency and extent to which parameters exceed their respective guidelines at each monitoring station. Therefore, the index reflects the quality of water for both health and acceptability, as set by the World Health Organisation. The index is determined on an annual basis resulting in an overall rating for each station per year. This will allow both spatial and temporal assessment of global water quality to be undertaken.
Canadian Water Quality Index (CWQI) Equation The CWQI equation is calculated using three factors as follows: WQI = 100 -
⎛ F2 + F2 + F2 2 3 ⎜ 1 ⎜ 1.732 ⎝
⎞ ⎟ ⎟ ⎠
F1 represents Scope: Scope The percentage of parameters that exceed the guideline
⎛ # failed parameters ⎞ ⎟⎟ ×100 F1 = ⎜⎜ Total # of parameters ⎝ ⎠ F2 represents Frequency: The percentage of individual tests within each parameter that exceeded the guideline
⎛ # failed tests ⎞ F2 = ⎜ ⎟ × 100 ⎝ Total # of tests ⎠ F3 represents Amplitude: The extent (excursion) to which the failed test exceeds the guideline. This is calculated in three stages. First, the excursion is calculated
⎛ failed test value ⎞ ⎟⎟ − 1 excursion = ⎜⎜ ⎝ guideline value ⎠ NB: in the case of pH where a minimum and maximum guideline is given, the excursion equation must be run as above as well as in reverse i.e. guideline value/failed test value. Second, the normalized sum of excursions (nse) is calculated as follows:
⎛ ∑ excursion ⎞ ⎟ nse = ⎜⎜ ⎟ total # of tests ⎝ ⎠ F3 is then calculated using a formula that scales the nse to range between 1 and 100:
nse ⎛ ⎞ F3 = ⎜ ⎟ ⎝ 0.01nse + 0.01 ⎠
15
____________________________________________________________________________________
Development and Sensitivity Analysis Report
WQI Designations The index equation generates a number between 1 and 100, with 1 being the poorest and 100 indicating the best water quality. Within this range, designations have been set by CCME (2005) to classify water quality as poor, marginal, fair, good or excellent. These same designations were adopted for the indices developed here. The designations are presented in Table 6.
Table 6: WQI Designations Designation Excellent
Index value 95-100
Good
80-94
Fair
65-79
Marginal
45-64
Poor
0-44
Description All measurements are within objectives virtually all of the time Conditions rarely depart from natural or desirable levels Conditions sometimes depart from natural or desirable levels Conditions often depart from natural or desirable levels Conditions usually depart from natural or desirable levels
In addition to these designations, we have proposed applying treatment levels to each category, that is, the level of treatment required to obtain an adequate level of water quality for human consumption. Without expert opinion and validation the application of treatment levels to the designations is merely subjective and therefore, only included for the purposes of this report in reflecting the potential use of the indices. Validation and expert opinion should be determined before designations are applied, but we would propose applying treatment descriptions to each designation in future development of the index. For example, applying descriptions as to the level of: 1. Removal processes – pre-treatment, flocculation, sedimentation, coagulation and filtration; and 2. Inactivation processes – primary or secondary disinfection. Assigning this type of description to the current designations would be a useful tool for attempting to assess the suitability of the water body under assessment.
Global Water Quality Index The development of the three indices outlined in this report allowed assessment of water quality not only temporally on a station-by-station basis but also spatially across different regions, countries and/or watersheds. GEMS/Water is in a unique position to produce indices of this nature as it is the only UN body dedicated exclusively to global environmental water quality data and assessment. In addition to global assessments, the development of the indices also allows assessment of the GEMStat database in terms of suitability, strengths and limitations of the parameters, as well as highlighting the gaps in data that need to be filled or developed further. The use of the indices also allows for assessment of the suitability of the WHO guidelines, specifically, whether they are too stringent, or, whether additional parameters need to be included that are not assessed by the WHO. ____________________________________________________________________________________
16
Global Drinking Water Quality Index
With this in mind, the following sections focus not only on providing both a regional and watershed assessment of drinking water quality, but also on investigating parameter and/or guideline sensitivity for the purposes of improving the database and/or index calculation. Once all three indices were calculated, they were plotted on a region-by-region basis over time (Figure 1). The index values were calculated as an average per region per year.
Figure 1: Temporal trends in water quality (DWQI, SWQI and AWQI) for the five regions (Africa, Americas, Asia, Europe and Oceania). Data represent annual averages for each region.
Within Europe, the indices show a similar pattern over time, with little deviation from the fair designation. Interestingly, HWQI is consistently lower than AWQI with DWQI falling between the two between the years 1978 to 1994. This would indicate two things. First, the acceptability of water, in terms of clarity, taste or odour, is much better than the quality of water with regards to human health aspects. Second, that DWQI is on the whole an average of the two indices. After 1994, there were improvements in HWQI which drove DWQI upwards, while AWQI stayed the same. It would seem that the water quality in Europe, with regards to acceptability, has been stable with no improvements or decreases over the last 30 years. The pattern of water quality in the Americas and Africa was a little more erratic. In the Americas, DWQI followed HWQI consistently and, apparently, was influenced heavily by health parameters. Similar to Europe, AWQI was higher than the other two indices indicating again that the acceptability of water was much better than the quality of water with regards to human health. Specifically in the year 2000, both the Americas and Africa’s HWQI dropped to the poor designation indicating a severe deterioration in water quality in both regions. However, this was
17
____________________________________________________________________________________
Development and Sensitivity Analysis Report
short-lived as it was closely followed by a recovery to previous or better than previous levels in 2001. Further investigation into the drivers behind this drop is required to understand whether this is real, that is, reflective of the real data, or simply, a reflection of reporting errors or changes in the reporting rate of the parameters of interest in countries in both regions during that one year. In Asia and Oceania, the water quality with respect to human health (HWQI) was consistently lower than AWQI (and DWQI in Oceania). In Asia, the DWQI closely followed HWQI regardless of AWQI, similar to the pattern observed in the Americas suggesting that DWQI is strongly influenced by health parameters rather than acceptability parameters. Following this regional application of the index further analysis of the indices was performed. Firstly, analysis was conducted on each index to determine what, within the equation, was driving the index value. Was it the number of parameters exceeding guidelines, or the magnitude by which they exceeded? Secondly, analysis of the parameters contributing to the index was assessed by determining how many times (reported as a percentage of total exceedances) the parameter exceeded the guideline, and, how well they correlated with the final index value. By assessing the parameters individually we have some indication as to their influence over the final index. In addition, we are also able to assess the suitability of the guideline. If a parameter was consistently in exceedance then maybe the guideline is too stringent. Finally, once these assessments were conducted, a sensitivity analysis was performed to assess each parameters contribution to the final index value for both HWQI and AWQI. These analyses are reported in Chapter 4.
____________________________________________________________________________________
18
Global Drinking Water Quality Index
Chapter 4 Validation and Sensitivity Analysis 1) F1, F2 and F3 Analysis The index equation includes assessment of both extent and magnitude of excursions from the guidelines set by the WHO. By conducting sensitivity analyses we can assess whether the index is driven by how much each parameter exceeds the guideline (F3), how many times it exceeds the guideline (F2) or how many parameters exceed guidelines at each station, depth and year (F1). Firstly, to assess which factor of the equation (F1, F2 or F3) was contributing the most to the overall index, each factor was plotted against each index (Figure 2). Secondly, to assess these relationships statistically, a stepwise regression analysis was performed for each index (Table 7). Regression analysis revealed that for both DWQI and HWQI, F3 was the driving factor (R2 = -0.925, p