Hartmann et al. BMC Cancer 2012, 12:586 http://www.biomedcentral.com/1471-2407/12/586
RESEARCH ARTICLE
Open Access
GLUT1 expression patterns in different Hodgkin lymphoma subtypes and progressively transformed germinal centers Sylvia Hartmann1*, Claudio Agostinelli2, Jürgen Diener3, Claudia Döring1, Stefano Fanti4, Pier Luigi Zinzani5, Andrea Gallamini6, Lothar Bergmann7, Stefano Pileri2 and Martin-Leo Hansmann1
Abstract Background: Increased glycolytic activity is a hallmark of cancer, allowing staging and restaging with 18 F-fluorodeoxyglucose-positron-emission-tomography (PET). Since interim-PET is an important prognostic tool in Hodgkin lymphoma (HL), the aim of this study was to investigate the expression of proteins involved in the regulation of glucose metabolism in the different HL subtypes and their impact on clinical outcome. Methods: Lymph node biopsies from 54 HL cases and reactive lymphoid tissue were stained for glucose transporter 1 (GLUT1), lactate dehydrogenase A (LDHA) and lactate exporter proteins MCT1 and MCT4. In a second series, samples from additional 153 HL cases with available clinical data were stained for GLUT1 and LDHA. Results: Membrane bound GLUT1 expression was frequently observed in the tumor cells of HL (49% of all cases) but showed a broad variety between the different Hodgkin lymphoma subtypes: Nodular sclerosing HL subtype displayed a membrane bound GLUT1 expression in the Hodgkin-and Reed-Sternberg cells in 56% of the cases. However, membrane bound GLUT1 expression was more rarely observed in tumor cells of lymphocyte rich classical HL subtype (30%) or nodular lymphocyte predominant HL subtype (15%). Interestingly, in both of these lymphocyte rich HL subtypes as well as in progressively transformed germinal centers, reactive B cells displayed strong expression of GLUT1. LDHA, acting downstream of glycolysis, was also expressed in 44% of all cases. We evaluated the prognostic value of different GLUT1 and LDHA expression patterns; however, no significant differences in progression free or overall survival were found between patients exhibiting different GLUT1 or LDHA expression patterns. There was no correlation between GLUT1 expression in HRS cells and PET standard uptake values. Conclusions: In a large number of cases, HRS cells in classical HL express high levels of GLUT1 and LDHA indicating glycolytic activity in the tumor cells. Although interim-PET is an important prognostic tool, a predictive value of GLUT1 or LDHA staining of the primary diagnostic biopsy could not be demonstrated. However, we observed GLUT1 expression in progressively transformed germinal centers and hyperplastic follicles, explaining false positive results in PET. Therefore, PET findings suggestive of HL relapse should always be confirmed by histology. Keywords: Hodgkin lymphoma, GLUT1, Glycolysis, Warburg effect
* Correspondence:
[email protected] 1 Senckenberg Institute of Pathology, Goethe University, Frankfurt am Main, Germany Full list of author information is available at the end of the article © 2012 Hartmann et al.; licensee BioMed Central Ltd. This is an Open Access article distributed under the terms of the Creative Commons Attribution License (http://creativecommons.org/licenses/by/2.0), which permits unrestricted use, distribution, and reproduction in any medium, provided the original work is properly cited.
Hartmann et al. BMC Cancer 2012, 12:586 http://www.biomedcentral.com/1471-2407/12/586
Background Hodgkin lymphoma (HL) is a common lymphoma in the Western world. Most individuals affected are adolescents. The tumor cells in HL, the Hodgkin- and Reed-Sternberg (HRS) cells, are derived from germinal center B cells [1], which have lost their B cell phenotype [2]. HRS cells represent only a minority in their reactive microenvironment, which is mainly composed of T cells, epithelioid histiocytes, and eosinophils [3]. Several signaling pathways have been found to be constitutively deregulated in HL including NF-kappaB, JAK-STAT, PI3K-Akt, ERK, AP1, NOTCH1 and receptor tyrosine kinases [4-8]. A hallmark of malignant tumors is the “Warburg effect”—high glucose consumption and increased glycolytic activity [9,10], which occurs as cancer cells shift their metabolism from oxidative phosphorylation to much less efficient glycolysis independent of their oxygen supply [11]. This needs to be compensated by increased glucoseconsumption. High glucose uptake by malignant tumors is the pathophysiologic basis for imaging with 18F-fluorodeoxyglucose (FDG) positron emission tomography (PET). Thus, different PET studies have shown high FDG uptake in HL [12,13]. Interim-PET, accomplished after the first cycles of chemotherapy, has proven to be an important prognostic tool in HL [14-16]. Energy independent glucose uptake into malignant and nonmalignant cells is regulated via the expression of glucose transporter (GLUT) proteins [17,18]. GLUT1 and GLUT3, which are both members of the SLC2A group, have high affinity for glucose [19]. HRS cells were shown to express GLUT1, whereas GLUT3 and Hexokinase II were either not expressed or were only weakly expressed [20,21]. Because a correlation between GLUT1 protein expression in lymphoma cells and FDG uptake in PET scan was recently demonstrated [20-23], we investigated the possibility that GLUT1 expression in HRS cells might also predict clinical behavior. In the cytoplasm, glucose is cleaved by glycolytic enzymes into two molecules of pyruvate and is then transformed into lactate by lactate dehydrogenase (LDH), which is a tetramer composed of two different polypeptide chains, LDHA and LDHB. Whereas LDHA favors the conversion of pyruvate into lactate, LDHB is more efficient in converting lactate into pyruvate [24]. Lactate efflux results via membrane-bound monocarboxylate transporters (MCT) such as MCT1-4. MCT1 and 4 have low affinity for lactate, which makes them ideal export molecules when the metabolite is generated at high levels in the cytoplasm [24]. In the current study, we investigated the expression of GLUT1, LDHA, MCT1 and MCT4 in tumor cells and reactive bystander cells in different HL subtypes and in respect to treatment outcome in a large number of patients. All four proteins would be expected to be highly expressed in cells exhibiting a high level of glucose metabolism, but
Page 2 of 7
with exception of GLUT1, to our knowledge, have not been investigated in Hodgkin lymphoma.
Methods Tissues investigated consisted of paraffin embedded whole tissue sections of normal lymphoid tissue (tonsils) and 54 HL samples obtained from the archive files of the Senckenberg Institute, which were stained for CD20, CD3, CD15, LMP1, GLUT1, LDHA, MCT1 and MCT4 (patient details in Table 1). Routine pre-chemotherapy PET data were available for eight patients. Furthermore, 10 lymph nodes with progressively transformed germinal centers (PTGC) were stained for GLUT1. An additional series of 153 classical HL with available clinical and PET data were obtained from the Hematopathology Section, S. Orsola-Malpighi Hospital, University of Bologna, and stained in triplicate on tissue microarray (TMA) format for GLUT1 and LDHA (patient details in Table 1). All patients underwent pre-chemotherapy PET and Interim PET after the two initial cycles of ABVD. SUVmax values at the biopsy site of pre-chemotherapy PET data were available in 13 patients. All patients were treated with Doxorubicin, Bleomycin, Vinblastine and Dacarbazine (ABVD). Patients underwent 2 or 6 courses of ABVD depending on the disease stage. No treatment change was made based on interim PET scan results. For the pre-chemotherapy PET, a quantitative assessment of FDG uptake was made by calculating the maximum standard uptake value (SUVmax) in a region of interest within the nodal or extranodal site showing the highest intensity of FDG uptake. Immunostainings were performed as previously described [25] and were simultaneously assessed by two pathologists (S.H., M.L.H) on a multi-head microscope. The antibodies and detailed methods are listed in Additional file 1: Table S1. Immunohistochemical stainings and PET scans were reviewed without knowledge of other findings. Informed consent was obtained in accordance with the Declaration of Helsinki and approval was obtained from the ethics committees of the University Hospitals of Frankfurt and Bologna. Statistical analyses were performed using the statistical computing environment R [26]. The data displayed a Gaussian distribution and for pairwise comparisons Fisher's Exact Test was used. Progression free survival (PFS) and overall survival (OS) were estimated according to Kaplan-Meier [27]. PFS was defined as the time from diagnosis to disease progression or death from any cause. OS was defined as the time from diagnosis to death of any cause. Results and discussion Staining patterns in reactive tissue
In reactive tonsils, follicular dendritic cells (FDCs) in the germinal centers as well as interfollicular plasma cells
Hartmann et al. BMC Cancer 2012, 12:586 http://www.biomedcentral.com/1471-2407/12/586
Page 3 of 7
Table 1 Clinical and pathological characteristics of the Hodgkin lymphoma patients studied for GLUT1 and LDHA expression HL cases
Membrane bound GLUT1 expression
Cytoplasmic LDHA expression
N
207
102/207 (49%)
68/153 (44%)
Age, median in years
34
Gender, male (%)
48
Histology -Nodular sclerosis
140
79/140 (56%)
44/97 (45%)
-Mixed cellularity
29
12/29 (41%)
8/22 (36%)
-Lymphocyte-rich
10
3/10 (30%)
3/10 (30%)
-Lymphocyte-depleted
6
6/6 (100%)
4/6 (67%)
-NOS (not classifiable)
9
0/9 (0%)
3/5 (60%)
-Lymphocyte predominant
13
2/13 (15%)
6/13 (46%)
Stage (%) -I
2
- II
89
- III
37
- IV
25
B-Symptoms (%)
46
Bulky disease (%)
32
Interim-PET positive (%)
18
Treatment - ABVD (%)
80
- ABVD + radiation (%)
20
exhibited strong membrane bound expression of GLUT1, whereas small B lymphocytes in the mantle zone showed moderate GLUT1 expression in all cases (Figure 1a,b). Additionally, few interfollicular blasts, as well as basal layers of squamous epithelium showed membrane bound GLUT1 expression. No GLUT1 expression was observed in CD3-positive lymphocytes in T cell areas. B cells in the enlarged mantle zone in PTGC showed moderate GLUT1 expression, which may explain false positive results in PET imaging [28,29]. LDHA was expressed in most germinal center blasts, whereas interfollicular areas remained negative. Membrane bound MCT1 expression was found in very few germinal center blasts and basal squamous epithelial layers. Interfollicular areas did not stain for MCT1. Following a pattern similar to GLUT1, MCT4 was expressed by FDCs in the germinal centers, but was not expressed in the mantle zones. Additionally, basal squamous epithelial layers exhibited membrane bound MCT4 expression. GLUT1 expression in HL
Membrane bound GLUT1 expression was observed on HRS cells in 102 of 207 HL cases (49%, Figure 1, Table 1). Whereas membrane bound GLUT1 expression was observed more frequently in lymphocyte depleted HL
(LDCHL,100%), nodular sclerosing HL (NSCHL, 56%) and mixed cellularity HL (MCCHL, 41%), membrane bound GLUT1 expression was observed in only 15% of nodular lymphocyte predominant HL (NLPHL) and in 30% of lymphocyte rich classical HL (LRCHL). This is in line with the study by Khandani et al. [20] in which no GLUT1 expression was found in the LP cells in two NLPHL investigated, whereas GLUT1 expression was observed in three NSCHL. Shim et al. [21] found expression of GLUT1 in 10 to 90% of HRS cells in four classical HL, including one LDCHL, one NSCHL and two MCCHL; the highest rate was observed in the NSCHL and the lowest rate in the LDCHL. Glucose uptake and metabolism in the tumor cells may, therefore, be less important in LP cells of NLPHL than in HRS cells of classical HL, as suggested by Hutchings et al., who, in a PET study, found significantly lower standardized glucose uptake values in NLPHL than in classical HL [13]. Nonetheless, a different study showed that staging by PET scan is applicable in NLPHL [30]. We observed GLUT1 expression in the reactive B cell infiltrate in lymphocyte rich HL subtypes (Figure 1f), while the T cell dominated areas were GLUT1-negative. If membrane bound GLUT1 expression was observed in the HRS cells, then GLUT1 was present in almost 100% of the tumor cells regardless of the localization of the HRS cells in the
Hartmann et al. BMC Cancer 2012, 12:586 http://www.biomedcentral.com/1471-2407/12/586
Page 4 of 7
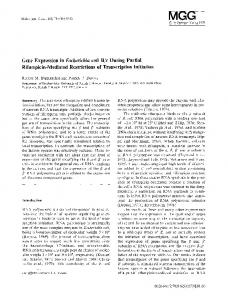
Figure 1 GLUT1 immunostaining. a, b. Reactive germinal centers showing membrane bound GLUT1 expression in follicular dendritic cells. c. GLUT1 expression in the enlarged mantle zone of a progressively transformed germinal center. d. NSCHL with membrane bound GLUT1 expression by the HRS cells. e. NSCHL with granular cytoplasmic expression of GLUT1 by the HRS cells. f. NLPHL with GLUT1 expression in the reactive B cells, but no GLUT1 expression in the LP cells.
tissue. This indicates that HRS cells themselves possibly contribute to the PET positivity of HL in these cases via their GLUT1 expression, although the tumor cells may be a minority in the infiltrate. On the other hand, PET positivity of NLPHL is likely due to the strong glucose uptake in the reactive B cells. We then asked if different patterns of GLUT1 expression (negative, cytoplasmic or membrane bound) in the primary biopsy had predictive value regarding progression free survival and overall survival. However, we found no significant prognostic value of the different GLUT1 staining patterns (Additional file 2: Figure S1), in contrast to the powerful prognostic tool of interim-PET [16] and in contrast to the prognostic impact of GLUT1 expression found in other cancer types [31,32]. We also evaluated the
possibility that different patterns of GLUT1 expression could predict the interim-PET result. However, no significant association between the number of interim-PET positive cases and the pattern of GLUT1 staining was found (Fisher's Exact Test, p = 0.6). SUVmax values of pre-chemotherapy PET scans were available for eight patients of the first series (stained on full sections) and for 13 patients of the second series (stained on TMA format). SUVmax values in the first series were low to moderate (range 2.55 – 12.8), and a tendency, albeit not significant, toward higher SUVmax values in cases with membrane bound GLUT1 expression was observed in the first series (Additional file 3: Figure S2). In the second series the SUVmax values were generally higher (range 4.1 – 18.9), but in this series, no
Hartmann et al. BMC Cancer 2012, 12:586 http://www.biomedcentral.com/1471-2407/12/586
correlation between GLUT1 staining results and SUVmax values was observed. This may be simply a consequence of the low number of cases with available pre-chemotherapy PET data in either series. As well, immunohistochemical staining on TMA may not be comparable to staining of full sections. There may be different mechanisms of glucose uptake, not only in the tumor cells, but also in the reactive bystander cells. Potential alternative transporters like GLUT3 and GLUT4 [33] were not investigated in the present study. However, Khandani et al. [20] observed GLUT3 expression in approximately 20% of the cells in the microenvironment. It is possible, therefore, that different mechanisms of glucose uptake, e.g., via GLUT1 in HRS cells and via GLUT3 in the microenvironment, contribute to PET positivity of the tumor. Expression of LDHA and lactate transporter proteins in HL
Since membrane bound expression of GLUT1 suggests increased glycolysis, the expression levels of LDHA, an enzyme acting downstream of glycolysis, and of two lactate transporters were investigated in the same HL cases. Cytoplasmic LDHA expression was observed in a 68 out of 153 HL cases (44%, Table 1, Figure 2), with the highest number of positive cases in the LDCHL subtype (67%). However, no significant differences were observed with respect to progression free survival and overall survival (Additional file 2: Figure S1). This was somewhat surprising
Page 5 of 7
because high serum LDH levels are known to be an adverse prognostic factor for Hodgkin lymphoma patients [34]. As lactate must finally be exported from the cell, the expression of two transporter proteins for lactate and pyruvate, MCT1 and MCT4, were investigated in the first series of cases. Compared to the number of cases expressing GLUT1 and/or LDHA, only a few cases exhibited membrane bound MCT1 or MCT4 expression (Figure 2). MCT4 was expressed by tumor cells in 10 of 54 HL cases (19%). Cases that did not show MCT4 expression by tumor cells exhibited MCT4 expression in macrophages and epithelioid cells. Membrane bound expression of MCT1 was observed in 13 of 54 HL cases (24%). Cytoplasmic as well as nuclear MCT1 expression occurred in 13 (24%) and 4 cases (7%), respectively (Figure 2). There have been conflicting data regarding the expression of MCT1 and MCT4 in cancer. These were expressed in only few cases in the present study. Similar to our observations, an inverse correlation of GLUT1 and MCT1 expression was described in colonic cancer [35]. Thus, lactate efflux appears to only play a minor role in classical HL, possibly because the dumping of excess carbon as lactate allows more rapid incorporation of carbon into biomass.
Conclusions We observed GLUT1 and/or LDHA expression in the HRS cells of a large number of classical HL cases
Figure 2 LDHA, MCT4 and MCT1 immunostainings. a. NSCHL with strong cytoplasmic LDHA staining in the HRS cells. b. NLPHL with membrane bound expression of MCT4 in the LP cells. c. NSCHL with membrane bound expression of MCT1 in the HRS cells. d. LRCHL with nuclear staining for MCT1 in the HRS cells.
Hartmann et al. BMC Cancer 2012, 12:586 http://www.biomedcentral.com/1471-2407/12/586
indicating high glycolytic activity of the tumor cells. Nevertheless, the expression pattern of these proteins did not predict prognosis or survival, nor did it correlate with interim-PET results. Powerful prognostic tools like interim-PET cannot, therefore, be replaced by applying these immunohistochemical stainings. However, we also observed GLUT1 expression in progressively transformed germinal centers and hyperplastic follicles, which can explain false positive results in PET. Therefore, PET findings suggestive of HL relapse should always be confirmed by histology.
Additional files Additional file 1: Table S1. Antibodies, dilutions, suppliers and detection systems used in the present study. Additional file 2: Figure S1. Kaplan-meier Analysis of GLUT1 and LDHA expression as well as Interim PET. a. Kaplan-Meier Analysis of different GLUT1 expression patterns (overall survival). b. Kaplan-Meier Analysis of different GLUT1 expression patterns (progression free survival). c. Kaplan-Meier Analysis of LDHA expression (overall survival). d. KaplanMeier Analysis of LDHA expression (progression free survival). e. KaplanMeier-Analysis of Interim-PET-positive and -negative cases (overall survival). f. Kaplan-Meier-Analysis of Interim-PET-positive and -negative cases (progression free survival). Additional file 3: Figure S2. SUVmax in different GLUT1 expression patterns. a. Prechemotheraphy SUVmax values in 8 patients of the first series stained on full sections. b. Prechemotheraphy SUVmax values in 13 patients of the second series stained on TMA format.
Competing interests The authors report no potential conflict of interest.
Authors' contributions SH: Immunostainings, histological evaluation, analysis and interpretation of data, drafting the manuscript; CA: acquisition of patients and clinical data, pathologic review, TMA construction, JD, SF: performance and interpretation of PET scans; CD: statistical analysis of the data, LB, PLZ, AG: acquisition and interpretation of clinical data of patients; SAP: acquisition of patients and clinical data, pathologic review, MLH: histological evaluation, experimental design, revising the manuscript. All authors read and approved the final manuscript.
Acknowledgements The authors would like to thank Christiane Wenk, Yvonne Michel, and Ralf Lieberz for excellent technical assistance. Author details 1 Senckenberg Institute of Pathology, Goethe University, Frankfurt am Main, Germany. 2Department of Haematology and Oncological Sciences “L. and A. Seràgnoli”, Haematopathology Section, S. Orsola-Malpighi Hospital, University of Bologna, Bologna, Italy. 3Department of Nuclear Medicine, Goethe University, Frankfurt am Main, Germany. 4Department of Nuclear Medicine, Policlinico Sant’Orsola-Malpighi, Bologna University, Via Massarenti 9, Bologna 40138, Italy. 5Institute of Hematology and Medical Oncology L. e A. Seràgnoli, Policlinico Sant'Orsola-Malpighi, University of Bologna, Bologna, Italy. 6 Hematology Department and BMT Unit, Azienda Ospedaliera S. Croce e Carle, Cuneo, Italy. 7Department of Haematology, Goethe University, Frankfurt am Main, Germany. Received: 21 July 2012 Accepted: 2 December 2012 Published: 10 December 2012
Page 6 of 7
References 1. Küppers R, Rajewsky K, Zhao M, Simons G, Laumann R, Fischer R, et al: Hodgkin disease: Hodgkin and reed-Sternberg cells picked from histological sections show clonal immunoglobulin gene rearrangements and appear to be derived from B cells at various stages of development. Proc Natl Acad Sci USA 1994, 91:10962–10966. 2. Schwering I, Bräuninger A, Klein U, Jungnickel B, Tinguely M, Diehl V, et al: Loss of the B-lineage-specific gene expression program in Hodgkin and reed-Sternberg cells of Hodgkin lymphoma. Blood 2003, 101:1505–1512. 3. Swerdlow SH, International Agency for Research on Cancer: World Health Organization. WHO classification of tumours of haematopoietic and lymphoid tissues. 4th edition. Lyon, France: International Agency for Research on Cancer; 2008. 4. Mathas S, Lietz A, Janz M, Hinz M, Jundt F, Scheidereit C, et al: Inhibition of NF-kappaB essentially contributes to arsenic-induced apoptosis. Blood 2003, 102:1028–1034. 5. Dutton A, Reynolds GM, Dawson CW, Young LS, Murray PG: Constitutive activation of phosphatidyl-inositide 3 kinase contributes to the survival of Hodgkin's lymphoma cells through a mechanism involving Akt kinase and mTOR. J Pathol 2005, 205:498–506. 6. Jundt F, Anagnostopoulos I, Forster R, Mathas S, Stein H, Dorken B: Activated Notch1 signaling promotes tumor cell proliferation and survival in Hodgkin and anaplastic large cell lymphoma. Blood 2002, 99:3398–3403. 7. Emmerich F, Meiser M, Hummel M, Demel G, Foss HD, Jundt F, et al: Overexpression of I kappa B alpha without inhibition of NF-kappaB activity and mutations in the I kappa B alpha gene in Reed-Sternberg cells. Blood 1999, 94:3129–3134. 8. Skinnider BF, Elia AJ, Gascoyne RD, Patterson B, Trümper L, Kapp U, et al: Signal transducer and activator of transcription 6 is frequently activated in Hodgkin and Reed-Sternberg cells of Hodgkin lymphoma. Blood 2002, 99:618–626. 9. Warburg O: Origin of cancer cells. Oncologia 1956, 9:75–83. 10. Ward PS, Thompson CB: Metabolic reprogramming: a cancer hallmark even warburg did not anticipate. Cancer Cell 2012, 21:297–308. 11. Gatenby RA, Gillies RJ: Why do cancers have high aerobic glycolysis? Nat Rev Cancer 2004, 4:891–899. 12. Hueltenschmidt B, Sautter-Bihl ML, Lang O, Maul FD, Fischer J, Mergenthaler HG, et al: Whole body positron emission tomography in the treatment of Hodgkin disease. Cancer 2001, 91:302–310. 13. Hutchings M, Loft A, Hansen M, Ralfkiaer E, Specht L: Different histopathological subtypes of Hodgkin lymphoma show significantly different levels of FDG uptake. Hematol Oncol 2006, 24:146–150. 14. Le Roux PY, Gastinne T, Le Gouill S, Nowak E, Bodet-Milin C, Querellou S, et al: Prognostic value of interim FDG PET/CT in Hodgkin's lymphoma patients treated with interim response-adapted strategy: comparison of International Harmonization Project (IHP), Gallamini and London criteria. Eur J Nucl Med Mol Imaging 2011, 38:1064–1071. 15. Gallamini A, O'Doherty M: Report of satellite workshop on interim-PET in Hodgkin lymphoma: 8th international symposium on Hodgkin lymphoma, cologne, 23 October 2010. Leuk Lymphoma 2011, 52:583–586. 16. Meignan M, Gallamini A, Itti E, Barrington S, Haioun C, Polliack A: Report on the Third International Workshop on Interim Positron Emission Tomography in Lymphoma held in Menton, France, 26-27 September 2011 and Menton 2011 consensus. Leuk Lymphoma 2012, 53(10):1876–1881. doi:10.3109/10428194.2012.677535. Epub 2012 Apr 23. PMID: 22432519. 17. Brown RS, Wahl RL: Overexpression of Glut-1 glucose transporter in human breast cancer. An immunohistochemical study. Cancer 1993, 72:2979–2985. 18. Cantuaria G, Fagotti A, Ferrandina G, Magalhaes A, Nadji M, Angioli R, et al: GLUT-1 expression in ovarian carcinoma: association with survival and response to chemotherapy. Cancer 2001, 92:1144–1150. 19. Uldry M, Thorens B: The SLC2 family of facilitated hexose and polyol transporters. Pflugers Arch 2004, 447:480–489. 20. Khandani AH, Dunphy CH, Meteesatien P, Dufault DL, Ivanovic M, Shea TC: Glut1 and Glut3 expression in lymphoma and their association with tumor intensity on 18F-fluorodeoxyglucose positron emission tomography. Nucl Med Commun 2009, 30:594–601. 21. Shim HK, Lee WW, Park SY, Kim H, Kim SE: Relationship between FDG uptake and expressions of glucose transporter type 1, type 3, and
Hartmann et al. BMC Cancer 2012, 12:586 http://www.biomedcentral.com/1471-2407/12/586
22.
23.
24.
25.
26.
27. 28.
29.
30.
31.
32.
33.
34.
35.
Page 7 of 7
hexokinase-II in Reed-Sternberg cells of Hodgkin lymphoma. Oncol Res 2009, 17:331–337. Shim HK, Lee WW, Park SY, Kim H, So Y, Kim SE: Expressions of glucose transporter Types 1 and 3 and hexokinase-II in diffuse large B-cell lymphoma and other B-cell non-Hodgkin's lymphomas. Nucl Med Biol 2009, 36:191–197. Kaira K, Abe M, Nakagawa K, Ohde Y, Okumura T, Takahashi T, Murakami H, Shukuya T, Kenmotsu H, Naito T, Hayashi I, Oriuchi N, Endo M, Kondo H, Nakajima T, Yamamoto N: 18F-FDG uptake on PET in primary mediastinal non-thymic neoplasm: a clinicopathological study. Eur J Radiol 2012, 81(9):2423–2429. Epub 2011 Nov 4. PMID: 22055682. Ganapathy V, Thangaraju M, Prasad PD: Nutrient transporters in cancer: relevance to Warburg hypothesis and beyond. Pharmacol Ther 2009, 121:29–40. Renné C, Willenbrock K, Küppers R, Hansmann M-L, Bräuninger A: Autocrine and paracrine activated receptor tyrosine kinases in classical Hodgkin lymphoma. Blood 2005, 105:4051–4059. R Development Core Team: R: A Language and Environment for Statistical Computing. Vienna, Austria: R Foundation for Statistical Computing; 2012. ISBN 3-900051-07-0. Kaplan ELMP: Nonparametric estimation from incomplete observations. J Am Stat Assoc 1958, 53:457–481. Grigg A, Ganju V: PET positive progressive transformation of germinal centers masquerading as relapsed Hodgkin lymphoma post-autograft. Leuk Lymphoma 2006, 47:764–765. Levine JM, Weiner M, Kelly KM: Routine use of PET scans after completion of therapy in pediatric Hodgkin disease results in a high false positive rate. J Pediatr Hematol Oncol 2006, 28:711–714. Ansquer C, Hervouet T, Devillers A, de Guibert S, Gastinne T, Le Gouill S, et al: 18-F FDG-PET in the staging of lymphocyte-predominant Hodgkin's disease. Haematologica 2008, 93:128–131. Tohma T, Okazumi S, Makino H, Cho A, Mochizuki R, Shuto K, et al: Overexpression of glucose transporter 1 in esophageal squamous cell carcinomas: a marker for poor prognosis. Dis Esophagus 2005, 18:185–189. Mori Y, Tsukinoki K, Yasuda M, Miyazawa M, Kaneko A, Watanabe Y: Glucose transporter type 1 expression are associated with poor prognosis in patients with salivary gland tumors. Oral Oncol 2007, 43:563–569. Maratou E, Dimitriadis G, Kollias A, Boutati E, Lambadiari V, Mitrou P, et al: Glucose transporter expression on the plasma membrane of resting and activated white blood cells. Eur J Clin Invest 2007, 37:282–290. Itoh K, Kinoshita T, Watanabe T, Yoshimura K, Okamoto R, Chou T, et al: Prognostic analysis and a new risk model for Hodgkin lymphoma in Japan. Int J Hematol 2010, 91:446–455. Lambert DW, Wood IS, Ellis A, Shirazi-Beechey SP: Molecular changes in the expression of human colonic nutrient transporters during the transition from normality to malignancy. Br J Cancer 2002, 86:1262–1269.
doi:10.1186/1471-2407-12-586 Cite this article as: Hartmann et al.: GLUT1 expression patterns in different Hodgkin lymphoma subtypes and progressively transformed germinal centers. BMC Cancer 2012 12:586.
Submit your next manuscript to BioMed Central and take full advantage of: • Convenient online submission • Thorough peer review • No space constraints or color figure charges • Immediate publication on acceptance • Inclusion in PubMed, CAS, Scopus and Google Scholar • Research which is freely available for redistribution Submit your manuscript at www.biomedcentral.com/submit