RESEARCH ARTICLE
Good Samaritans in Networks: An Experiment on How Networks Influence Egalitarian Sharing and the Evolution of Inequality Yen-Sheng Chiang* Department of Sociology, The Chinese University of Hong Kong, Hong Kong, China *
[email protected]
Abstract
OPEN ACCESS Citation: Chiang Y-S (2015) Good Samaritans in Networks: An Experiment on How Networks Influence Egalitarian Sharing and the Evolution of Inequality. PLoS ONE 10(6): e0128777. doi:10.1371/journal. pone.0128777
The fact that the more resourceful people are sharing with the poor to mitigate inequality— egalitarian sharing—is well documented in the behavioral science research. How inequality evolves as a result of egalitarian sharing is determined by the structure of “who gives whom”. While most prior experimental research investigates allocation of resources in dyads and groups, the paper extends the research of egalitarian sharing to networks for a more generalized structure of social interaction. An agent-based model is proposed to predict how actors, linked in networks, share their incomes with neighbors. A laboratory experiment with human subjects further shows that income distributions evolve to different states in different network topologies. Inequality is significantly reduced in networks where the very rich and the very poor are connected so that income discrepancy is salient enough to motivate the rich to share their incomes with the poor. The study suggests that social networks make a difference in how egalitarian sharing influences the evolution of inequality.
Academic Editor: Matjaz Perc, University of Maribor, SLOVENIA Received: February 26, 2015 Accepted: April 30, 2015 Published: June 10, 2015 Copyright: © 2015 Yen-Sheng Chiang. This is an open access article distributed under the terms of the Creative Commons Attribution License, which permits unrestricted use, distribution, and reproduction in any medium, provided the original author and source are credited. Data Availability Statement: All relevant data are within the paper and its Supporting Information files. Funding: The project is supported by the start-up fund provided by the Department of Sociology at the University of California in Irvine. Competing Interests: The author has declared that no competing interests exist.
Introduction The proliferation of research in the behavioral sciences of the past decade has provided strong evidence to the human nature of aversion to economic inequality and the propensity to care for the economic disadvantaged. Experimental studies show that from children to adults people share valuable goods with unrelated others [1–7] and take costly action to correct unfair divisions of resources between strangers from which they claim no benefits [8–10]. These studies suggest that facing unequal distributions people are willing to sacrifice their own benefits to help the economic disadvantaged—an action termed egalitarian sharing [1,11–14], although egalitarianism is far from the only guiding principle of human behavior, as people are also found to choose utilitarian options that maximize group welfare over egalitarian divisions of resources [15–16]. Most of the experimental research on egalitarian sharing investigates the division of resources in a dyad, in which a person interacts with an alter, or a complete group, wherein actors interact with one another. Social interaction, however, could take a different form than dyads and groups. In fact, many social activities are carried out in networks—a more generalized
PLOS ONE | DOI:10.1371/journal.pone.0128777 June 10, 2015
1 / 13
An Experiment on Egalitarian Sharing in Networks
structure of social interaction, of which dyads and complete groups are two special cases. Network is not only more representative of how social connections are structured, but is also an important mechanism for the emergence of social behavior, such as cooperation and influence [17–20]. Yet, in the literature little do we know how network structure influences the behavior of egalitarian sharing and how inequality evolves in networks. Social networks play an important role in the assessment of income inequality. The study of social comparison in social psychology indicates that people tend to select particular referents to compare their well-being with [21–23]. Accordingly, scholars have long proposed a network approach to understanding the choices of referents in social evaluation [24]. Network influences not only how social referents are chosen, but also how kindness and generosity flow. Different forms of social supports, such as food sharing, are provided through social networks [25–26]. Economic aids provided by microcredit finances, for example, are mobilized mainly through interpersonal networks [27–28]. These examples suggest that network influences the extent to which inequality is perceived, as well as how altruistic giving is distributed to the needy. We present an experimental study to investigate how actors share incomes with neighbors in some stylized networks. The result shows that income distribution evolves differently across networks. People’s behavior of sharing is driven by some factors related to the distributions they are exposed to, but the factors are activated of different extents in different networks, explaining in part why there is a difference across networks in how inequality evolves.
Egalitarian Sharing in Networks The scenario (or a game) we depict for studying egalitarian sharing in networks can be described as follows. Consider a group of actors, each of which is given an income and linked to a set of others in the group. The network that governs people’s interaction is fixed. In each round of the game, actors view the income distribution of their network neighbors—those linked to them—and decide whether to give money to neighbors. Actors’ incomes are modified whenever they give or receive money from others. The game continues until no one gives. Understanding how egalitarian sharing is practiced and in turn how income distribution evolves in the game requires considerations of an array of factors that can be summarized in the following two inquiries: What motivates people to share? And whom would they share with? When actors are placed in a network, the income distribution of their network neighbors is what they are exposed to. Prior research in the economic behavioral sciences has provided insights into how altruistic sharing is influenced by properties related to the distribution itself and the position that allocators take in the distribution. First, behavioral economists found that aversion to inequality is a propellant of prosocial behavior [12, 29]. Larger income discrepancy is expected to trigger more sharing of income. Second, income status could influence the decision. Psychological research found that social status is associated with altruism. An actor who occupies a higher position in the distribution may be more [30] or less [31] motivated to share his/her income with the poor. Thirdly, how many recipients an actor is exposed to could make a difference. A recent study shows that people’s altruism varies with the number of recipients. A person may feel more motivated to give when there are more recipients available [32]. Network not only influences a person’s motive of giving, it also determines the pool of potential recipients. Research evidence suggests that the probability of receiving donation is a function of economic status: the poorer a person is, the more likely s/he would receive giving from others [3, 33]. On the other hand, altruism can be congestible in the sense that similarly poor people are poised to compete for giving from the same giver [32]. The probability of
PLOS ONE | DOI:10.1371/journal.pone.0128777 June 10, 2015
2 / 13
An Experiment on Egalitarian Sharing in Networks
receiving giving, therefore, is not only determined by the recipient’s income level, but is also contingent on how many other similarly poor people are competing for the giving. Givers, on the other hand, could choose different forms to allocate their giving. For example, they could evenly divide the giving to a set of similarly poor people or could randomly select one of them to concentrate their giving. It remains an empirical question how giving would be allocated. Furthermore, giving does not necessarily come from the rich to the poor per se. Earlier research evidence has found incidents of reverse redistribution; i.e., donation goes along the opposite direction from the poor to the rich [2]. Despite being rare, reverse redistribution can be caused by different motives. One of the drivers is reciprocity: people express their gratitude for receiving donation from others by giving money in return even though that the recipients may have higher incomes than they do. In addition, reverse redistribution can be attributed to a desire not to be the poorest person: the poor may choose to give to the rich, but not those poorer than they are, out the fear that their giving to the poorer may make them the poorest in the distribution [34]. While prior research provides useful guidance to predicting how egalitarian sharing unfolds for an income distribution, the overall effect would be determined by network topology, which delineates the different (local) income distributions that each actor would face in his neighborhood. Tracking the dynamics of income distribution as a result of egalitarian sharing in networks is extremely difficult by intuitive reasoning. To the challenge, we draw on an agentbased model to derive some theoretical predictions. Details of the model are reported in the online supporting materials (S2 File). As can be found there, while the evolution of income distributions is influenced by a multitude of factors pertaining to individual’s sharing behavior, the effects of these factors vary across network topologies.
The Experiment Experiment Design Income Distribution. Each actor is given an income in the beginning. Incomes are uniformly distributed (min = 10 and max = 200) over a group of 25 actors, shown by the numbers in each node of the network in Fig 1. Network Topologies. We choose four network topologies that are well studied in network science. For the first two networks, lattices, ties are equally distributed across nodes: each actor is linked to four neighboring others along a circle [35]. For the other two networks, Scale Free Networks (SF), ties are unevenly distributed—while a small number of people are well connected, the remaining are sparsely connected [36]. Owing to their unique structural properties, the two types of networks have proved to influence the emergence of many kinds of social behavior [37–38]. They are selected here for another reason: previous work shows that the number of ties a node has—nodal degree—influences the perception of distributional inequality [39]. Because Lattice and SF networks take opposite positions in the distribution of nodal degree, implementation of the two types of networks allows us to investigate how inequality in the distribution of network ties influences egalitarian sharing. Within the first network type, lattice, we make a distinction by how incomes are assorted in network. People can be linked with others with little or large difference in incomes—homophily vs. heterophily [40]. In homophilous (heterophilous) networks, an actor’s income would be less (more) different from his neighbors than non-neighbors. The difference between homophily and heterophily is expected to generate different perceptions of local income inequality and mobilize different amounts of giving. Within the second network type (SF), where ties are unevenly distributed, we make a distinction by how nodal degree and income level are related. Richer people could be more or less
PLOS ONE | DOI:10.1371/journal.pone.0128777 June 10, 2015
3 / 13
An Experiment on Egalitarian Sharing in Networks
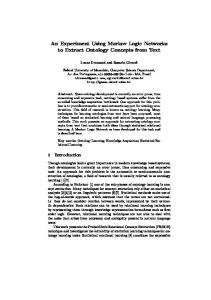
Fig 1. The four network topologies. (a) Lattice_Hetero: actors with discrepant income levels are linked in a lattice, where each node has the same number of ties. (b) Lattice_Homo: actors with similar income levels are linked in a lattice, where each node has the same number of ties. (c) SF_Negative: income levels and nodal degrees are negatively associated in a network where ties are unevenly distributed across nodes. (d) SF_Positive: income levels and nodal degrees are positively associated in a network where ties are unevenly distributed across nodes. Numbers within each node represent income levels. Darker colors refer to higher incomes. doi:10.1371/journal.pone.0128777.g001
linked than the poor in network [41–42]. We simulate the two conditions by relating nodal degree to income level positively and negatively respectively. Fig 1 presents the four network topologies. Details of the generation of the four networks are provided in the online supporting material (S1 File). The four networks are identical in network density, allowing us to investigate how structure rather than the amount of ties influences egalitarian sharing and the evolution of inequality. We also consider a fully saturated network (not shown in the Figure) to represent that everyone is linked to all others in the group. A total of five network topologies are investigated.
Experimental Procedure A total of 162 undergraduate students of a public university in southern California of the U.S were recruited to participate in the experiment using monetary payoff as incentive. The
PLOS ONE | DOI:10.1371/journal.pone.0128777 June 10, 2015
4 / 13
An Experiment on Egalitarian Sharing in Networks
experiment was approved by the university IRB (HS#2011–8378). Participants were recruited by a social science experimental laboratory of the university and were allocated to seven sessions. We customized our experiment to accommodate any number of participants that would show up in a session. We worked to recruit 25 participants for each session; however, fewer participants than expected turned out in the last two sessions. For the two sessions with fewer participants, the experiments were run on smaller networks (19 and 18 nodes respectively); except for this difference, every other experiment condition was kept the same as the normal experiment with n = 25. The generation of the slightly smaller networks is following the same mechanism detailed in the online supporting materials. We adopt a within-subject design: in each session, all participants went through five trials, each of which implemented one of the five network topologies (or treatment). The order of the five network trials in a session was randomized. At the end of each session, a network trial was chosen by lottery and participants were paid in proportion to their income levels at the final round of the chosen trial [43]. The experiment was held at a social science laboratory on campus. Participants were seated in individual cubicles and interacted with others through Internets using the pseudo-identities we provided. We customized a web-based experiment program to operate the experiment. We read out the instruction to participants before the experiment began (the instruction sheet provided in S3 File). In the beginning of an experiment trial, participants were given an income as was specified in Fig 1. Incomes were represented by tokens and participants were told that the tokens were redeemable to money. In each round, the experiment identities of each person’s network neighbors and their current token balances were shown on the screen. If an individual would like to donate token(s) to a network neighbor, s/he could put a number in the box designated for the recipient neighbor. Our program would block illegal inputs, such as symbols, non-integers or negative integers. Shall an illegal input occur, a warning message would pop up and request the subject to input a new donation if s/he wants. The default amount of donation is set to zero so if a person does not input any number, nothing will be donated. The participants were not allowed to give more than they currently had. Each person has sufficient time (40 seconds) to make a decision of giving in each round. The game moves to the next round when all participants have made their decisions or when the time expires. The game stops under two circumstances: either when no one gives, or the game finishes the 10th round. The former condition is an ideal stopping rule, but to prevent the game from proceeding too long, we imposed a compulsory stopping time at round 10 if the experiment fails to stop by then. The participants were informed of the first stopping rule, but did not know of the compulsory stopping rule set at round 10. Participants were paid individually at the end of the experiment. The payoff includes a show-up fee (US$7), plus the token balance in the last round of the chosen trial. On average, a participant received $12.25 from the experiment.
Experiment Result A total of 35 experiment trials (7 sessions × 5 trials) were run. Four of them encountered unexpected software problems in the middle of the experiment. The failed trials were not included in the analysis. Inter-temporal Distribution of Giving. S7and S8 Figs present the records of giving over time. About half of the participants donated money in the early period of the experiment. The proportion drops to around 20% by round 10. On average, people donated 5.4% of their incomes in the beginning, and the percentage falls to 2.6% by round 10. In 7 of the 31 experiment trials that were successfully run (22%), all participants stopped giving before round 10.
PLOS ONE | DOI:10.1371/journal.pone.0128777 June 10, 2015
5 / 13
An Experiment on Egalitarian Sharing in Networks
Fig 2. Inequalities of the end-round distributions measured by the Gini coefficient for each network treatment. The segments represent the 95% confidence interval. The vertical dotted line shows the inequality level of the original distribution. doi:10.1371/journal.pone.0128777.g002
End-Round Inequality. Our primary objective is to compare income distributions in the initial and the final round of the experiment to see whether inequality improves or not. Fig 2 presents the distribution of inequality levels measured by the Gini coefficient for each network treatment. We calculate the Gini coefficient of the end-round distribution for each session. Using session as the unit of analysis, we compare the initial and the end-round Gini coefficients by running the Wilcoxon Signed Rank test (for more details, please see S4 File). The test shows that the Gini coefficient of the end-round distribution is lower than the original income distribution in the Lattice_Hetero and the SF_Negative network treatment (W = 0, p = 0.01 and W = 0, p = 0.03), but not in the other three network treatments (W = 5; p = 0.31 for Full; W = 15; p = 0.44 for Lattice_Homo and W = 14; p = 0.56 for SF_Positive). The finding shows a difference in the reduction of inequality across the five network treatments. Why is there such a difference? We attempt to seek the answer by looking into subjects’ behavior of sharing in the experiment. As would be shown, the two networks found to
PLOS ONE | DOI:10.1371/journal.pone.0128777 June 10, 2015
6 / 13
An Experiment on Egalitarian Sharing in Networks
experience a significant reduction of inequality actually performed differently from others in triggering actors’ egalitarian sharing in the experiment. Individuals’ Behavior. In reference to the discussion in section 2, here we consider a list of variables that are suspected to trigger subjects’ sharing of incomes: Actor i’s income (Xi,t) and nodal degree (Ki); the ranking of actor i (Ri,t) and the inequality level (Li,t) of the income distribution in actor i’s network neighborhood. The subscript t (time) denotes that the variable is endogenous and subject to change in each round. Actor i’s income level at time t (Xi,t) is bound between 0 and the sum of all actors’ incomes. Income ranking (Ri,t) is the position that actor i takes in the sequence, ordered from low to high, of the incomes of actor i’s and his network neighbors. We normalize the ranking by dividing it by the length of the sequence so that Ri,t would be bound between 0 and 1. Local inequality (Li,t) is the Gini coefficient of the income distributions of actor i and his neighbors. Nodal degree (Ki) is the number of ties linked to actor i. The variables, Xi,t, Ri,t and Li,t, represent perception of inequality of different levels [39]: Xi,t is actor i’s own income; Ri,t is a comparison of i’s income with others’, and Li,t extends the comparison to all neighbors, which takes into account the income difference among one another in the neighborhood. Egalitarian sharing is possible to be triggered by the three different perspectives to inequality. Theoretical predictions of how the variables above determine the evolution of incomes in different networks can be found in the online supporting materials, assuming that these factors take effect. Yet, whether these factors significantly influence participants’ decision-making of giving in each round remain an empirical question. To the question, I use a Hurdle regression model to assess the effects of these factors. In the Hurdle regression, the probability and the amount of giving are assessed separately and the latter is estimated only when the former passes a threshold [3, 44]. In our within-subject design, the decisions of giving are not independent so standard errors of the regression coefficients are clustered within subjects in the following analysis. Tables 1 and 2 shows the Hurdle regression result on participants’ giving in each round. The variables perform differently across networks. Notably, the two networks, Lattice_Hetero and the SF_Negative, differ from other networks in local inequality (L): both the coefficients are positive in estimating the probability and the amount of giving, suggesting that high local inequality would prompt a person to give more in the two networks, but not in others. As can be found in the online supporting materials, a positive coefficient of local inequality (Li,t) contributes to the mitigation of inequality. It explains in part why inequality can improve more profoundly in the two networks.
Table 1. Hurdle Regression Model on Giving Decisions (Probability of Giving). Networks Full Income Level (X)
0.006
Income Ranking (R)
-2.27*
Local Inequality (L)
6.44
Nodal Degree (K)
-0.08
Lattice_Hetero
Lattice_Homo
SF_Negative
SF_Positive
-0.01**
0.002
-0.004
0.005
1.28*
-0.68
0.80
1.45*
4.28***
1.36
4.64***
N/A
N/A
0.09*
1.26 -0.0006
Note: *** p