2010 12th International Asia-Pacific Web Conference
Graph-based Recommendation on Social Networks
Ziqi Wang, Yuwei Tan, Ming Zhang School of Electronics Engineering and Computer Science Peking University Beijing, P.R.China
[email protected],
[email protected],
[email protected] platform on which people can share their views, opinions, experiences and perspective. Such views and experiences can be presented in a variety of forms, including text, images, music and video. Major social networks include blog, online forums, podcast, wiki, folksonomy and so on. Social network becomes the key feature of Web2.0, and tagging is one of t he most important applications in social networks [4] [5] [6]. In a tagging system, users can assign any tag to any resource (liked or disliked). Tags can be seen by everyone. Some of the websites also offer tag recommendation service; a few tags will be recommended when users are tagging. Carmagnola et al. presented that the action of tagging shows user’s interactivity level, organization level and interest in a content [7]. Researchers are paying more and more attention to tags recently. Flickr2, which is a typical social networking system, provides users with a platform to upload photos: after registration and login, one user can browse, rate and tag other users’ photos. CiteULike 3 is a platform for sharing papers and it also allows users to tag their collected papers. The function of a recommender system is to filter the huge amount of information and pick potential interesting content to the users. It provides these personalized recommendations based on users’ browsing histories [8]. However, recommender systems in social networks should be different from the traditional one because a user’s tagging behavior could be an important fact for analyzing his personalized interests [9]. In this paper, we explore how to use the tagging information to construct the relationship between users and resources in the social networking system, based on the generic framework of Random Walk with Restarts. We also design two algorithms. The first one treats the tagging behavior as a direct relationship between users and resources and adds the relationship to improve the performance. The second one measures the similarity between users depending on their co-tagging behavior and adds the similarity relationship to promote the performance. Experiments on real data show that, compared to the baseline Random Walk and Restarts method, the second algorithm has better performance and the first one has worse performance. Within this context we make the following contributions:
Abstract—Recommender systems have emerged as an essential response to the rapidly growing digital information phenomenon in which users are finding it more and more difficult to locate the right information at the right time. Systems under Web2.0 allow users not only to give resourcesratings but also to assign tags to them. Tags play a significant role in Web 2.0. They can be used for navigation, browsing, recommendation and so on. In this paper, we propose a novel recommendation algorithm, which is based on social networks. The social network is established among users and items, taking into account both the information of ratings and tags. We consider users’ co-tagging behaviors and add the similarity relationship to the graph to enhance the performance. Our algorithm is based on the Random Walk with Restarts but provides a more natural and efficient way to represent social networks. Having considered the influence of tags, the transition matrix is denser and the recommendation is more accurate. By evaluating our new algorithm and comparing it to the baseline algorithm which is used in many real world recommender systems on a real life dataset, we make the conclusion that our method performs better than the baseline method. Keywords-Recommendation; Random Walk with Restarts; Social Networks; Graph-based Algorithm
I.
INTRODUCTION
Development of network technology has accelerated the progress of e-commerce, and commercial interests require web sites to meet the user's interest and to explore their potential needs by providing personalized services. In this situation, the recommendation system came into being [1]. Recommender system is a system that produces individualized recommendations as output or has the effect of guiding the user in a personalized way to interesting or useful objects in a large space of possible options [2]. Recommender systems are used in many fields including books, music and news. Using Amazon 1 as an example, a user buys a book from the site, and the system automatically recommends some similar books bought by other users. It is very likely that the user would like these recommended books, and buy more, which brings more profits to the site [3]. With the rapid development of Web2.0 technologies, social networks began to flourish. Social network is a
2 1
3
http://www.amazon.com/
978-0-7695-4012-2/10 $26.00 © 2010 IEEE DOI 10.1109/APWeb.2010.60
116
http://www.flickr.com/ http://www.citeulike.org/
•
B. Random Walk The phrase “Random Walk” was first used by Karl Pearson in 1905. It translated from single dimension to higher dimensions in later developments. It is often applied on bipartite graphs in computer science [18] [19]. Konstas et al. recommended items based on the Random Walk in a click-through data graph [17]. Jaschke et al. evaluated adapted PageRank on various types of social networks to recommend tags in folksonomies. They evaluate their system using data from del.icio.us, last.fm and BibSonomy [20]. Random Walk with Restarts is an improvement on the Random Walk technique. It adds the “restart” part in the walk process, which is more suitable for personalization system. Several studies exist in this field of applying Random Walks with Restarts (RWR) on social graph. Some of them compare the algorithm based on RWR model to collaborative filtering and prove that RWR model performs better than collaborative filtering model. Yildirim et al. designed a novel recommendation algorithm which performs Random Walk on a graph that makes use of the similarity measures between items [21]. Konstas et al. took into account both the social annotation and friendships inherent in the social graph to recommend music based on Random Walk with Restarts framework [17]. They evaluated their method with adapted collaborative filtering and proved that RWR model performs better in the area of social networks. Although both studies are close to our approach, they did not take into account the user’s similarity in tagging behavior. We make use of this relationship of users to make the transition matrix denser and improve the performance.
Our adapted algorithm significantly promotes the performance, compared to the baseline Random Walk with Restart method. • We show that the relationship between users based on the common tagging behaviors can improve the performance on sparse data of an item recommendation system. • We successfully combine the user’s rating and tagging information of the resources for recommendation. The rest of the paper is organized as follows. In Section II we review related work and provide useful background for the Random Walk methods used in this paper. The baseline method, Random Walk with Restarts algorithm, and two tagbased algorithms are described in Section III. In Section IV we present the evaluation protocol and analyze the results of the experiments. Finally we conclude this paper in Section V. II.
RELATED WORK
In this section, we review related work in two parts: recommender algorithm and Random Walk. A. Recommender Algorithm Recommender algorithm is the core of the recommender system, which determines the performance of the system. There are three popular methods adopted by contemporary recommender systems. Firstly, the content-based recommendation, which recommends resources based on their content and not on user’s rating and opinion [10]. The objects are defined by their associated features of content in the content-based system. The disadvantage of this method is that the resources need to be structural and the taste of users should be described in the features of the content. For examples, in the case of news recommendation, news cannot be characterized by the terms present in a document [11]. Secondly, the collaborative filtering recommendation is one of the earliest and the most successful technologies. It is based on the assumption that similar users express similar interests on similar resources [12] [13]. These collaborative filtering systems can be classified into user-based and itembased systems [14] [15]. User-based system predicts the score of resources by finding the nearest neighbors. We often use cosine-based similarity to get the neighbor set, which can be identified by a threshold or selecting top-N [16]. Itembased system makes prediction by finding similar resources and then takes a weighted combination of their ratings [17]. The strong advantage of this method is that it has no requirements of the recommended object. However, it suffers from data sparseness. Thirdly, the graph based recommendation which uses transitive associations between users and resources in the bipartite user-resource graph. In graph based algorithm, recommendation problem turns into a node selection problem on a graph. Such graph based recommendation algorithms are getting more attention recently. The Random Walk we will review in the next part is one of the graph based algorithms.
III.
TAG-BASED ALGORITHMS
In this section, we describe details of the baseline RWR algorithm and our two algorithms. A. Random Walk with Restarts(RWR) The structure of a social network can be described by a graph, G=(V,E), where V represents the set of nodes and E denotes the set of edges. Users and resources become nodes and the links between them become edges. It is a weighted undirected graph. The edge with larger weight value represents a closer relationship between two nodes. Random Walk with Restarts can be used to calculate the correlation between two nodes. According to Konstas et al., starting from a node x, a RWR is performed by randomly following a link to another node at each step [17]. Additionally, each step can restart from x with a probability of a. The basic idea of RWR can be expressed as:
p (t +1) = (1 − a) Sp (t ) + aq .
(1)
p (t ) , p ( t +1) and q are vectors. pi (t ) represents the probability that the random walk at step t visits node i. S is the transition probability matrix and its element, S i , j ,
117
User Resource
User Resource
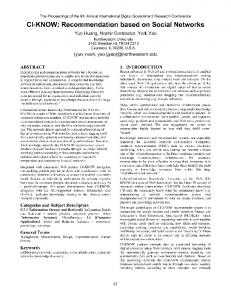
Figure 1. Add an edge from u to r Figure 2. Change in Adjacency Matrix with tags weights
denotes the transition probability from node i to node j in one step. If the graph G is connected and the Greatest Common Divisor of the length of all closed walks on G is 1, the probability of reaching any node in the graph should reach a stationary distribution after n steps and re-iteration does not change the distribution [22]. The probability distribution is calculated using equation (1), which is carried out in a process of random walk in the graph. Repeating the iteration of the equation until p converges, we can get a stationary distribution of the nodes. Let us consider a movie data set. There are three important parts in this social website: information about the users and resources, information about ratings which users assigned to movies they have watched and information about tags which users assigned to movies. We assume that we are given a set of users U, a set of resources R and a set of tags T. We define a weighted and undirected graph G as we described before. V consists of two parts: users and resources, which means V = U ∪ R . If user i rates resource j, there is an edge between node i and node j. The weight of the edge is the rating. We define A as the weighted adjacency matrix of G:
and the sum is 1. If we want to recommend resources to user i, we will mark node i as the starting node. q is a vector in which the element corresponding to the starting node is set to 1. So it should be easily accessible to the node which is closer to the starting node that they would get greater stationary probabilities. Therefore, after the iteration converges, we sort the nodes with their stationary probabilities. The node with larger stationary probability is closer to the target node.
B. Tag-based Promotion Algorithms Here, we propose two algorithms based on tagging information. The first one treats tagging behaviour directly as another form of rating. The second one measures the user’s similarity based on their tagging information. We discuss them one by one in this subsection. 1) Treating tagging behaviour directly as another form of rating: By investigating and analysing the real data, we found that a large number of users assign tags on the resources, but do not do the rating. Our first algorithm takes this part of information into account. Suppose a user u assigns a tag t on resource r, but he didn’t rate this resource. So there is no connection between them in the original graph G. In our first algorithm, we add ⎧rating (i, j ) ∈ E . (2) an edge from u to r in the graph by considering users’ A = (ai j ) i , j∈V . ai j = ⎨ otherwise ⎩0 tagging behaviours as shown in Fig. 1. The adjacency matrix of the graph is also changed. Apparently the matrix A is symmetric and the element of Fig. 2 shows the changed adjacency matrix of the graph and “tags weights” denotes the new edges. The change in the A, a ij , presents the strength of the relationship between adjacency matrix makes the transition matrix denser. node i and node j. If a ij > a ij ′ , the relationship between i However, the weight assignment metric of newly added and j is closer than that between i and j’. edges is different from the existing edges which directly use We define S as the normalized adjacency matrix of the the value of user rating. Here, we design three methods to determine the weight of new edges and we will choose the graph [23], which is derived from A: best one in the experiment: −1 / 2 −1 / 2 • Assigning the minimum value of user rating to be S=D AD . (3) the weight of each new edge. • Assigning the maximum value of user rating to be where D is the degree matrix of A. the weight of each new edge. ( 0) p represents the initial distribution of the nodes of the • Assigning the average rating of the corresponding user to be the weight of the new edge. graph. In our algorithm, the elements of p ( 0) are all equal
118
User Resource
User Resource
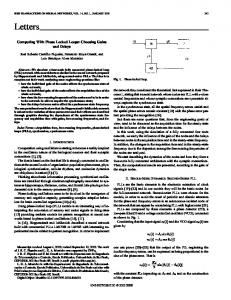
Figure 4. Change in Adjacency Matrix with Similarity
Figure 3. Add an edge from ui to uj
2) Measuring the user’s similarity based on their tagging information: Suppose there are two users, u i and u j , u i
where k is a parameter that we will test it in the experiment. Fig. 4 shows the difference between the old adjacency matrix and new one. The change in the adjacency matrix makes the transition matrix denser.
assigned tag t to resource ri and u j assigned the same tag
t to resource r j . If these two users did not browse the same
IV.
resource, then they will not have the connection in the original graph. However, we notice that they are actually using the same tag, in other words they are both interested in the content related to tag t . Therefore, the second promotion algorithm uses the tags’ similarity between the users to improve the performance. Assume that ni is the number of tags user u i assigned,
EVALUATION AND EXPERIMENT
A. Dataset and Evaluation Protocol We take the experiment on the real movie-rating data set MovieLen 4 . MovieLens data set was collected by GroupLens5 Research Project at the University of Minnesota. We removed some of the users with no rating or no tagging information in the network. After this process, we finally chose the giant connected component to be our t i ( k ) is the k th tag made by user u i and the frequency of experiment data set, which consists of 561 users, 1688 movies, 158812 ratings and 95580 tag assigning information. tag t i ( k ) is c i ( k ) . The pair (tag, frequency) is used to We split the dataset into training set and test set with the describe the interest of user u i , which should be: ratio of 90%:10%. While 141,982 ratings were used as training set, the remaining 16,830 ratings served as the test (1) (1) ( 2) ( 2) ( ni ) ( ni ) (t i , ci ), (t i , ci ), … , (t i , c i ) . Similarly, the set. With this datasets, we constructed a graph following the interest of user u j is (t j (1) , c j (1) ), (t j ( 2) , c j ( 2) ), … rules described in Section III. We chose positive ratings (3.5, , (t j ( n j ) , c j ( n j ) ) . Assume that set T is the set of tags they 4, 4.5 and 5) to construct the graph. According to Onuma et al., dealing with negative ratings requires another model and both assigned and we are here to use the cosine-based we would like to focus on the evaluation of the performance similarity to calculate the similarity between the two users: of our algorithms [23]. The graph is a connected component and we calculate the K K sim(u i , u j ) = cos(u i , u j ) Greatest Common Divisor of the length of all closed walks on graph, which is 1. So as we discussed in Section III, the ci (t ) c j (t ) K K algorithm can converges to a stationary distribution. ui ⋅ u j t∈T . (4) We evaluate the performance over two widely used = K = K nj ni information retrieval metrics [11], which are: ui × u j 2 2 ci ( k ) c j (k ) • Precision at rank K (P@k): At the most metrics in Information Retrieval field, P@k reports the k =1 k =1 proportion of resources ranked in the top K results We connect two users who assigned the same tags as that is relevant. In our experiment, we report the shown in Fig. 3. The weight of the edge should be precision at k for three values of k: P@2, P@5, proportional to the similarity and we assume it is w: P@10. • Success at rank K (S@k): This metrics reports the probability of finding a good resource among the top w = k * sim(u i , u j ) . (5)
∑
∑
∑
4 5
119
http://www.movielens.org/ http://www.grouplens.org/
TABLE 1 PERFORMANCE OF RWR WITH DIFFERENT
RWR: a=0.9 a=0.8 a=0.7 a=0.3
a
TABLE 3 PERFORMANCE OF RWUU WITH DIFFERENT VALUES
VALUES
S@1
S@5
P@2
P@5
P@10
0.1871 0.1942 0.1818 0.1782
0.5365 0.5347 0.5401 0.5204
0.2040 0.2023 0.1827 0.1862
0.2017 0.2057 0.2053 0.1985
0.1942 0.1925 0.1871 0.1823
RWUU: k=1 k=3 k=5 k=7
S@5
P@2
P@5
0.5294 0.5294 0.5294
0.1818 0.1827 0.1827
0.2035 0.2032 0.2028
S@5
P@2
P@5
0.1889 0.1978 0.2014 0.1942
0.5365 0.5258 0.5418 0.5347
0.1916 0.1996 0.2085 0.2023
0.2078 0.2071 0.2089 0.2057
P@10 0.1875 0.1914 0.1934 0.1925
TABLE 4 EVALUATION RESULTS OF THREE ALGORITHMS
TABLE 2 PERFORMANCE OF RWUR WITH DIFFERENT METHODS
S@1 RWUR: Method 1 0.1782 Method 2 0.1764 Method 3 0.1782
S@1
S@1 S@5 Baseline Algorithm: RWR 0.1942 0.5347 Promotion Algorithm: RWUR 0.1782 0.5294 RWUU 0.2014 0.5418 Improvement: RWUR -8.2% -0.9% RWUU 3.7% 1.32%
P@10 0.1871 0.1864 0.1864
K results. We report the success at rank 1 (S@1) and the success at rank 5 (S@5). The reason why we do not use recall as one of the metrics is that recall and precision actually measure the same thing in this problem. We can see their definitions below:
P@2
P@5
P@10
0.2023
0.2057
0.1925
0.1827 0.2085
0.2028 0.2089
0.1864 0.1934
-9.6% 3.1%
-1.4% 1.55%
-3.3% 0.4%
personalization can get more precision. So we use a=0.8 for RWR and we also use it in RWUR and RWUU similarly. Secondly, we should choose a method to determine the weight of the new edges in the RWUR. The performance of RelevantNum . (6) RWUR with different methods is presented in Table 2. recall = TS Because we only choose positive rating, the average rating should between 3.5 and 5, while the minimum and R elevantNum . (7) maximum of rating are 3.5 and 5 respectively. So the precision = U * RecommendLength performances have negligible difference in the three methods, which is listed in Table 2. Finally, we choose the where TS stands for test set, U stands for users set, third method: assigning the average rating of the RelevantNum denotes the number of relevant resources in the corresponding user to be the weight of the new edge. results and RecommendLength represents the number of Thirdly, we test the parameter k in the RWUU. The resources that are recommended to a user. Recall and results are presented in Table 3. precision are both determined by RelevantNum so that an The average value of user’s similarity was about 0.07 and algorithm with higher precision at rank k must have higher the average rating score was 4.07. k determines the degree of recall at rank k. importance of the link between users to users' rating In addition, users always care about the relevance of the information. From the experimental results, when k=5, the results with high ranking. They will not notice some various indicators are optimal. At this point, the average recommended resources given by system with low ranking, similarity is 0.35, so their ratio is about 1:10, which comes to especially after 20. So the performance of the high ranking the global optimum. From this experiment, we can see that results should be the most important and we test precision at rating information is still the most important feature in top 5 and top 10 instead of top 20 and top 50. building user’s interest model, but user’s tagging behaviours should still be considered to make the model perfect. B. Experiment C. Results Analysis We test the following three algorithms on the dataset: We carried out evaluation on the baseline, RWR and our • Random Walk with Restart(RWR) two algorithms together and make comparisons. The results • User-Resource Tag-based Algorithm(RWUR) are listed in Table 4. • User-User Tag-based Algorithm(RWUU) From the above results, we can conclude that the The algorithms were implemented in the Java language performance of RWUR is lower compared to baseline and run on a 1.66GHz Intel Core 2 Duo CPU with 2GB algorithm RWR. The reason is that assigning a tag to a memory running Windows Vista. resource doesn’t mean that the user likes this resource. Users Firstly, we test the parameter a in the RWR. The results may simply feel that the film is a representative one, or are showed in Table 1. simply to be marked, but have never watched it. If the user a is the probability of re-start and a=0.8 and a=0.9 are has really watched the movie, he would usually rate it, rather better then others, which means higher level of than just tag it.
120
If there are a lot of resources in the system, it is likely that different users browse diverse resources. So less common resources are shared between users and it will be hard for the current recommendation algorithm to obtain a good effect. However, we notice that the use of tags would be general that people usually use some common tags to describe diverse resources. For example, if a user looked some horror movies which almost no other user has seen, the user can not establish any connection with someone else, but if the user assigns some tags to the movies, he may choose tag “horror”, which will set up a link to other users, and that can still makes our recommendation algorithm recommend some relevant results.
TABLE 5 THE RANGE OF RATED RESOURCES NUMBER IN EACH GROUP
Group 1 Group 2
Rated Resources Number