action network is generated iteratively through application of the graph .... tion rules for chemical transformations to a seed set of chemical species. Ensem-.
Graph Theory for Rule-Based Modeling of Biochemical Networks Michael L. Blinov, Jin Yang, James R. Faeder, and William S. Hlavacek Theoretical Biology and Biophysics Group, Theoretical Division, Los Alamos National Laboratory, Los Alamos, NM 87545, USA {mblinov, jyang, faeder, wish}@lanl.gov
Abstract. We introduce a graph-theoretic formalism suitable for modeling biochemical networks marked by combinatorial complexity, such as signal-transduction systems, in which protein-protein interactions play a prominent role. This development extends earlier work by allowing for explicit representation of the connectivity of a protein complex. Within the formalism, typed attributed graphs are used to represent proteins and their functional components, complexes, conformations, and states of post-translational covalent modification. Graph transformation rules are used to represent protein-protein interactions and their effects. Each rule defines a generalized reaction, i.e., a class of potential reactions that are logically consistent with knowledge or assumptions about the represented biomolecular interaction. A model is specified by defining 1) molecular-entity graphs, which delimit the molecular entities and material components of a system and their possible states, 2) graph transformation rules, and 3) a seed set of graphs representing chemical species, such as the initial species present before introduction of a signal. A reaction network is generated iteratively through application of the graph transformation rules. The rules are first applied to the seed graphs and then to any and all new graphs that subsequently arise as a result of graph transformation. This procedure continues until no new graphs are generated or a specified termination condition is satisfied. The formalism supports the generation of a list of reactions in a system, which can be used to derive different types of physicochemical models, which can be simulated and analyzed in different ways. The processes of generating and simulating the network may be combined so that species are generated only as needed.
1
Introduction
A common feature of biochemical networks, especially those comprising proteinprotein interactions, is combinatorial complexity [15,7,29,26], which is present whenever a relatively small number of biomolecular interactions have the potential to generate a much larger number of distinct chemical species and reactions. For a system marked by combinatorial complexity, the conventional approach of manually specifying each term of a mathematical model is often impossible if the C. Priami et al. (Eds.): Trans. on Comput. Syst. Biol. VII, LNBI 4230, pp. 89–106, 2006. c Springer-Verlag Berlin Heidelberg 2006 �
90
M.L. Blinov et al.
model is intended to account comprehensively for the consequences of biomolecular interactions. Thousands of reactions may arise from the interactions of only a few proteins, as in cases we have studied [25,19,5]. A solution to this problem is to specify a rule for each biomolecular interaction and its effects, and then use the rules to automatically generate a logically consistent reaction network and corresponding models, which may take diverse forms. This approach has been used, typically ad hoc, to model a number of signal-transduction systems (for examples, see [47,28,36]). These systems, in which combinatorial complexity is ubiquitous, regulate cellular responses to environmental stimuli through proteinprotein interactions and play important roles in many diseases. The complexity of models can be reduced in certain circumstances [8,18,6], but methods for treating combinatorial complexity are still needed. Recently, several frameworks and software tools have been developed for modeling biochemical networks through formalized descriptions of biomolecular interactions. These frameworks include visualization tools and visual languages [34,12,32,1], process algebras [43,10], and different types of rewrite systems [9,48,20,4,17]. Software tools that allow specification of a kinetic model via rules for biomolecular interactions include BioNetGen [4,17] and BIOCHAM [20]. In both cases, rules are expressed in a rudimentary but general-purpose language and interpreted through procedures of pattern matching and string rewriting. Another tool that can be used to obtain a kinetic model, Moleculizer, provides a set of modules for model specification [37]. Each module functions as a reaction generator for a particular type of reaction. Related work is discussed in more detail later. Here, we provide a theoretical framework for extending the BioNetGen language to include graph transformation rules [2]. This report formalizes the diagrammatic conventions proposed in [16] for representing proteins and protein complexes as graphs and introduces new details about the graphical procedures for model specification and generation. The motivation for this extension is a desire to be able to explicitly track and account for the connectivity of a protein complex, which is important, for example, when the reactivity of a complex depends on its configuration, which is common. The graph-theoretic formalism is tailored to the problem of building physicochemical models of biochemical networks, particularly protein-protein interaction networks. It allows for the abstraction of proteins, functional components of proteins, and protein complexes, including multimeric proteins that function as a unit. Throughout the text, we will illustrate concepts using cartoon diagrams of [16]. Most of these diagrams pertain to the model of [19] for membrane-proximal events in Fc�RI-mediated signal transduction.
2
Model Specification
A model specification necessarily includes a definition of the material parts of a system and all of the internal states of these parts to be considered. An example of an internal state, which might be associated with a tyrosine residue (as a
Graph Theory for Rule-Based Modeling of Biochemical Networks
91
convenient abstraction), is phosphorylation status. The two possible states of such a protein component might be labeled ‘phosphorylated’ and ‘not phosphorylated.’ Another example is the three-dimensional conformation of a protein. If consideration of two conformations is adequate for modeling purposes, these states might be labeled ‘open’ and ‘closed.’ A specification also includes a definition of the chemical transformations that can potentially take place in a system. Some transformations may change the connectivity of molecular parts, as when two proteins form a complex. Other transformations may change the internal states of molecular parts, as when a protein tyrosine kinase (PTK) catalyzes a phosphorylation reaction or when binding of a ligand induces a conformational change of an allosteric enzyme. A reaction network is obtained by applying reaction rules for chemical transformations to a seed set of chemical species. Ensemble functions corresponding to readouts of interest, such as conserved quantities or observables, can be used to specify model outputs. Graphs for elements of a model specification are defined in detail below. 2.1
Molecular Entities, Components, and Complexes
Most molecular entities of interest, such as polypeptide chains, are structured units of a biochemical network. Proteins involved in signal transduction, for example, typically contain multiple functional components and interactions are mediated by such components. Examples include sites of modification (amino acid residues), protein motifs, catalytic subunits, and protein interaction domains [41]. Definition 1. A Molecular-entity Graph is a triple M = (V, E, AM ), where V is a set of labeled attributed vertices and E is a set of undirected edges. Vertices represent components. Vertex labels need not be unique; multiple vertices with the same label indicate components considered to be equivalent and may give rise to structural symmetry. Edges represent intra- or intermolecular bonds between components. A molecular-entity graph has a unique label and may have an optional set of attributes AM . Molecular-entity graphs for the four proteins considered in the Fc�RI model are shown in Fig. 1(a). Note that edges are not included, even though the components of the molecules are physically connected. Consideration of these connections would not affect the behavior of this particular model. Molecularentity graphs reflect the level of abstraction in a model and largely define the model’s scope. Additional definition of the problem domain comes from typing of the components and edges in molecular-entity graphs, which is discussed later. Briefly, typing defines which attributes of a vertex are variable and which are fixed. Typing also defines the possible values of the variable attributes. Fixed attributes might include sequence, molecular weight, links to annotation sources, etc. Molecular weight is one example of a fixed attribute that might affect reactivity [37,17]. An example of a variable attribute is phosphorylation status, which often affects binding activity.
92
M.L. Blinov et al.
(a)
Syk kinase
Tandem SH2 domains
tSH2
Linker region
L
Activation loop
A
FcεRI receptor γ-Y β-Y γ-pY β-pY
L-Y L-pY
α
γ-pY β-Y
Unique/SH2
A-Y A-pY
(c) type : site of binding
β-Y γ-pY
α
name: string
Bivalent ligand. Fc
(d)
(b)
Lyn kinase
g
type : site of binding
L-Y A-pY
Fc
(e)
γ-pY
type : site of phosphorylation
L-Y A-Y
(f)
γ-pY β-Y
α
name: string state: {Y, pY} γ-pY β-pY α
γ-pY β-pY α
name: α
type : site of phosphorylation
g
A-pY
L-Y A-pY
L-pY A-pY
L-pY A-pY
name: L state: Y
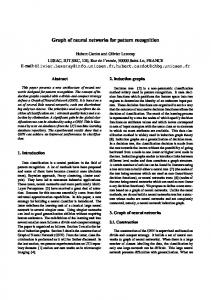
Fig. 1. Graphs of the Fc�RI model. (a) Graph representations of molecular entities in the model of [19] according to conventions proposed in [16], with minor deviations. Vertices within the PTK Syk represent three components: tandem SH2 phosphotyrosine binding domains, linker region (L) and activation loop (A). Components L and A have a ‘state’ attribute that can take two values: Y and pY, corresponding to ‘not phosphorylated’ and ‘phosphorylated’. The bivalent ligand is comprised of two identical binding domains (Fc). The PTK Lyn includes a single component that lumps the unique and SH2 domains of this protein. The multichain Fc�RI receptor consists of three components representing the α, β and dimeric γ chains of the receptor. The β and γ components have phosphorylation state attributes like A and L above. (b) A chemical species graph. (c) Component-level type graph (CTG) corresponding to this model. (d) The chemical species in (b) typed over CTG by the typing mapping g. (e) A pattern graph. (f) Members of an ensemble of chemical species matched by the pattern graph.
In the future, it may be desirable to extend the concept of molecular entity to embrace recursion, such that a molecular entity may be comprised of molecular entities. In the meantime, we treat a complex of molecular entities as a special case. Definition 2. A Complex Graph MΣ is a connected set of molecular-entity graphs. A complex graph may be associated with an alphanumeric label, if desired, and an optional set of attributes. In the model of [19], 300 out of 354 potential chemical species contain a receptor dimer, which can be represented as a complex graph. It is important to consider complexes, because complexes can be observed experimentally and are often of functional significance. An example is provided by the case of a receptor that becomes phosphorylated only when it is complexed with a second receptor of the same type. Complex graphs are connected at the level of molecular-entity graphs, but because the vertices of a molecular-entity graph need not be connected, a complex graph may be unconnected at the level of component vertices. Note that if we restrict ourselves to consideration of binary interactions (the default assumption), then each vertex of a complex graph is connected by at most one edge. The label of a complex graph may be either assigned or derived from stoichiometry and molecule labels.
Graph Theory for Rule-Based Modeling of Biochemical Networks
2.2
93
Chemical Species
The material building blocks of a biochemical network, defined above, are its components, molecules, and complexes. Chemical species, one of the two kinds of elements in a chemical reaction network, are particular configurations of these building blocks in specific internal states. Definition 3. A Chemical-species Graph C is a molecular-entity or complex graph with any and all variable attributes taking specific values. A chemical-species graph is illustrated in Fig. 1(b). Note that, consistent with the layout conventions of [16], molecular-entity graphs comprising the chemicalspecies graph are enclosed in boxes for clarity and some labels are suppressed to avoid clutter. 2.3
Types of Components and Bonds
The molecular-entity graphs of a system, and all derivative graphs of a system, are typed over a component-level type graph, which defines the types of vertices and edges in the system. Definition 4. A Component-level Type Graph (CT G) of a biochemical system comprises a pair (CV, CE), where CV is a set of vertex (component) types, and CE is a set of edge (bond) types. Each type is associated with a set of attributes, which may be variable or fixed. Values of fixed attributes are defined, and the allowable values of variable attributes are enumerated or otherwise indicated. Any graph G of a system comprised of or derived from the system’s set of molecularentity graphs is typed over CT G via a mapping g : G → CT G. As indicated in Fig. 1(c), we consider the components of molecules in the Fc�RI model to belong to one of two types. Each component is a site of binding and/or a site of phosphorylation. A site of phosphorylation has a variable attribute, which has two possible values, Y (not phosphorylated) or pY (phosphorylated). Components α, β, γ, Fc, unique/SH2, and SH2 are sites of binding. Components β, γ, L, and A are sites of phosphorylation. The type graph of Fig. 1(c) further indicates that two types of bonds are considered. A bond is allowed between two binding sites or between a binding site and a phosphorylation site. A typing mapping is partially illustrated in Fig. 1(d). 2.4
Pattern Graphs and Ensembles of Chemical Species
Pattern graphs are derived from molecular-entity graphs. They appear in reaction rules and function evaluation rules, defined later, and they can be considered subgraphs of chemical-species graphs. We refer to the set of chemical-species graphs matching a pattern graph as an ensemble, because these graphs represent chemical species that all have a common reactivity or all contribute to a common quantity (the value of an output function).
94
M.L. Blinov et al.
Definition 5. A Pattern Graph P = (VP , EP ) is a set of molecular-entity and/or complex graphs. These graphs need not be connected. The components, molecular entities, and complexes of P may each be associated with a set of variable attributes. In addition, connectivity of the graphs of P to external components is specified via an interface. The�Interface of a Pattern Graph IP is a � partition of VP into three sets: VP = VP0 VP1 VP01 , where VP0 is a set of components that cannot be bound to components external to the pattern graph, VP1 is a set of components that must be bound to components external to the pattern graph, and VP01 is a set of components that are free to be either bound or unbound to components external to the pattern graph. A pattern graph is illustrated in Fig. 1(e). According to the conventions of [16], the interface of a pattern graph is specified by the symbol used for a node (open, half-filled, or filled circle). An open circle represents a component v ∈ VP0 . A half-filled circle represents a component v ∈ VP01 . A filled circle represents a component v ∈ VP1 . By convention, a half-filled circle is omitted in the diagrammatic representation of a graph if values of variable attributes of this component are unrestricted. As indicated earlier, a pattern graph is used to define an ensemble of chemical-species graphs. Definition 6. An Ensemble of Chemical-species Graphs ΩP is a set of chemical-species graphs each matched by an identical pattern graph P . A chemical species graph C = (V, E) is matched by a pattern graph P = (VP , EP ) iff 1. there exists a subgraph C � = (V � , E � ) ⊆ C isomorphic to P via an isomorphism f : P → C � ; 2. f is consistent with the interface IP ; and 3. f preserves attributes of components, molecular entities, and complexes, e.g., for a vertex v ∈ VP attributes of f (v) ∈ V � fall within the set of attributes defined for v ∈ VP . Figure 1(f) shows an ensemble of chemical-species graphs, each of which is matched by the pattern graph of Fig. 1(e). Note that chemical-species graphs containing multiple subgraphs isomorphic to a pattern graph may be matched multiple times. For example, the simple string pattern AB matches BAB twice. In the future, it may be useful to associate ‘context’ attributes with vertices of a pattern graph to restrict or otherwise control the number of matches, which affects parameterization of reactions (see below). The observables of an experiment typically correspond to properties of ensembles. Thus, it is important to be able to determine such properties so that model predictions can be tested. This capability is obtained by specifying a function evaluation rule [4,17]. Definition 7. A Function Evaluation Rule is a pattern P and a function of attributes of chemical-species graphs belonging to ΩP . This function is referred to as an output function.
Graph Theory for Rule-Based Modeling of Biochemical Networks
95
A function evaluation rule is processed by first finding the chemical-species graphs matched by the pattern graph of the rule and then calculating the value of the rule’s output function. An example of an output function is a weighted sum of concentrations. A rule associated with this type of function is useful, for example, for determining the total concentration of a protein X in a particular state of phosphorylation when the protein may be distributed among numerous chemical species, as is usually the case. Concentrations of chemical species are weighted by the number of X proteins in each species. 2.5
Chemical Reactions
We have now introduced definitions needed to consider one of the two kinds of elements in a biochemical reaction network, a chemical species. The second kind of element is a chemical reaction. Definition 8. A Chemical Reaction ρ comprises a set of reactant chemical species graphs Rρ , a set of product chemical species graphs Pρ , and a rate law νρ . Product chemical species graphs are obtained from reactant chemical species graphs via graph rewriting consistent with chemistry. Graph rewriting consistent with chemistry in the case of a closed system means that Pρ is obtained from Rρ via composition of the following operations: – addition/removal of intra- or inter-molecular edge(s), – change of values of variables attribute(s), and – replacement of a molecular entity or set of molecular entities with another molecular entity or set of molecular entities having the same components. The first two classes of operations are found in the Fc�RI model. The third class of operations is allowed so that one may model assembly and disassembly of a multimeric protein (Fig. 2(d)), covalent reactions between proteins, and proteolytic cleavage of a protein. Examples of the latter reactions occur in activation of the complement system via the classical pathway. (The enzyme C1 assembles on the surface of an antigen, which leads to cleavage of complement component C3 to generate fragments C3a and C3b. C3b may then attach covalently to the antigen.) Two additional operations are allowed for an open system: synthesis and degradation of a set of molecular entities. Degradation of a molecule means that its corresponding molecular-entity graph is removed (to a sink external to the system being modeled) along with any and all bonds to which it is connected. Synthesis of a molecule means that a new molecular entity appears (from a source external to the system being modeled). Finally, we note that the second class of operations includes transport between compartments if compartment location is included as a variable attribute of molecular entities in a multicompartment system. Figure 2 illustrates chemical reactions involving representative rewriting operations. The composition of the rewriting operations of a reaction implies a mapping fρ between vertices of Rρ and Pρ . This mapping must preserve, add,
96
M.L. Blinov et al.
and remove molecular-entity graphs as units. In other words, if any vertex of a molecular entity in Rρ maps to ∅ then all other vertices of this molecular entity must also map to ∅ (Fig. 2(e)). Vice versa, if some vertex v ∈ M ⊆ Pρ lacks a preimage, then no other vertices of M may have preimages. Importantly, up to synthesis/degradation of molecular entities, fρ preserves components, i.e., vertices of chemical species in Rρ and Pρ are the same even if molecular entities are replaced with other molecular entities (Fig. 2(d)).
(a) Rρ
(c)
Pρ γ-pY -pY β-Y -Y
-Y α γ-pY -pY β-Y
α
Rρ
Pρ
State is changed
γ-pY -pY β-Y -Y
γ-pY -pY β-pY -pY α
New edge added
α
K
K
L-Y A-pY
L-Y A-pY L-Y A-pY
Pρ
(d) R ρ
L-Y A-pY
Pρ γ-pY -pY β-Y -Y
(b) Rρ
γ-pY -pY β-Y -Y α
γ-pY -pY β-Y -Y
(e)
L-Y A-pY
Molecular entities with the same components
α
γ-pY -pY β-Y -Y α
K
α
K
L-Y A-pY Edge removed
Rρ
γ-pY -pY β-Y -Y α
K
Pρ
γ-pY -pY β-pY -pY α
L-Y A-Y
Fig. 2. Different types of reactions. (a) Addition of an intermolecular chemical bond. (b) Breaking of an intermolecular chemical bond. Note that breaking a bond does not necessarily lead to two separate chemical species, because molecular entities may be connected by more than one bond and bonds may be intramolecular as well as intermolecular. (c) Change of a component’s attribute value. (d) Replacement of a molecular entity with two molecular entities having the same components. (e) Degradation of a molecular entity. Note that, as suggested by the layout of the diagrams in this figure, if the chemical-species graphs in Rρ and Pρ are each replaced with a single node, then a chemical reaction can be represented as a directed bipartite graph.
2.6
Reaction Rules
A reaction rule is a generalization of an individual reaction. It defines a class of chemical transformations of reactants to products; the reactants have common properties, as do the products. Definition 9. A Reaction Rule is a graph transformation rule r : RP → P P , a rate law ν, an application condition α, and precedence index N , where 1. A disjoint union of m reactant pattern graphs RP is used to match and select m reactant chemical species Cr . 2. The transformation rule r includes a component-level mapping function f : RP → P P consistent with chemistry (see above). It maps RP to a set of n product pattern graphs P P . A set of reactant chemical species Cr undergoes transformation by replacing the image of RP in Cr with P P via f . Dangling edges are removed. This process of graph rewriting corresponds to the well-known single-pushout approach [13]. Note that, to avoid ambiguity
Graph Theory for Rule-Based Modeling of Biochemical Networks
97
0 while embedding P P in Cr , any vertex of RP in VRP of the interface IRP 0 must remain in the same set in P P , i.e., f (VRP ) ⊆ VP0P . 3. The rate law ν is a function of rate parameters, such as a single-site rate constant, and properties of chemical species Cr , such as their concentrations. 4. The application condition α may include, for example, a pattern selecting species that may not serve as reactants. 5. The precedence index N is the priority of reactions generated by the rule. It is sometimes convenient to specify a rule that will generate reactions that replace a subset of reactions generated by another rule [17].
A reaction rule is illustrated in Fig. 3(a). It should be noted that a negative application condition can be specified by assigning a zero-valued rate law to a rule. All reactions with lower precedence generated by other rules are overridden. A practical application of this idea is the case in which an inhibitor of an enzyme is introduced to a model. An old rule that generates reactions catalyzed by the enzyme can be overridden by a new rule that additionally contains the inhibitor in RP and generates with higher precedence a reaction with a zero-valued or reduced rate.
3 3.1
Model Generation Application of Reaction Rules
A biochemical reaction network can be generated through iterative application of a set of reaction rules to a seed set of chemical species until no further change is possible (exhaustive generation) or a specified termination condition is reached (such as iteration until a given number of product species or reactions has been generated). The process of applying reaction rules to a set of distinct chemical species graphs C 0 consists of the following steps, generalizing the algorithm of [17]. For each chemical species C matched by RP , a transformation replaces RP in C with P P according to a procedure of graph rewriting, which as mentioned earlier corresponds to the standard single-pushout approach [13]. 1. For each reaction rule rm,n , RP1 +. . . RPm → P P1 +. . . P Pn , identify all sets of species graphs in C 0 that qualify as reactants. Then, for each RPi , find all matching species graphs Ci ∈ C 0 . If an application condition is specified, exclude all sets of species graphs � that do not satisfy the condition. 2. For each set of reactant species Ci , define � a chemical � reaction �(graph transformation) by replacing the image�of RPi in Ci with P Pj . In this operation, attributes of�vertices in � Ci that do not differ between the corresponding vertices of � RPi and � � P Pj are preserved. Incident edges of Ci not indicated in � RPi or P Pj are � also preserved. Any edge (l, c) between a vertex l ∈ �RPj and c ∈ C \ RPi is either replaced with an edge (f (l), c), if f (l) ∈ P Pj , or removed, if f (l) = ∅. Assign the precedence index N of the reaction rule to each reaction.
98
M.L. Blinov et al.
3. Applying all reaction rules to the set of seed species, generate a list of distinct reactions R0 . If the list R0 contains identical reactions with different precedence indices, delete reactions with indices less than the maximum index. All identical reactions of the same precedence remain in R0 . 4. Identify chemical species that are products in the list R0 but that are not isomorphic to any in the list C 0 to obtain a list of new species graphs C 1 .
(a) Fc
(b)
f
f
RP
RP PP
Fc
K α
α
f
New edge added
PP
γ-pY -pY β-Y -Y α
K
γ-pY -pY β-Y -Y
α
New edge added
L-Y A-pY L-Y A-pY
C
Fig. 3. Reaction rule for ligand-receptor binding in the model of [19]. (a) The rule consists of a reactant pattern graph RP , a product pattern graph P P , and a mapping f . The interface of RP specifies that two Fc components and an α component of RP should be unbound. The rule generates a reaction in which one Fc component is bound to the α component; the other Fc component is unaffected. The remaining components of species matched by the rule are also unchanged. (b) An example of a reaction that may be generated by the rule.
After the initial steps listed above, we continue the network generation procedure by iteratively applying each of the reaction rules to the set of species in �k i C , where k is a counter that is updated after each round of rule applicai=0 tion. Note that reactions need only be generated when reactant species include at least one reactant in the list C k . After each round of exhaustive application of the rules, we obtain a list of new reactions Rk and a list of new product species C k+1 . Termination occurs when either no new species are found or a specified termination condition is satisfied. Application of the reaction rule of Fig. 3(a) is illustrated in Fig. 3(b). In general, finding subgraph and graph isomorphisms can be computationally expensive (the subgraph isomorphism problem is NPcomplete [27]), but efficient methods are available for many problems of practical concern [50,39]. Also, for two labeled attributed graphs, (sub)graph isomorphism can be ruled out in many cases by a simple comparison of labels and attributes. Issues of termination and computational complexity are discussed further below. Termination. Figure 4 illustrates a set of rules for which the rule-evaluation procedure described above is non-terminating [11,16]. The rules of Fig. 4 describe interaction of a symmetric bivalent ligand with a symmetric bivalent cell-surface receptor. Rules (a) and (b) and their reverse forms describe the formation and break up of polymer chains of alternating ligands and receptors. Rule (c) and its reverse form describe ring closure and opening. The potential size of the network is limited physically by the numbers of ligands and receptors and binding parameters, but without regard to these quantities, the network is of infinite size.
Graph Theory for Rule-Based Modeling of Biochemical Networks
99
Rule evaluation can be terminated by specifying an arbitrary cutoff for chain size, number of species, etc. or a maximum number of iterations of rule evaluation. With such an approach, one must be careful to ensure that a generated network is of sufficient size to encompass the species populated in a simulation. Alternatively, as described below, rule evaluation can be embedded in network simulation. With this approach, network elements (species and reactions) are generated as needed and arbitrary termination of network generation is avoided. The fact that a set of reaction rules can generate sets of species and reactions of unbounded size demonstrates that membership of a given species in a reaction network is semi-decidable, meaning that membership cannot generally be ruled out in a finite number of steps. Also, in general, it cannot be determined if evaluation of a set of rules will eventually terminate in the absence of a specified termination condition, such as a maximum number of iterations. For biochemical systems, it is difficult to imagine a situation in which non-terminating rule evaluation could pose a major problem. The effective size of a network is always limited for physical reasons (e.g., as when only a finite number of molecules is available to populate the species of a network). An example of network size being limited by protein copy number is discussed in [15]. (a) Ligand capture RP1
PP1 K1
RP2
K1
(b) Receptor chain elongation PP2 K2
RP3
K2
(c) Receptor chain closure PP3 K3(n)
K3(4)
Fig. 4. Reaction rules for interaction of a bivalent ligand with a bivalent cell-surface receptor. Evaluation of these rules is non-terminating. (a) Rule for ligand capture rule and an example of rule application. (b) Rule for receptor chain elongation and an example of rule application. (c) Rule for receptor chain closure and an example of rule application. Note that the rate law in this rule depends on ring size [11]. Also note that pattern RP3 selects a single species, whereas the pattern RP2 above selects two species.
Computational Complexity. The procedure of rule evaluation may be computationally expensive for several reasons. Two important issues are as follows. 1. A problem of subgraph isomorphism must be solved to map a pattern graph onto a species graph. Each reactant pattern in a rule set must be tested for isomorphism against all of the species arising in a network.
100
M.L. Blinov et al.
2. A problem of graph isomorphism must be solved to determine the uniqueness of a species graph appearing in a new reaction. Each product of a new reaction must be checked for uniqueness against the other species arising in a network, which can be accomplished by generating a canonical label (a string) for each product of each reaction. The need to solve these problems in the procedure of rule evaluation could limit the applicability of our modeling approach to ‘small’ systems in some circumstances. However, we expect the procedure to be practical more often than not. Two factors serve to mitigate the computational costs. First, the vertices of graphs are labeled and attributed, and as a result, the computational cost of isomorphism scales as the number of identical vertices (those sharing the same label and attributes). This number is small in most cases we have considered, for example, as in two models we have reported for signal-transduction systems [19,5]. It should be noted that these models are among the largest ever considered for such systems, comparable in size to models developed for other systems using distinct rule-based methods [36,37]. Second, even in cases where the first property does not hold, as in the model of Fig. 4, the maximum degree of vertices is generally small, one to three, and thus low-complexity algorithms are applicable [38,21]. An unoptimized prototype implementation of our algorithm in Perl (available upon request) demonstrates the practicality of the algorithm, which we have used to generate an array of biological networks ranging in size from scores of species to more than 104 species (unpublished material). Compared with the method of BioNetGen 1.1 [4,17], which is based on string matching and substitution, we find that graph-based network generation is currently about an order of magnitude slower. However, the method is still feasible. For example, with a laptop computer, the model of [19], which includes 354 species, is generated in about 2 s using BioNetGen 1.1 [4,17], and it is generated using the prototype software in about 45 s. An extension of this model that includes 2954 species (available at http://cellsignaling.lanl.gov) is generated in about 40 s and 1400 s using the two software tools. Again, the prototype software has not been optimized: the algorithm for (sub)graph isomorphism implemented at this time is simply that of Ullmann [50]. Substantial improvements in performance should be possible. 3.2
Assigning Reaction Parameters
Although the rate law is the same for all reactions generated by a rule, rate constants assigned to individual reactions may be different [17,37]. For purposes of discussion, we will now assume that rate laws in reaction rules are rate laws for elem [Ci ], where [Ci ] denotes the mentary reactions (i.e., they have the form νr = κr Πi=1 concentration of chemical species Ci ) and that the rate constant of the rate law, κr , is a single-site rate constant. For a given individual reaction, the rate constant κr may need to be multiplied by any of a variety of factors to ensure consistency with other reactions generated by the same rule r. A factor may arise for reasons related to collision frequency. For example, the collision frequency of A + B reactions, in the limit of large numbers, is twice that of A + A reactions, all other factors being
Graph Theory for Rule-Based Modeling of Biochemical Networks
101
equal. A statistical factor may arise if there is reaction path degeneracy (multiple chemically indistinguishable reaction paths from reactants to products). A factor may arise for reasons related to turnover frequency in the case of a catalytic reaction. For example, if formation of a complex facilitates an enzymatic reaction by co-localizing enzyme and substrate, then we must consider the number of enzymes in the complex. A factor, which equals a volume ratio, may arise if reactions take place in separate compartments of different volumes. Rate constants may also be modified by the properties of the reactant chemical species (Fig. 4(c)). Statistical factors are related to symmetries [17]. Factors greater than 1 arise when a pattern RP is symmetric, meaning there exist non-trivial automorphisms ψ : RP → RP , and the reaction rule breaks the symmetry of the pattern. A transformation that completely breaks pattern symmetry is associated with a statistical factor of |Aut(RP )|, where Aut(RP ) is the automorphism group of RP . Consider, for example, the reaction rule A.A → A + A� in which A is a molecular entity graph, A� is a form of A that differs with respect to attribute values, RP ≡ A.A, ‘.’ represents an edge connecting molecular entities, and ‘+’ serves to indicate that P P ≡ A + A� is disjoint union of the graphs A and A� and that the molecularity of each reaction defined by the rule is 2. The reactant pattern is symmetric, with |Aut(RP )| = 2, but the nontrivial autmorphism is not preserved under the mapping onto the product patterns. This reaction rule, applied to the chemical species B.A.A.B, has a statistical factor of 2, because either of the two A molecules can be transformed into A� and the reactions B.A.A.B → B.A + A� .B and B.A.A.B → B.A� + A.B are chemically indistinguishable. When an automorphism is preserved under the mapping onto product patterns, it does not contribute to the statistical factor of a reaction. For example, the rule A.A → A + A applied to the chemical species B.A.A.B generates the reaction B.A.A.B → B.A + A.B with a statistical factor of one. In general, the statistical factor arising from pattern symmetry is given by the ratio |Aut(RP )| |Aut(RP →P P )| , where the denominator indicates the size of the group of autmorphisms of RP that are preserved under the mapping of RP onto P P . Statistical factors also arise when the reactant chemical species Cr contain symmetric instances of RP . For example, the rule A → A� applied to A.A would generate the reaction A.A → A.A� with a statistical factor of 2. 3.3
Embedding Rule Evaluation in Simulation
The method of network generation described above does not rely on the populations of species in the seed set or rate laws. Once a biochemical reaction network has been generated, it can be used to formulate different types of models. For example, one can generate a system of coupled ordinary differential equations (ODEs) or a stochastic simulation algorithm (SSA) [23,24], which is a Monte Carlo procedure for simulating discrete-event reaction kinetics. However, there are cases when all potential species of a reaction network cannot be exhaustively enumerated, as for interaction of a bivalent ligand with a bivalent receptor (Fig. 4). For such a system, rule evaluation would proceed indefinitely unless an arbitrary termination condition is specified. A solution to this problem is to embed rule
102
M.L. Blinov et al.
evaluation in the simulation procedure, such that chemical species are generated only as needed. Two methods for embedding rule evaluation in SSA-based simulation of biochemical reaction kinetics have been proposed [37,17], and both are now implemented in BioNetGen. With lazy rule evaluation [37], only reactions and species connected to newly populated species are generated. With layered rule evaluation [17], the network is extended when a species is populated for the first time by applying the reaction rules for a specified number of iterations (the default is one round), as in the procedure described earlier, to all current species. The relative efficiencies of the various simulation procedures have yet to be fully evaluated, but preliminary (unpublished) results indicate that pregeneration of a network followed by simulation and on-the-fly generation of a network during simulation are complementary. Lazy and layered simulation-embedded evaluation of rules are comparable for problems we have considered (unpublished material). Embedding rule evaluation in ODE-based simulations is straightforward and may provide better performance than analogous SSA-based simulations.
4
Discussion
The sheer size of some biochemical systems makes it difficult to formulate models for them and represent these models in comprehensible ways. Reaction rules for biomolecular interactions help to solve these problems [29,26]. Rules serve as generators of reactions, which can then be translated into mathematical or computational models, in the way SBML [30] is translated into, say, a system of coupled ordinary differential equations (ODEs). In our experience, the equations of a rule-based model typically far outnumber the rules from which they are derived [19,5]. The ability to generate models through automatic interpretation of rules overcomes limitations of writing models manually, which may be impossible. In mathematics, many combinatorial problems that are intractable become tractable when reformulated in terms of generating functions (rules). Here, we have extended methods for rule-based modeling of biochemical systems by introducing a formalism for graphical reaction rules, which can expressively represent biomolecular interactions and the consequences of these interactions. Our main motivation for introducing graphical reaction rules is that such rules allow the connectivity of proteins in a complex to be explicitly and systematically represented. This ability is needed when connectivity affects the reactivity of a complex. A simple example is provided by the case of a bivalent ligand interacting with a bivalent cell-surface receptor. As illustrated in Fig. 4, such a ligand induces the formation of rings and chains of receptors. However, only a chain, such as the protein complex illustrated on the right side of panel (b), can associate with additional ligand or receptor. A ring, such as the protein complex illustrated on the right side of panel (c), can only break apart. Clearly, chains and rings, which may have identical composition and differ only with respect to connectivity, must be distinguished. The most straightforward way of solving this type of problem, we believe, is through the introduction of graphs. The cost of introducing graphs is computational complexity. This cost seems difficult to avoid if one wishes to
Graph Theory for Rule-Based Modeling of Biochemical Networks
103
track connectivity of complexes, which is important for mechanistic modeling of many biological systems. Graphical reaction rules have further representational advantages over other means of summarizing and analyzing biological systems. They can be visualized as cartoon-like diagrams and therefore used for the same purpose as diagrammatic interaction maps [34,1], which are in common use. However, unlike most interaction maps, rules have precise interpretations [16]. A set of well-posed rules unambiguously specifies a reaction network, and a model for this network can be generated through a computational procedure that interprets the rules. Because the procedure is automatic, once rules are specified, very little mathematical or computational expertise is required in principle to obtain a mathematical model. Graphical reaction rules are also close in form to the type of biological knowledge usually available about a system, which may consist mainly of a list of proteins, their functional components, and their binding and catalytic activities, even for a well-studied system. Thus, because graphical rules can be specified essentially by drawing cartoon-like diagrams (an interface that provides this capability is in development) and they provide a natural way to formalize biological knowledge, graphical rules may, with maturation of software, allow more biologists to contribute to the development of mathematical models, which are needed for predictive understanding of biological systems, which are exceedingly complex. Finally, rules for biomolecular interactions may be useful for high-throughput modeling of large numbers of systems and for development of models that include a large number of distinct interacting biomolecules. Rules are independent units of a model specification and sets of rules are compositional, which allows models to be built incrementally. In principle, crude models of a large size could be built at present from information of pairwise protein-protein interactions currently catalogued in electronic databases, such as the Human Protein Reference Database [42]. However, large-scale modeling of higher quality will require cataloging the functional domains involved in interactions and the conditions under which interactions take place. Rules must be expressive enough to encode this information, and graphical rules are a step forward. The independence of rules facilitates not only incremental model building but also the consideration of alternative models and mechanistic hypotheses. For example, to introduce a protein-protein interaction in a system to investigate its effect, one can simply add an appropriate rule instead of adding and modifying possibly large numbers of interrelated equations or lines of code. If rules are stored in a machine-readable format in an electronic database, they can be reused. Rules can be assembled in different ways to define models for different systems, which may share some components, and models for different parts of a larger system can be integrated by combining the corresponding sets of rules. Community standards for storing and exchanging rule-based models of biological systems are currently being discussed [31,22]. 4.1
Related Work
We contribute a new application of ideas from formal systems, graph rewriting, and (sub)graph isomorphism. Our formalism is expressive enough to
104
M.L. Blinov et al.
represent protein-protein interactions. There is probably much room for algorithmic improvement. A general framework for graph rewriting closely related to the present work is that of AGG [49]. Graph rewriting has been used to model diverse biological systems [45] and other systems, such as chemical systems [3] and self-assembling robotic systems [33]. This body of work provided inspiration. A number of research groups have developed various methods for rule-based modeling of signal-transduction systems. A few key references not already cited are [40,44,14]. Software tools related to BioNetGen include STOCHSIM [35], Cellerator [46], Maude [14,48], BIOCHAM [20], and Moleculizer [37]. Others have also suggested, like us, the use of graphs to represent proteins and protein-protein interactions [9,10,48].
Acknowledgements This work was supported by grant RR18754 from the National Institutes of Health and by the Department of Energy through contract W-7405-ENG-36. We thank Joshua Colvin, Andrew Finney, Walter Fontana, Matthew Fricke, Nathan Lemons, Paul Loriaux, Fangping Mu, Richard G. Posner, David C. Torney, and Amitabh Trehan for helpful discussions.
References 1. Aladjem, M.I., Pasa, S., Parodi, S., Weinstein, J.N., Pommier, Y., Kohn, K.W.: Molecular interaction maps—a diagrammatic graphical language for bioregulatory networks. Sci. STKE 2004, pe8. 2. Andries, M., Engels, G., Habel, A., Hoffmann, B., Kreowski, H.J., Kuske, S., Plump, D., Schurr, A., Taentzer, A.: Graph transformation for specification and programming. Sci. Comput. Program. 34 (1999) 1–54 3. Benk¨ o, G., Flamm, C., Stadler, P.F.: A graph-based toy model of chemistry. J. Chem. Inf. Comput. Sci. 43 (2003) 1085–1093 4. Blinov, M.L., Faeder, J.R., Goldstein, B., Hlavacek, W.S.: BioNetGen: software for rule-based modeling of signal transduction based on the interactions of molecular domains. Bioinformatics 20 (2004) 3289–3291 5. Blinov, M.L., Faeder, J.R., Goldstein, B., Hlavacek, W.S.: A network model of early events in epidermal growth factor receptor signaling that accounts for combinatorial complexity. BioSystems (in press). 6. Borisov, N.M., Markevich, N.I., Hoek, J.B., Kholodenko, B.N.: Signaling through receptors and scaffolds: independent interactions reduce combinatorial complexity. Biophys. J. 89 (2005) 951–966 7. Bray, D.: Molecular prodigality. Science 299 (2003) 1189–1190 8. Conzelmann, H., Saez-Rodriguez, J., Sauter, T., Bullinger, E., Allgower, F., Gilles, E.D.: Reduction of mathematical models of signal transduction networks: simulation-based approach applied to EGF receptor signalling. Syst. Biol. 1 (2004) 159–169 9. Danos, V., Laneve, C.: Graphs for core molecular biology. Lect. Note Comput. Sci. 2602 (2003) 34–46 10. Danos, V., Laneve, C.: Formal molecular biology. Theor. Comput. Sci. 325 (2004) 69–110
Graph Theory for Rule-Based Modeling of Biochemical Networks
105
11. Dembo, M., Goldstein, B.: Theory of equilibrium binding of symmetric bivalent haptens to cell surface antibody: application to histamine release from basophils. J. Immunol. 121 (1978) 345–353 12. Efroni, S., Harel, D., Cohen, I.R.: Towards rigorous comprehension of biological complexity: modeling, execution and visualization of thymic T cell maturation. Genome Res. 13 (2003) 2485–2497 13. Ehrig, H., Heckel, R., Korff, M., L¨ owe, M. Ribeiro, L., Wagner, A., Corradini, A.: Algebraic approaches to graph transformation. Part II: single pushout approach and comparison with double pushout approach. In Handbook of Graph Grammars and Computing by Graph Transformation, vol. 1, ch. 4, pp. 247–312 (Eds: Ehrig, H. Kreowski, H.-J, Montanari, U., Rozemberg, G.), World Scientific, Singapore, 1996. 14. Eker, S., Knapp, M., Laderoute, K., Lincoln, P., Meseguer, J., Sonmez, K.: Pathway logic: symbolic analysis of biological signaling. Pac. Symp. Biocomput. (2002) 400– 412 15. Endy, D., Brent, R.: Modelling cellular behaviour. Nature 409 (2001) 391–395bray 16. Faeder, J.R., Blinov, M.L., Hlavacek, W.S.: Graphical rule-based representation of signal-transduction networks. Proc. ACM Symp. Appl. Computing (2005) 133–140 17. Faeder, J.R., Blinov, M.L., Hlavacek, W.S.: Rule-based modeling of biochemical networks. Complexity 10 (2004) 22–41 18. Faeder, J.R., Blinov, M.L., Goldstein, B., Hlavacek, W.S.: Combinatorial complexity and dynamical restriction of network flows in signal transduction. Syst. Biol. 2 (2005) 5–15 19. Faeder, J.R., Hlavacek, W.S., Reischl, I., Blinov, M.L., Metzger, H., Redondo, A., Wofsy, C., Goldstein, B.: Investigation of early events in Fc�RI-mediated signaling using a detailed mathematical model. J. Immunol. 170 (2003) 3769–3781 20. Fages, F., Soliman, S., Chabrier-Rivier, N.: Modelling and querying interaction networks in the biochemical abstract machine BIOCHAM. J. Biol. Phys. Chem. 4 (2004) 64–73 21. Faulon, J.-L.: Isomorphism, automorphism partitioning, and canonical labeling can be solved in polynomial-time for molecular graphs. J. Chem. Inf. Comput. Sci. 38 (1998) 432–444. 22. Finney, A.: Developing SBML beyond level 2: proposals for development. Lect. Note Comput. Sci. 3082 (2005) 242–247 23. Gillespie, D.T.: A general method for numerically simulating the stochastic time evolution of coupled chemical reactions. J. Comput. Phys. 22 (1976) 403–434 24. Gillespie, D.T.: Exact stochastic simulation of coupled chemical reactions. J. Phys. Chem. 81 (1977) 2340–2361 25. Goldstein, B., Faeder, J.R., Hlavacek, W.S., Blinov, M.L., Redondo, A., Wofsy, C.: Modeling the early signaling events mediated by Fc�RI. Mol. Immunol. 38 (2002) 1213–1219 26. Goldstein, B., Faeder, J.R., Hlavacek, W.S.: Mathematical and computational models of immune-receptor signalling. Nat. Rev. Immunol. 4 (2004) 445–456 27. Garey, M.R., Johnson, D.S.: Computers and Intractability: A Guide to the Theory of NP-Completeness, W.H. Freeman and Company, San Francisco, 1979 28. Haugh, J.M., Schneider, I.C., Lewis, J.M.: On the cross-regulation of protein tyrosine phosphatases and receptor tyrosine kinases in intracellular signaling. J. Theor. Biol. 230 (2004) 119–132 29. Hlavacek, W.S., Faeder, J.R., Blinov, M.L., Perelson, A.S., Goldstein, B.: The complexity of complexes in signal transduction. Biotechnol. Bioeng. 84 (2003) 783–794
106
M.L. Blinov et al.
30. Hucka, M., Finney, A., et al.: The systems biology markup language (SBML): a medium for representation and exchange of biochemical network models. Bioinformatics 19 (2003) 524–531. 31. Hucka, M., Finney, A., et al.: Evolving a lingua franca and associated software infrastructure for computational systems biology: the Systems Biology Markup Language (SBML) project. Syst. Biol. 1 (2004) 41–53 32. Kitano, H.: A graphical notation for biochemical networks. BioSilico 1 (2003) 169–176 33. Klavins, E., Christ, R., Lipsky, D.: Graph grammars for self assembling robotic systems. Proc. IEEE Int. Conf. Rob. Autom. (2004) 5293–5300 34. Kohn, K.W.: Molecular interaction maps as information organizers and simulation guides. Chaos 11 (2001) 84–97 35. Le Nov`ere, N., Shimizu, T.S.: STOCHSIM: modelling of stochastic biomolecular processes. Bioinformatics 17 (2001) 575–576 36. Li, Q., Dinner, A.R., Qi, S., Irvine, D.J., Huppa, J.B., Davis, M.M., Chakraborty, A.K.: CD4 enhances T cell sensitivity to antigen by coordinating Lck accumulation at the immunological synapse. Nat. Immunol. 5 (2004) 791–799 37. Lok, L., Brent, R.: Automatic generation of cellular reaction networks with Moleculizer 1.0. Nat. Biotechnol. 23 (2005) 131–136 38. Luks, E.M.: Isomorphism of graphs of bounded valence can be tested in polynomial time. J. Comput. Syst. Sci. 25 (1982) 42–65 39. McKay, B.D.: Practical graph isomorphism. Congressus Numerantium 30 (1981) 45–87. 40. Morton-Firth, C.J., Bray, D.: Predicting temporal fluctuations in an intracellular signalling pathway. J. Theor. Biol. 192 (1998) 117–128 41. Pawson, T., Nash, P.: Assembly of cell regulatory systems through protein interaction domains. Science 300 (2003) 445–452 42. Peri, S., et al.: Development of human protein reference database as an initial platform for approaching systems biology in humans. Genome Res. 13 (2003) 2363–2371 43. Priami, C., Regev, A., Shapiro, E., Silverman, W.: Application of a stochastic name-passing calculus to representation and simulation of molecular processes. Inf. Process Lett. 80 (2001) 25–31 44. Regev, A., Silverman, W., Shapiro, E.: Representation and simulation of biochemical processes using the π-calculus process algebra. Pac. Symp. Biocomput. (2001) 459–470 45. Rosello, R., Valiente, G.: Graph transformation in molecular biology. Lect. Note Comput. Sci. 3393 (2005) 116–133 46. Shapiro, B.E., Levchenko, A., Meyerowitz, E.M., Wold, B.J., Mjolsness, E.D.: Cellerator: extending a computer algebra system to include biochemical arrows for signal transduction simulations. Bioinformatics 19 (2003) 677–678 47. Shimizu, T.S., Aksenov, S.V., Bray, D.: A spatially extended stochastic model of the bacterial chemotaxis signalling pathway. J. Mol. Biol. 329 (2003) 291–309 48. Talcott, C., Eker, S., Knapp, M., Lincoln, P., Laderoute, K.: Pathway logic modeling of protein functional domains in signal transduction. Pac. Symp. Biocomput. (2004) 568–580 49. Taentzer, G.: AGG: a graph transformation environment for modeling and validation of software. Lect. Note Comput. Sci. 3062 (2003) 446–453 50. Ullmann, J.R.: An algorithm for subgraph isomorphism. J. ACM 23 (1976) 31–42