arXiv:0803.2093v1 [cs.MS] 14 Mar 2008
GraphStream: A Tool for bridging the gap between Complex Systems and Dynamic Graphs Antoine Dutot, Fr´ed´eric Guinand, Damien Olivier, and Yoann Pign´e ⋆ LITIS – FST, Universit´e du Havre, 25 Rue Philippe Lebon, BP 540, 76058 Le Havre cedex, France
[email protected] Summary. The notion of complex systems is common to many domains, from Biology to Economy, Computer Science, Physics, etc. Often, these systems are made of sets of entities moving in an evolving environment. One of their major characteristics is the emergence of some global properties stemmed from local interactions between the entities themselves and between the entities and the environment. The structure of these systems as sets of interacting entities leads researchers to model them as graphs. However, their understanding requires most often to consider the dynamics of their evolution. It is indeed not relevant to study some properties out of any temporal consideration. Thus, dynamic graphs seem to be a very suitable model for investigating the emergence and the conservation of some properties. GraphStream is a Java-based library whose main purpose is to help researchers and developers in their daily tasks of dynamic problem modeling and of classical graph management tasks: creation, processing, display, etc. It may also be used, and is indeed already used, for teaching purpose. GraphStream relies on an event-based engine allowing several event sources. Events may be included in the core of the application, read from a file or received from an event handler.
1 From Complex Systems to Dynamic Graphs Biology, Physics, Social Sciences, Economy, etc. yield all examples of systems where a large number of entities, homogeneous or heterogeneous, mutually interact. The emergence of global properties leads the community to qualify these Systems as Complex. This emergence comes from the dynamic of interactions. This dynamic is responsible not only for the building of the properties, which may be consider as a morphogenic process, but also for its maintaining, comparable to a morphostatic process, and as such it should be present in any relevant model. So, regarding Complex Systems, dynamic can be observed at two levels: at the level of the system formation and at the level of system evolution. Both processes may be distinct or may be the same, as Web graphs for instance. To sum up, we may transpose Dobzhansky’s famous maxim: Nothing in biology makes sense, except in the light of ⋆
The authors names are sorted alphabetically.
2
Antoine Dutot, Fr´ed´eric Guinand, Damien Olivier, and Yoann Pign´e
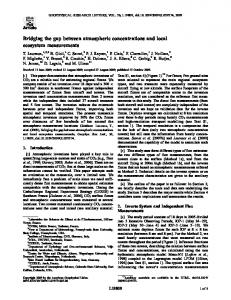
Evolution to Complex Systems: Nothing in Complex Systems makes sense, except in the light of Dynamic of Interactions. Then, performing a relevant study of such Complex Systems requires a dynamic representation, and dynamic graphs impose themselves as the more suitable way of modeling them. Figure 1 illustrates how the main processes leading to the formation and the maintaining of groups within a system composed of many entities in interaction may be observed using a dynamic graph model. In this representation, the vertices of the graph represent entities and the edges represent interactions. During the evolution of the system, both kinds of elements, vertices and edges, may be subject to variations and their characteristics as well.
Fig. 1. This picture represents one zoom in part of a boids-based simulation (on the top) and its representation with a dynamic graph (on the bottom). On the left part, a snapshot of the simulation is proposed. The boids (interacting entities) can only perceive and interact with fellow creatures located in a limited area. During the process, some groups appear corresponding to global structures obtained from local interactions. On the right part of the figure, the graph represents at a given moment the interaction graph corresponding to the state of the system made of boids.
GraphStream: Complex Systems and Dynamic Graphs
3
A Dynamic Graph G(t) = (V (t), E(t)) where t represents the time, is composed of: • •
a set of vertices V (t). This set may change with t. Each vertex v owns a set of characteristics Cv (t) that may vary with time. a set of edges E(t). E(t) may change with t. Each edge eij = vi , vj is defined as a pair of vertices, and owns a set of characteristics Ceij (t) that may vary with time.
Therefore a dynamic graph G(t) may change with the time t. According to the underlying modeled system, a dynamic graph may be considered as a family of graphs or as a complete graph where, according to t some vertices or edges can be zero weighted. There exist however another way of defining a dynamic graph, based on a discrete-time representation, and thus very well suited for most simulations. A dynamic graph can be defined as a finite or infinite ordered set of couples (date, {events}). Every set of events may modify the graph structure/composition/topology and/or characteristics of some graph elements. The different snapshots of Figure 2 correspond to the series of sets of events listed below: (0,{v1 creation, v2 creation, (v1 , v2 ) creation}) (1,{v3 creation, v4 creation, (v1 , v3 ) creation}) (2,{v2 suppression, (v3 , v4 ) creation}) (4,{v2 creation, v5 creation}) (5,{v6 creation, (v5 , v6 ) creation, (v4 , v6 ) creation, (v2 , v4 ) creation, (v1 , v3 ) suppression})
date: t = 0
date: t = 1
date: t = 2
S1
S1
S3
S1
S2
S2
S4
date: t = 3
date: t = 4
S1
S3
S1
S3
S4
S2
S4
S3
S4
date: t = 5 S5
S1
S3
S5
S2
S4
S6
Fig. 2. Snapshots of a Dynamic Graph on the time interval [0, 5]. During a period of time the graph may not change as it is the case during interval [2, 3]. Some vertices may appear and disappear and appear again, as illustrated by vertex s2 . This approach was chosen for the implementation of GraphStream as explained in the forthcoming Section.
4
Antoine Dutot, Fr´ed´eric Guinand, Damien Olivier, and Yoann Pign´e
2 Graphs streams GraphStream [3] is a Java library whose purpose is to create and manipulate dynamic graphs in order to study them and to use them in simulations. The whole library has been devised with the idea that graph will evolve during time. It is also naturally well suited for the manipulation of ”static” graphs. The central notion in GraphStream is that graphs are not static objects, but streams of events, and these streams can flow from producers (simulations, graph generators, graph readers, the web, etc.) passing by filters (a graph structure, a converter, etc.) to outputs (graph writers, a network, a display, etc). There also exist a file format called dgs allowing the expression of graph changes as series of events that can be read by GraphStream. Around this notion, GraphStream provides several tools.
2.1 Packages Graph Representation Tools The main package provided by GraphStream allows the representation of graphs in memory. It is made of a graph interface and several implementation fulfilling different needs or usages. All share the property to handle nicely the dynamics of what they represent. Some of them are able to store arbitrary data in addition to the sole graph dynamic topology, whereas others are made to be small and fast. The library does not force the creation of a graph structure in memory. Several of its tools can handle a flow of events without ever constructing a whole representation of it in memory. For example it is possible to write a filter that will transform a very large graph written on disk into another graph on disk without necessitating a growing amount of memory. Graph Generation Tools Most often, a simulation or observation tool will be used to produce graph events. However the library proposes a bunch of graph generators going from regular graphs like grids and tores, to scale-free graphs, random graphs, etc. It makes it easy to test algorithms on graphs having specific properties. Graph I/O Tools The library can produce streams of events from several file formats read either from a file system or from the internet. This flow of event is not a graph and therefore, it offers the ability to process graphs that are larger than the available memory if no global representation is needed. Similarly, it is possible to feed a stream of graph events toward a file to save it in several formats. A specific format as been create to manage the complete set of graph events, not only the fact that nodes and edges exist, but also that they evolve. Graph Theory Tools The library offers several well known algorithms on graphs and tries, where possible, to propose version of them that can handle the graph dynamics (this is the part of the library that still needs the more work, though, and can provide some interesting problems). For example, the connected components count algorithm not only is able to count the number of connected components of the graph, but is able to track it without having to recompute all the connected components count as the graph evolves. An important field of research named re-optimization aims at maintaining a previous result and recomputing parts of a solution when a changes occur in the environment. The
GraphStream: Complex Systems and Dynamic Graphs
5
idea being that the re-optimization of a previously obtained result is more efficient than re recomputing of the solution from scratch. An example of successful re-optimization algorithm can be found with the Dynamic Shortest Path Problem [2]. Graph Visualization Tools The library is equipped with display capabilities. It makes it easy to display any graph structure either on the local machine or even on a distant one. The viewer understands various style attributes (colors, dashes, arrows, labels on nodes and edges, icons). It is equipped with an optional automatic layout engine that can compute optimal node positions in order to make the graph as visible as possible (by avoiding edge crossing). This engine handles the graph dynamics and constantly reorganises as the graph evolves.
2.2 Example Creating and visualizing a graph using GraphStream is more than easy. Indeed, the following piece of code creates a graph made of 3 vertices and 3 edges and open a window for visualizing it, the whole in only 8 lines of code. The result is shown Fig. 3). The positions of vertices are automatically computed in order to enhance the display. This helper can however be avoided by replacing the ”true” boolean value by ”false” in the parameters of Graph() constructor. import org.miv.graphstream.graph.*; public class Easy1 { public static void main( String args[] ) { Graph graph = new Graph( false, true ); graph.addEdge( "AB", "A", "B" ); graph.addEdge( "BC", "B", "C" ); graph.addEdge( "CA", "C", "A" ); graph.display(); } }
Fig. 3. The GraphStream viewer.
6
Antoine Dutot, Fr´ed´eric Guinand, Damien Olivier, and Yoann Pign´e
2.3 Suitability for Complex Systems Simulations GraphStream is built upon an event-based engine and its whole conception is objectoriented, each element of the graph (nodes and edges) but also each attribute that qualify these elements are objects. These features allow an easy prototyping and simulation of systems made of sets of interacting entities. In particular: • •
•
discrete-time simulations are easy to implement by associating an event to each time increment, the object approach allows a decentralized point of view that prevails over centralized approaches for Complex Systems modeling since interactions between entities are mainly characterized by their locality, finally, the library offers a lot of classical graph theoretic algorithms that may help for the analysis of interactions graphs.
In order to illustrate these claims, in the sequel an example of application in the fields of wireless telecommunication networks is developed.
3 Case study: Wireless Mobile Networks 3.1 Mobile Ad Hoc Networks Nowadays almost all notebooks are equipped with wireless communication materials. These devices, that are also present in many smartphones and PDAs, are able to perform communications in two modes: infrastructure or ad hoc. In the former mode, the stations (computers, mobiles phones, PDAs, etc) communicate with each others via an access point. This access point manages the communications in the Wireless LAN and acts as a gateway for communications outside of the local network. This mode is usually used at home or in public places. In ad hoc mode, no access point is necessary for performing communications, stations ”simply” broadcast their messages in their neighborhood. Such networks are called MANETs (Mobile Ad hoc NETworks) and when the assumptions allow the network to be partitioned, we call them DTMANETs, meaning Delay Tolerant or Disruption Tolerant MANETs. Although it is not commonly used, ad hoc mode presents some advantages. In particular neither infrastructure nor network administration are required, and this mode is especially well-suited for mobility [5]. However, classical network problems like broadcasting or routing have to be revisited because stations may move in their environment, they may also be turned on or off at any moment such that the topology of the network changes while the operation is performed. The complexity of these systems comes from the mobility of stations. Indeed, as stations move according to the behavior of humans, situations occurring in real life (traffic jams, groups of people at one moment at one place, etc) also occur within such networks. The suitability of GraphStream for that task is obvious since the communication network is dynamic and can be modeled with a dynamic graph and from a station’s point of view the network as a whole does not exist, each station only knows the stations that are within their neighborhood, that is the network as a whole is only a representation, it is actually decentralized.
GraphStream: Complex Systems and Dynamic Graphs
7
3.2 Implementation choices In the context of this example we are interested in testing algorithms that build spanning forests within DT-MANETs. Indeed, spanning forests may be used as a basic structure for different operations like routing or broadcasting messages between stations. There exist at least two ways for performing such a task. The first option consists in relying on an existing DT-MANET simulator and to gather for each time slot events like: station si turns on, stations sj and sk are in mutual communication range, etc. The second option consists in rebuilding a simulator from scratch using GraphStream. Because we already have at our disposal such a simulator (Madhoc [4]), we choose the first solution. The whole process for testing algorithms first recover events from a run of Madhoc and keep them in a file. The IO part of GraphStream is used to read this file and generate the events accordingly by associating to each station a node and to each communication link an edge. GraphStream is also used to simulate the Spanning Forest Algorithm. So as to benefit the Object oriented approach of the library, the algorithm was modeled consequently. Before entering in more details, let us described the method for building and maintaining a spanning forest in a dynamic graph.
3.3 Building and Maintaining a Spanning Forest The Spanning Forest Algorithm [1] is a mechanism based on a set of rules that are applied on each station of the network in a fully decentralized way. The application of these rules, locally by each station, results in the marking of a set of edges of the graph that form a spanning forest. In the best case, the process leads to one single tree for each connected component of the graph. Since the process is repeated (the rules) all the time, it adapts to the dynamics of the network. The root of each tree corresponds to a node owning a token. Each token moves along the constructed tree. After a local synchronization process with its neighbors, each station executes 4 rules: •
• • •
Rule 1: An edge belonging to the tree has been removed. At this moment, the tree is split in two. This rule applies to the node belongs to the part of the tree where there is no token (no root). So the node creates a token on itself (a new root). Rule 2: An edge is removed on the tree and the node is part of the tree where the token is. Rule 3: Two nodes with tokens meet. One of the two tokens disappears and the two trees merge. Rule 4: This last rule makes the token move along the tree.
For the purpose of the simulation with GraphStream, an agent-based model as been used. The 2 first rules of the above model can be implemented as a reaction to edge events. Rule 4 is pro-active and defines the movement of the token. Rule 3 is executed as a consequence to rule 4. The concept of token is modeled as an agent that traverses the network. Fig. 4 shows a graphical representation of such a network with the Spanning Forest Algorithm running on it.
8
Antoine Dutot, Fr´ed´eric Guinand, Damien Olivier, and Yoann Pign´e
Fig. 4. A graphical view of a MANET. Black thick links are colored by the Spanning Forest Algorithm and belong to the forest. Bigger node are the ones owning a token, they are the roots or the spanning trees.
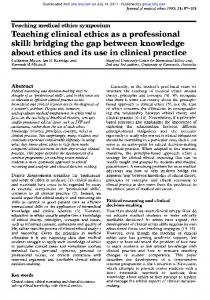
3.4 Measurements The real gain in using GraphStream with such an algorithm is that it allows both the decentralized point of view necessary for the algorithm and the centralized measurements that give an interesting analysis of its behavior. An example of the measurements made thanks to the library can be observed on Figure 5. This chart represents the evolution of some measures made on the trees constructed with the defined algorithm. This evolution is observed here according to the size (number of nodes) of the trees.
GraphStream: Complex Systems and Dynamic Graphs
9
Fig. 5. Evolution of the average diameter and the average degree of inner nodes of trees. The small top left chart represents the number of trees w.r.t. their size.
4 Conclusion A new dynamic graph representation and manipulation library was presented in this paper. The originality of the approach rests in the way dynamics is handled in graphs. The idea of a stream of events for the dynamics and the general object oriented outlook of the library give it a special ability to be used as a distributed and dynamic environment simulator. GraphStream also advertises more classical tools for analyzing static and dynamics graphs. The usefulness of the library was shown with the modeling and the simulation of a decentralized algorithm. In this simulation GraphStream was used as a simulator. It was also use to perform an analyze of the behavior of the algorithm with graph theory measurements.
References 1. A. Casteigts. Model driven capabilities of the da-grs model. In International Conference on Autonomic and Autonomous Systems (ICAS’06), San Francisco, USA, 2006. IEEE. 2. C. Demetrescu and G. F. Italiano. Fully dynamic all pairs shortest paths with real edge weights. In IEEE Symposium on Foundations of Computer Science, pages 260–267, 2001.
10
Antoine Dutot, Fr´ed´eric Guinand, Damien Olivier, and Yoann Pign´e
3. A. Dutot, Y. Pign´e, and F. Guinand. The graphstream java dynamic graph library, http://graphstream.sourceforge.net. 4. L. Hogie. Mobile Ad Hoc Networks: Modelling, Simulation and Broadcast-based Applications. PhD thesis, University of Luxembourg and University of Le Havre, april 2007. 5. L. Hogie, F. Guinand, G. Danoy, P. Bouvry, and E. Alba. Simulating realistic mobility models for large heterogeneous manets. In E. Alba, C.-F. Chiasserini, N. Abu-Ghazaleh, and R. L. Cigno, editors, The 9-th ACM/IEEE International Symposium on Modeling, Analysis and Simulation of Wireless and Mobile Systems (MSWIM 2006)., page 12 pages, Torremolinos, Malaga, Spain, October 2-6 2006. ACM press / IEEE Computer Society.