Computer Supported Cooperative Work (2008) 17:353–393 DOI 10.1007/s10606-008-9080-9
© Springer 2008
The CACHE Study: Group Effects in Computer-supported Collaborative Analysis Gregorio Convertino1, Dorrit Billman2,5, Peter Pirolli2, J. P. Massar3 & Jeff Shrager4 1
College of Information Sciences and Technology, Penn State University, University Park, PA 16802, USA (E-mail:
[email protected]); 2Palo Alto Research Center, 3333 Coyote Hill Road, Palo Alto, CA 94304, USA (E-mail:
[email protected]); 3Berkeley, CA, USA; 4Symbolic Systems Program, Stanford University, Stanford, CA 94305, USA (E-mail:
[email protected]); 5 Center for Study of Language and Information, Stanford University, Cordura Hall, Rm 110, Stanford, CA 94305, USA (E-mail:
[email protected]) Abstract. The present experiment investigates effects of group composition in computersupported collaborative intelligence analysis. Human cognition, though highly adaptive, is also quite limited, leading to systematic errors and limitations in performance – that is, biases. We experimentally investigated the impact of group composition on an individual’s bias, by composing groups that differ in whether their members initial beliefs are diverse (heterogeneous group) or similar (homogeneous group). We study three-member, distributed, computer-supported teams in heterogeneous, homogeneous, and solo (or nominal) groups. We measured bias in final judgment, and also in the selection and evaluation of the evidence that contributed to the final beliefs. The distributed teams collaborated via CACHE-A, a web-based software environment that supports a collaborative version of Analysis of Competing Hypotheses (or ACH, a method used by intelligence analysts). Individuals in Heterogeneous Groups showed no net process cost, relative to noninteracting individuals. Both heterogeneous and solo (noninteracting) groups debiased strongly, given a stream of balanced evidence. In contrast, individuals in Homogenous Groups did worst, accentuating their initial bias rather than debiasing. We offer suggestions about how CACHE-A supports collaborative analysis, and how experimental investigation in this research area can contribute to design of CSCW systems. Key words: CACHE, collaboration, intelligence analysis, CSCW, group bias, group decisionmaking
1. Introduction The need for better ways to support intelligence analysis is clear from recent events (e.g., The United States 9/11 Commission 2004). Intelligence analysis is made particularly difficult both by the intrinsic complexity of the task and by the cognitive limitations of analysts. Especially problematic are biases inherent in human reasoning. Both collaboration and technology are often suggested as ways
354
Gregorio Convertino et al.
of enhancing human judgment in complex decisions (e.g., Johnston 2003 on teamwork; Card 2005 on external aids). However, the structures of collaboration can vary significantly, and it is not known which collaborative structures are most effective for debiasing, particularly in the context of computer-supported intelligence analysis. Our work investigates the impact of group structure on debiasing judgment and is motivated by studies of individuals and groups over several decades (e.g., Kahneman et al. 1982; Heuer 1999; Kerr and Tindale 2004). These studies have provided a richer understanding of bias (systematic departures from an ideal standard) that occurs in human judgment and decision-making under uncertainty. This understanding informs research in computer-supported cooperative work (CSCW): design of CSCW systems benefits from an understanding of the component processes and their outcomes, at an individual and group level. The present experiment exploits a novel CSCW system that we developed. This system is used as a test bed for studying the effects of group composition on the quality of the intelligence analysis. We also evaluate the use of this prototyped collaborative software, which was designed to help analysts leverage one another’s reasoning and fluently support transitions among varying work configurations. In the next sections, we review literature on bias in decision-making and we identify key factors that make collaborative analysis a complex task. We then present an experiment that investigates one aspect of collaborative analysis: How group composition affects the performance of group members. Participants work in a computer environment that is a simplified version of a collaborative analysis system called CACHE (Collaborative Analysis of Competing Hypotheses Environment; Shrager 2005). We investigate the impact of group composition on bias and on coverage of relevant information. We also comment on system usability and design. 2. The study of bias In this section we organize the research on bias by whether the individual or group is the focus and by whether or not the focus is on supporting tools, as shown schematically in Figure 1. We first consider research on biased cognition by unaided individuals, and then discuss the efforts that have been directed toward enhancing the cognition of individuals through methods or technology. Then we address whether and when a group improves performance over individuals on challenging cognitive tasks. Finally, we consider recent research that attempts to enhance performance of groups through methods or technology. 2.1. Bias in individuals Human cognition, though highly adaptive, is also quite limited, leading to systematic errors and limitations in performance – that is, biases. Psychologists have demonstrated response patterns indicating several forms of bias, including
Group Effects in Computer-supported Collaborative Analysis
355
Figure 1 Map of the research space on bias by level of analysis and support. The Y-axis indicates the size of the decision-making unit, from individual to large community. The Xaxis indicates the degree of support for decision-making, from unsupported to supported by both complex systems and methods. Prior literature most relevant to our work (“CACHE study,” top right) is mapped onto this research space.
representativeness, availability, framing, and confirmation biases (e.g., Kahneman et al. 1982; Wason 1960). Furthermore, errors resulting from biases that occur in a single judgment or decision may be amplified by chained inferences, where the output of one decision serves as input to the next (Gettys et al. 1982). For example, Johnson and Halpin (1974) working in an intelligence domain found that estimates became increasingly extreme, relative to a Bayesian standard, as the number of intermediate inferences increased. An important source of bias pertains to time and order of information. People tend to over-commit to explanations, hypotheses, or choices that are encountered or preferred early in the process. Various factors can contribute to overly strong commitment to prior beliefs. Researchers have shown that people tend to hold too strongly to an initial value, which acts as a reference point (an anchor); then the subsequent adjustments made with respect to this point are typically insufficient
356
Gregorio Convertino et al.
to fully account for new information (anchoring heuristic, Tversky and Kahneman 1974). People may also expend too little effort in generating alternative possibilities (Heuer 1999). The selection or processing of new evidence to assess a belief may favor an initial, preferred option (Wason 1960; Klayman and Ha 1987). Finally, the integration of information selected to reach a decision may be biased (Benjamin 1990). In this paper, we will refer broadly to overly strong commitment to an early favorite as confirmation bias. Understanding biases is particularly important if the biases result in significant departures from sound (normative) reasoning. A key issue is the identification of normative outcomes or procedures to which human judgment can be compared. Identification of the normative outcome or procedure is often difficult. For example, how strongly should a scientist stick with a current theory, explaining away surprising results as due to methodological problems (Fugelsang et al. 2004)? How strongly should an analyst hold to accepted geopolitical explanations (Johnston 2005)? As a consequence, most research has been done in the laboratory with simple materials and tasks which can be more easily controlled. One of the methods for assessing bias is whether judgments are influenced by factors that are normatively irrelevant to the task. For example, in many contexts the order in which an individual personally encounters evidence is irrelevant to its importance; critical facts may turn up early or late in a case. Thus, if a piece of evidence is encountered earlier, it should not be weighted more or less than if encountered later. Order of presenting evidence in fact produces a variety of order effects (Chapman et al. 1996; Kerstholt and Jackson 1998; for a review see Hogarth and Einhorn 1992). For example, heavy reliance on early evidence is likely for long sequences of evidence. Researchers studying naturalistic decision-making have questioned both the relevance of traditional characterizations of bias and whether cognitive biases identified in laboratory tasks negatively affect the performance of actual experts or skilled workers in their own domain of expertise (Lipshitz et al. 2001). Indeed, in the domain of military intelligence Tolcott et al. (1989) suggest that biases may be lessened for more expert decision makers. While the extent and nature of bias by experts certainly varies by domain (Shanteau 1992) and task, expert performance remains biased in many circumstances. Of relevance is, specifically, the biased performance identified in a variety of professional tasks that require reflection on and analysis of extensive information in circumstances with considerable novelty and change (e.g. for auditors Davis and Ashton 2002; for medical doctors Bornstein and Emler 2001). In addition, researchers have sought to create laboratory experiments that are analogs of work tasks by placing domain practitioners in settings with realistic materials and activities. For example, researchers (Adelman et al. 1993; Perrin et al. 2001) have found effects of presentation order on judgments of air defense personnel working on a naturalistic plane classification task. These studies provide complementary
Group Effects in Computer-supported Collaborative Analysis
357
support for concerns raised in professional practice based on broader but less formal evidence (e.g., Heuer 1999; Johnston 2003, 2005). Experts have extensive knowledge and entrenched beliefs. This is usually helpful, but may itself create bias through over-commitment to these beliefs (the paradox of expertise, Camerer and Johnson, 1991; Johnston 2005). Further, experts in many domains are faced with novel tasks, much potentially relevant information, high expectations for performance, and ambiguous performance criteria. This is often the case for intelligence analysts. These work conditions may encourage shortcuts and restrict careful analysis. Indeed, practitioners may lack procedures that are both effective and unbiased. In sum, confirmation bias in our broad sense is widespread; it occurs in a wide range of settings including those with high stakes, and both laypeople and professionals are vulnerable. Thus, developing methods and tools that support effective and unbiased performance is an important goal for CSCW research and design. 2.2. Bias in individuals supported by methods or technology Technology support offers one approach to improving professional judgment in the face of the many challenges to unbiased thinking. This may be as simple as a checklist to support memory in critical aviation tasks. However, support is often more complex than that, and many computerized decision support systems have been developed to aid various task components (for a review Keefer et al. 2004; particularly on bias Arnott 2006). Many of these tools rely on the user’s ability to formalize and quantify judgments, and often focus on a narrow aspect of a reasoning task, such as reminding or explicit value elicitation. Moreover, although there are many decision support systems available (see George et al. 2000 on bias; Keefer et al. 2004 on decision analysis), virtually none supports the full set of functions needed by analysts. In this respect, Scholtz et al. (2006) discuss some of the methodological challenges when collections of software tools are developed and assessed, for intelligence analysis. However, even with technological support the performance by individuals performing challenging cognitive tasks is still limited and biased, and these problems are particularly acute in intelligence analysis. Responding to problems in intelligence analysis, Heuer (1999) not only identified cognitive biases that impair performance, but also made a wide set of recommendations. He particularly defines a semi-formal method that he calls ACH – Analysis of Competing Hypotheses. ACH is based upon the classical method of decision matrices. The analyst develops a full set of alternative (competing) hypotheses, which form the columns of a decision matrix, and the available evidence which forms the rows (Figure 2, Section 5.2). Each cell of the resulting matrix represents the relation between a piece of evidence, and a particular hypothesis.
358
Gregorio Convertino et al.
Figure 2 Alpha’s ACH matrix. Three hypotheses are listed in the column headings. The pieces of evidence are listed along the rows. The cells indicate consistent and inconsistent values for the relations between a piece of evidence and a hypothesis.
To reduce bias, analysts trained in the ACH methodology are supposed to focus on inconsistent evidence rather than on consistent evidence, and on diagnostic evidence – which maximally discriminates hypotheses from one another – rather than on uninformative evidence. Moreover, Heuer encourages analysts to evaluate the relation of a piece of evidence (row) to all the alternative hypotheses (columns). The ACH method was investigated by Cheikes et al. (2004) who found that intelligence analysts working alone showed less bias favoring their initial expectation when they used the ACH method than when using their default methods. ACH0 (Pirolli et al. 2005) is a desktop reasoning tool that supports a significant portion of the ACH method. It provides an ACH Hypotheses-byEvidence matrix with cells that indicate the relationships between evidence and hypotheses. ACH0 provides automatic computer integration of the user-entered cell values to derive a support measure for each alternative hypothesis. This tool has been adopted and used by a part of the intelligence community. ACH0 may benefit analysts by providing an easy-to-use, external representation that can be shared by individuals working on the same or related problems. Pirolli et al. (2005) studied the ACH method used by individuals and compared performance using a prototype of the ACH0 software versus paper and pencil ACH analysis. Pirolli, et al. asked US Navy post-graduate student analysts to analyze a simulated intelligence problem, and found trends, but not significant differences between the two platforms (software ACH vs. paper and pencil ACH). The CACHE-A system, used in the experiment reported in this paper, extends the
Group Effects in Computer-supported Collaborative Analysis
359
ACH0 individual prototype to support collaborative intelligence analysis (see description of CACHE-A in Section 5). 2.3. Bias in groups One route to improving performance on challenging cognitive tasks is to form groups of individuals working together. Indeed, many complex cognitive tasks can only be solved when people work together. However, groups introduce their own coordination and process costs (i.e., group process losses) which cut into a group’s potential performance (e.g., on bias, Kerr et al. 1996; on process losses review by Kerr and Tindale 2004). For example, one member cannot talk while also listening to another, leading to production blocking (e.g., Gallupe et al. 1991). Group work not only incurs group costs, but also bias. One source of bias in groups is persistence of biases found with individuals. Tolcott et al. (1989) studied interacting pairs of intelligence analysts who considered alternative ways in which a scenario might unfold as additional evidence arrived. These experts were given initial information favoring one or another alternative. Their final judgments remained influenced by information received first, rather than the overall weight of evidence. This result exemplifies anchoring and confirmation biases in pairs. A second source of bias in groups emerges from group-level processes (e.g., see review by Kerr et al. 1996). Group discussion is often biased to focus on information shared by groups members (review by Stasser and Titus 2003). In discussions where some information is held by all group members, and other information is held only by some, the information that is shared is more likely to be mentioned and discussed more than the information that is unshared (e.g., Larson et al. 1994). Information held by only one member, even if critical, has fewer chances to inform the collective judgments. This is known as the common knowledge effect (Gigone and Hastie 1996). These biases undercut one of the potentially most powerful benefits of groups: bringing together diverse expertise, skills, or knowledge. A key factor that influences bias in groups is group composition. Diversity of group members is an important predictor of group performance. Schultz-Hart et al. (2000) found that face-to-face groups with heterogeneous initial beliefs about decision alternatives exhibited less confirmation bias than groups with homogeneous initial beliefs. Further, performance in heterogeneous groups was less biased than that of individuals working alone (analyzed as a statisticized group). Moreover, structural diversity in the group can increase the exposure of members to different sources of task information, as shown in a large business field study (Cummings 2004). The chances of better performance increase when more knowledge is shared among diverse group members and with others in the organization (e.g., van Knippenberg and Schippers 2007). However, diversity
360
Gregorio Convertino et al.
may involve additional costs for building common ground among group members and collaborative technology can play a key role in reducing these costs. 2.4. Bias in groups supported by methods or technology Just as the performance of individuals may be enhanced by technology, the performance of groups may be as well, and developing such technology is a broad goal of our research. To date, two main opportunities have motivated research on technological support for groups: new forms of collaboration and more efficient forms of collaboration. First, computer support augments colocated collaboration and enables distributed collaboration, either synchronous or asynchronous, allowing ways to collaborate not otherwise possible. Second, computer support for groups, whether co-located or distributed, synchronous or asynchronous, can reduce some of the process costs. Group decision support systems and appropriate task structure can reduce process losses and increase process gains in groups relative to unsupported, face-to-face groups (Nunamaker et al. 1991). Reagan-Cirincione (1994) found that computer support and a group facilitator could improve the accuracy of group judgment. The combination of integrated group facilitation, social judgment analysis, and information technology succeeded in neutralizing process costs and enabled group gains. In particular, small groups performed significantly better than their most capable members on two cognitive conflict tasks. However, as with technological support for individuals, the pattern of success is complicated. An extensive review comparing computer-supported groups with face-to-face groups found that the majority of studies showed no performance difference between supported and unsupported groups (Fjermestad and Hiltz 2001). The effects of medium are presumably moderated by other variables such as group composition, task type, data, and structure of the collaborative process (e.g., Straus and McGrath 1994). Broadly, the research shows that group decision support systems can increase the flexibility of group work (i.e., distributed work) and can improve performance on idea-generation tasks such as brainstorming (e.g., Dennis and Valacich 1993; Gallupe et al. 1991). On the other hand, groupware conditions have shown worse performance in measures such as completion time and efficiency, especially when the task requires close coordination (e.g., Straus and McGrath 1994; Kerr and Tindale 2004). Such mixed results have tempered enthusiasm about technologically supported group work, but have also lead to grounding the research and design efforts on more explicit conceptual models of group process (e.g., Kraut 2003). Later research has tried to address more specific questions. Of particular relevance to our work are the studies that investigated how a specific bias might be reduced by a specific tool. Collaborative software has been developed to address specific group- and individual-level biases. Dennis et al. (1997) developed a group decision support
Group Effects in Computer-supported Collaborative Analysis
361
system targeting the group-level bias of discussion favoring shared information (e.g., Stasser and Titus 2003). They found that their technology benefited or harmed group performance depending on the distribution of members’ opinions in the group: technology helped only when there was a minority/majority split of opinion. Hightower and Sayeed (1995) also investigated the problem of biased discussion and found that the benefit of technology interacted with group factors; for example, biased discussion occurred especially in computer-mediated communication with high information load and with more shared information. Lim and Benbasat (1997) developed groupware tools for reducing the individual-level biases of representativeness and availability and for supporting group decision-making. They studied small decisions-making groups. In a first study, they evaluated the impact of technology support on representativeness bias. The technological support consisted of a computer-mediated communication tool aiding group needs, and a representation tool aiding individual needs. Use of the representation tool reduced the representativeness bias. In another study, Benbasat and Lim (2000) evaluated the effects of technology support on availability bias. In that study an electronic brainstorming tool and electronic mail software were used. Each tool increased the attention paid to items that had low availability, and thus reduced the availability bias. A few researchers have begun designing and testing tools and methods for reducing confirmation bias in asynchronous collaboration (Cho 2004; Cho and Turoff 2001; Smallman 2008). Cook and Smallman (2007) found that a graphical visualization of evidence reduced the confirmation bias of trainee intelligence analysts who work on individual analysis problems. The pragmatic need to improve performance in complex analysis tasks motivated these researchers to develop a collaborative software environment called JIGSAW (Smallman 2008), which seeks to support analysts at different stages of the collaborative task. In addition to graphical visualizations, the system includes shared work areas for initial clarification of the task and for posting of relevant facts by multiple, distributed analysts. In these ways JIGSAW is similar to our CACHE platform, which was used in the experiment described below. 3. Characterization of analysis tasks Analysis tasks span very different domains of expertise. An intelligence analyst of a national defense department might assess political stability in a region of the world. A public health analyst might assess epidemiological scenarios about person-to-person transmission of a contagious disease. A business intelligence analyst might assess the future impact of a new product or the viability of a new start-up in a given market. Domains each carry important distinctive properties; for example, intelligence analysis must address active intent to deceive in a way scientific domains need not. However, regardless of the domain, analysis tasks involve formulating judgments about a complex problem on the basis of evidence
362
Gregorio Convertino et al.
and assumptions. Analysis is typically developed and shared collaboratively through written communication, but is constrained by needs for privacy and security as well as the need to share. Further, different collaborating groups and different mixes of collaboration and individual work may be needed at different points in analysis. The challenges in accurately carrying out intelligence analysis have been noted by Trent et al. (2007). Card (2005) has characterized the analysis process as a set of iterated subprocesses, which often occur in parallel. Specifically, Pirolli et al. (2004) suggest that two interacting loops can be identified in the analysis task: (1) an information foraging loop that involves gathering and filtering relevant evidence, and (2) a sense making loop (Russell et al. 1993) that involves the development of hypotheses and interpretations that explain or account for the evidence. We note six core needs or “pain points” in analysis, and how technology might address each need:
&
&
&
&
Large amounts of information. The quantity of relevant information can overwhelm analysts’ limited information processing capacity. Technology can aid managing this information through customized tools for retrieving and filtering relevant data, aggregating and annotating information, organizing and structuring content, tracking the evolution of judgments, and aiding memory. Heterogeneous types of information. The epistemic status of information differs and hence its role in analysis: direct evidence; interpretation of evidence; hypotheses; judgment of evidence–hypotheses relationship; judgment of relevance and accuracy of evidence; analyst’s background knowledge; aims of the analyst; etc. Technology can provide dynamic representations that distinguish and relate different types of information (see, for example, the distinction between evidence in the rows and hypotheses in the columns of an ACH matrix, Figure 2). Unbiased integration of information. Analysts’ expertise lets them perceive meaningful patterns and use higher-order principles to solve problems; however they are still affected by systematic biases. Indeed, the specificity of their expertise can overly narrow their attention to one set of data or perspective. Technology can help analysts compensate for identified biases (e.g., aiding use of unshared information) or alert analysts about threats to a final unbiased decision (e.g., flagging the tendency to confirm initial beliefs). Probabilistic, multi-stage inference. Analysts make chains of probabilistic inferences in which a prior inference is input to the next inferential stage (Johnson and Halpin 1974). Representation tools have a critical role in reducing such error at the individual level (Lim and Benbasat 1997). Collaborative systems can also reduce error by supporting group-level and community-level checks. Collaborative technology can help analysts to check one another, to make the problem decomposition visible, and to track and update dependencies among parts. Technology can increase the
Group Effects in Computer-supported Collaborative Analysis
&
&
363
collective awareness of inconsistencies and promote active, group selfcorrection (e.g., balancing the contributions from different members during the analysis process). Justifications and information about provenance. Meta-information about the source and reliability of information (provenance) should be available for inspection when developing or defending judgments. Further the status of information and of source can change, for example, when the provider of a piece of evidence discredits it. Collaborative technology could dynamically track provenance and support use of provenance in collaborative reasoning and evaluating arguments. Multiple, dynamic modes of work. Even within a given task, an analyst may shift among tightly coupled discussion, loosely coupled information sharing, and working independently of others. Such transitions add to the overhead of coordination and can cause repeated losses of context, particularly when transitions force the analyst to switch among tools (e.g., personal notepad, phone, email, shared database). Collaborative technology can provide an integrated task environment that preserves useful contextual information as analysts move across the various work modes: multiple tools in an integrated environment can allow analysts to dynamically select the set of tools that best support the current work mode.
4. Goal, hypotheses, and design of experiment The goal of this experiment was to investigate the impact of group composition on judgment bias and on information coverage in small distributed groups supported by collaborative software. Our general hypothesis was that the members of groups with diverse initial beliefs about the analysis would collectively explore more of the evidence space and better counter cognitive biases. Schultz-Hart et al. (2000) found that groups homogeneous with respect to the members’ initial beliefs (i.e., prior to group discussion) are more biased than heterogeneous groups. Note that this study investigated face-to-face teams working on a simple decision-making task and measured bias only during the selection of the evidence. We studied bias in the context of computer-supported collaboration. Our experimental task involved loosely rather than tightly coupled collaboration (see work coupling in Neale et al. 2004). The collaborators shared and discussed evidence and analyses in developing their individual product. The task product was the set of individual analyses rather than a single group product or decision. The interdependencies to be managed pertained to shared resources and process: the members analyzed the same body of evidence, synchronously developed individual analyses, iteratively accounted for the collaborators’ analyses and updated their beliefs as new evidence was analyzed and discussed. Our
364
Gregorio Convertino et al.
collaborative technology supported individual work and sharing, distribution, and discussion of this work across the distributed group. We extended prior research in several ways. First and most importantly we developed an environment for collaborative analysis, CACHE-A, described below, and used this as our test bed to investigate computer-supported, rather than face-toface collaboration. Thus, in terms of the quadrants in Figure 1, our study investigates collaboration with small, distributed groups and rich technology support (note that the general CACHE architecture is designed to support a distributed community). Second, we used a realistic, moderately complex analysis task, unfamiliar to our participants. We developed an experimental analysis task containing multiple hypotheses and many conflicting pieces of evidence; this invites complex reasoning about disconfirmation, negative evidence, and multiple alternatives, typical of many naturally occurring decisions. Because participants were unfamiliar with the particular problem scenario and we had a flexible evidence pool, we could induce and control alternative biases in our participants. This task was designed both to provide experimental control and to model important and under-investigated aspects of intelligence analysis tasks. Third, we studied bias (and bias change) not only at the level of evidence item selection but also at the level of summative judgments (i.e., beliefs about hypotheses); we also collected information about the decision making process, including evidence selection, assessment, and integration. In addition to testing the effects of our manipulation, this study also provided our first opportunity for user feedback and assessment of the prototype. We induced an initial bias in the beliefs of individual participants (i.e., Initially Preferred Hypothesis). On this basis we manipulated the group composition to form groups with heterogeneous or homogeneous members’ initial beliefs: this is the Initial Belief factor in the experimental design. Consistently with prior research, we included groups of non-interacting individuals – called solo or nominal groups. We asked how an individual’s performance was affected by the composition of their group and we predicted that: – Heterogeneous groups would show less confirmation bias than Homogeneous groups. Because CACHE-A supports sharing and comparing information among participants, the heterogeneous groups should mitigate cognitive biases by exposure to (1) more and more balanced evidence and (2) a more diverse set of judgments. – Heterogeneous groups would show no net process loss relative to the Solo/ Nominal Group. Because CACHE-A mitigates the process costs, heterogeneous group should show equivalent or better performance. 4.1. Factors Group Condition was a between-subjects factor with three levels: Homogeneous, Heterogeneous, and Solo (or Nominal) groups of three individuals.
Group Effects in Computer-supported Collaborative Analysis
365
Initial Belief was a between-subjects three-level counterbalancing factor, orthogonal to Group Condition. Table 1 shows the assignment of the participants to Group Condition and Initial Belief (Initially Preferred Hypothesis: H1, H2, or H3). In the Heterogeneous condition, the three group members each had a different Initial Belief or preferred hypothesis (i.e., H1, H2, H3). In the Homogeneous condition, the three group members all had the same Initial Belief (e.g., H1, H1, H1). In the Solo, or Nominal, condition individuals did not interact; for purposes of experiment running, sets of three individuals were scheduled together and assigned heterogeneous initial beliefs. However, these individuals could be equally assigned post hoc to “groups” with homogeneous or heterogeneous Initial Belief (see statisticized groups in Schultz-Hart et al. 2000). Judged Hypothesis was a within-subjects, counterbalancing, three-level factor. Participants entered responses for each of the three hypotheses (e.g., in the columns of an ACH matrix: H1=friction, H2=over-ram, and H3=suicide). Judged Hypothesis identifies which hypothesis. Block was a within-subjects, four-level factor. The evidence was presented in four blocks. After each block the participants rated their belief (i.e., degree of confidence) in the three hypotheses. 4.2. Response variables Bias Measures: (1) Rated Belief in the preferred hypotheses (in the CACHE matrix) and its change over blocks of evidence were our most general measures of bias. (2) Additional bias measures were derived from components of the final ACH matrix: the amount of positive evidence included in the matrix (Inclusion), Table 1 Assignment of participants to initially preferred hypothesis and condition. Preferred hypotheses/condition
Group number
Members’ preferred hypotheses
Heterogeneous
Group 1 Group 2 Group 3 Group 4 Group 5 Group 6 Group 7 Group 8 Group 9 9 groups
H1 H2 H3 H1 H2 H3 H1 H2 H3 H1 H1 H1 H2 H2 H2 H3 H3 H3 H1 H1 H1 H2 H2 H2 H3 H3 H3 27 participants
Homogeneous
Solo
Total
H1, H2, H3 in the rightmost column indicate members’ initial bias toward Hypothesis 1 (friction), Hypothesis 2 (over-ram), or Hypothesis 3 (suicide), respectively. The rows indicate conditions and groups by condition. 27 participants are arranged into nine groups. This assignment balances the three hypotheses across the three conditions. The groups in the Solo condition are formed by triples of non-interacting individuals.
366
Gregorio Convertino et al.
the rated importance of positive evidence (Importance), and the rated relation between the evidence items and hypotheses (Weight). The measures were derived by computing the difference between values for the preferred hypothesis versus for the average for the alternative hypotheses. These measures are the Inclusion Score, Importance Score, and Weight Score. 3) In addition, we looked at a system-integrated measure of strength of evidence in the matrix (Strength). Coverage: amount of relevant information analyzed, which was measured as number of relevant evidence items that were included in the final matrix, independent of bias. System and task evaluation: We also evaluated the CACHE-A system and the task through a usability questionnaire and a brief interview. Logging data and qualitative comments were also collected for a broader picture of the activity.
5. Method 5.1. Participants and setting Twenty-seven participants, primarily university students, were assigned to threemember same-gender groups (nine groups). Two additional groups were run but excluded from the data analysis because of procedural or technical problems. Of the 27 participants, about one third (10 of 27) were females. The average age was 25.2; two participants were older than 40 years. The participants were not experienced intelligence analysts and they were unfamiliar with the domain. This facilitated investigating the role of bias in analysis: (1) Judgment bias effects on novices are sometimes larger than on experts, and (2) Lack of opinion about the case prior to the experiment facilitates uniform manipulation of bias. Participants in a given group trained together and thus gained some familiarity with one another. Following training, the members of each group were seated at workstations located in separate rooms. They could talk to the experimenter through a chat tool. The members of interacting groups could share information with their partners using the chat tool and the collaborative components of CACHE-A (described below). 5.2. CSCW tools 5.2.1. CACHE architecture CACHE (Shrager 2005) is a software system that simultaneously supports the work of individual analysts and various forms of collaboration. CACHE allows individuals to efficiently share information developed either inside or outside of the intelligence community, such as signal and operational intelligence or open source web-based and news reports. The CACHE architecture is designed to support intelligence analysis at the level of a distributed community, to which
Group Effects in Computer-supported Collaborative Analysis
367
individual analysts belong and contribute. Information provided by one community member sets up priors which others may build further knowledge upon. The CACHE software supports analysis by easing the six “pain points” characterizing analysis (Section 3): (1) search tools for handling large amounts of information and visual feedback on relevance of the search results; (2) representations that relate different information types including Evidence-byHypotheses matrices, an evidence pool, and support for annotation (i.e., interpretations); (3) automatic integration of analyst-supplied estimates in the decision matrix: in the matrix the system displays an up-to-date summative estimate of the current support for each hypothesis; (4) weighted ratings to convey uncertainty (when used by a community, the system makes reasoning chains explicitly represented and available); (5) provenance maintenance, available for inspection upon demand (in the experiment, the system used both provenance and reasoning chains to enable real-time up-to-date incremental reasoning); and (6) a stable work environment supporting varied forms of collaboration, including shared representations developed by analysts in individual workspaces. The CACHE architecture integrates several technologies for supporting analysis. For example, in addition to exact-match searching, its natural language technologies provide semantically driven search and ranking of relevance of the results. This architecture provided us with a useful testing environment for investigating collaborative analysis. The experiment used a simplified prototype of CACHE, CACHE-A, developed specifically for this study. 5.2.2. CACHE-A and chat tool CACHE-A includes a subset of the full CACHE functionality, combined with a control system that ran the experiment. The control system handles most aspects of running the experiment, including providing each user access to the right collaboration conditions block by block. For example, for interacting groups in the experiment, each of the blocks 2, 3, and 4 began with five minutes of individual work, then transitioned to collaborative work, and ended with a request to update current beliefs based on the evidence so far. CACHE-A provides the pool of evidence appropriate for each user, block-by-block. It also logs operations by the participants, the experimenter, and the system itself. CACHE-A provides a graphical interface for the analysis task (Figures 3 and 4). Three tools support individual work: the individual’s ACH matrix, the search tool, and the evidence viewer (Figure 4, bottom windows). Three other tools support collaborative work: the ticker, two views of partners’ ACH matrices and the chat tool (Figure 4, top windows). The central component of the system is the user’s ACH matrix. Like ACH0, CACHE-A supports the ACH method (Heuer 1999) by permitting each analyst to enter pieces of evidence into her/his own ACH matrix. Figure 2 shows an
368
Gregorio Convertino et al.
example of an ACH matrix. Rows represent evidence, columns represent hypotheses, and the row×column cells represent the relation between the corresponding piece of evidence and hypothesis. All the pieces of evidence selected by a given analyst are listed as the rows of his or her matrix. The first column contains the heading of each piece of evidence and the second column allows the analyst to rate importance of that piece of evidence. The remaining columns of the matrix represent all the hypotheses considered by the analyst (e.g., the three hypotheses in Figure 2), and remain in a fixed order. The values users assign to the row×column relational cells range from strongly consistent (CC), consistent (C), neutral or not applicable (N/A), inconsistent (I), to very inconsistent (II). The color of the cells is green for the most informative values, directing attention to strong disconfirmation. The pieces of evidence for or against the hypotheses can be added or removed to the ACH matrix, but the hypotheses cannot be modified. At the bottom of the matrix, in purple, the Belief row allows the user to enter their degree of belief in each of the three hypotheses. Belief across all hypotheses must total 100, and the user is prompted if other combinations of values are tried. While the Belief row is user generated, the Support row provides a system-generated summative measure of support, integrating the information the user provided. The example in Figure 2 shows the three hypotheses used for all conditions, “Over-ram,” “Friction,” and “Hartwig” (i.e., suicide). In the first row user ALPHA has entered a piece of Navy test evidence. ALPHA has rated this piece of evidence as highly important and as strongly inconsistent with the Friction hypothesis (in green), and has set consistency relations with the other two hypotheses as well. Across the whole matrix, the current values ALPHA last assigned to Belief give the highest rating (of 50) to the Friction Hypothesis. As indicated in the Support row, currently it is the Overam, not the Friction Hypothesis, that is least disconfirmed according to the user’s ratings; the user may chose to align summary belief with current evidence when he or she next updates belief. The search tool (Figure 3, bottom left; Appendix: Figure 8) works much like Google’s advanced search interface and its window opens from the link at the bottom of the ACH matrix. A search box and a search button enable keyboardbased queries. In addition to the keyword, the analyst can specify options in (1) scope of search (over evidence or interpretations), (2) display (as concise or full listing), and (3) search method (e.g., exact keyword match or semantic similarity). The experiment used default settings of searching evidence, concise display, and exact-match search method. The search results are listed with the most relevant at the top and in larger font. The evidence viewer (Figure 4, bottom right; Appendix: Figure 9) is used to read detailed information about a specific piece of evidence. A piece of evidence is accessed and displayed through its interpretation, which functions like a header or title. Each item is given one initial interpretation, but users may add more. Clicking on an interpretation displays the longer text making up the piece of
Group Effects in Computer-supported Collaborative Analysis
369
Figure 3 CACHE-A: three windows for three functions. The analyst’s ACH decision matrix, the search tool for finding evidence, and the ticker, which reports on system events and between-matrices differences between partners’ analyses and the user’s own analysis.
evidence. Users add the evidence title, or interpretation, to their matrix. The evidence header retains its link to the evidence, wherever the header appears, allowing the user to click open the evidence window from multiple access points. For example, by clicking on the link of the header listed in the ACH matrix (see [I] links in Figure 2) or in the search tool (Appendix: Figure 8) the analyst will open a separate window for each piece of evidence. Multiple evidence viewers can be open at once, allowing comparison of multiple pieces of evidence, but requiring window management. Turning to the collaborative tools (Figure 4, top windows), the ticker (Appendix: Figure 10) is a notification system that conveys automatically generated information to participants. It displays system information that guides the course of the experiment and automatically captures information updating one partner on potentially relevant actions of another. The analyst will be updated concerning the partners’ newly added evidence and newly made judgments about particular pieces of evidence (i.e., ratings). The ticker of a given analyst, Alpha, will report when her/his collaborators, Beta or Gamma, add a piece of evidence to their individual matrices that is not already in Alpha’s matrix. Moreover, if Alpha and Beta both have entered a given piece of evidence into their individual matrices already, then if Beta enters a different judgment about that piece of
Figure 4 CACHE-A Workspace for one team member (Alpha). Search tool, ACH matrix, and Evidence viewer (Read & Interpret) are used for individual analysis (bottom). Read-only views of partners’ matrices, Ticker, and Chat tool support collaboration (top).
370 Gregorio Convertino et al.
Group Effects in Computer-supported Collaborative Analysis
371
evidence (e.g. Beta judges it very inconsistent whereas Alpha judges it neutral), a one-line notification of this difference will be posted in Alpha’s ticker. Each posted notification ticker includes a link. By clicking on the link, the user can open and read the details of the piece of evidence in the evidence viewer. Thus, the ticker keeps group members aware of differences in their developing analyses. Two read-only views of partners’ ACH matrices (Appendix: Figure 10) also provide a channel for collaboration, showing the partner’s evolving analysis. During collaborative work, each partner’s matrix can be accessed through a link in the Ticker. These views allow monitoring in real time (but do not allow changing) the status of each partner’s ACH matrix. An analyst may learn about a new piece of evidence and borrow it through a partner’s matrix as well as through a ticker message. By clicking on the evidence header one user can gain access to information in the partner’s evidence pool, whether or not that evidence was already available in the user’s own pool. These two methods – ticker and viewing partner matris – complement each other, one highlighting a recent change and the other showing the whole context. Finally, an off-the-shelf chat tool allows each participant to communicate with partners during the collaboration phase. It allows participants to talk about any topic they believe valuable to discuss with their partners. During the experiment, particularly in the collaborative mode, participants had to manage multiple windows at once, such as multiple matrix views as well as evidence viewers. The chat and the ticker tools were also used by the experimenter to distribute synchronously scripted instructions to the participants, during the experiment. 5.3. Materials Participants used the CACHE-A system to conduct a moderately complex analysis task, designed to model a real analysis problem, the USS Iowa case. In 1989 an explosion occurred on the battleship USS Iowa in one of the battleship turrets, taking a complete toll of all forty-seven crewmen in that turret. Months later, the results of the investigations by over fifty experts from several laboratories identified three possible causes of the explosion with evidence supporting each of the three hypotheses. The cause favored by the Navy was human error resulting in overramming of the powder bags into the gun; that favored by Sandia National Labs was friction-produced static electricity igniting the powder; while the FBI concluded that an incendiary device had been used in attempted suicide. Cheikes et al. (2004) used this case as a task for studying bias with individual analysts. We redesigned and extended their task materials. Our task was designed for measuring judgment bias in computer-supported collaborative analysis. It differed from the version used for individual analysts in significant ways. First, we used an extended evidence pool after pre-validating the items with three independent judges (i.e., 80 evidence items). Second, we added an interpretation
372
Gregorio Convertino et al.
Table 2 Stimuli: evidence items by block and hypothesis. Block/hypothesis Preferred hypothesis Alternative Hyp.1 Alternative Hyp.2 Fillers (Neutral) Total items
Block 1 4 (all P) 4 (all P) 4 (all P) 8 20
a
Block 2
Block 3
Block 4
Total items
6 (5P, 1N) 3 (2P, 1N) 3 (2P, 1N) 8 20
3 (1P, 2N) 4 (2P, 2N) 4 (2P, 2N) 9 20
3 (1P, 2N) 5 (3P, 2N) 5 (3P, 2N) 7 20
16 (11P, 5N) 16 (11P, 5N) 16 (11P, 5N) 32 80
The columns indicate blocks and the rows hypotheses, to which the items are related. Positive items (P) confirm and negative items (N) disconfirm one hypothesis. Fillers are neutral (nondiagnostic). The first five items analyzed individually in Block 1 include four positive items pro preferred hypothesis (a) and one filler. The distribution of the items is used to induce bias.
to each piece of evidence in the pool. Third, we introduced three analyst roles (Navy, Sandia, and FBI expert), where each role modeled an expert with distinct knowledge and preferences on hypotheses. Finally, we controlled the composition of the evidence pool by balancing the evidence in relation to the three hypotheses and the three analyst roles (e.g. an equivalent number of items was tagged with Navy, Sandia, or FBI as their source). The entire “case book” for the analysis included background material about the Iowa case, the three hypotheses, and 80 evidence items (33 positive items, with three sets of 11 items supporting each of the hypotheses; 15 negative items, with three sets of five items disconfirming each hypothesis; and 32 neutral or nondiagnostic fillers). Negative or “disconfirming” evidence here means directly and relevantly arguing against one of the hypothesis, not simply supporting an alternative. Each evidence item consisted of the base text description of evidence and a short one-sentence interpretation, acting like a title or headline. The title clearly indicated whether the evidence item supported, opposed, or was neutral with respect to the relevant hypothesis. Overall, the evidence covered many topics and contained conflicting expert testimony connected to different sources, including consulting agencies (e.g. MIT) as well as the main agencies (Navy, Sandia, and FBI). The 80 pieces of evidence were all viewed by all participants and were partitioned into 4 ordered blocks, as shown in Table 2. The order of presentation of the evidence was controlled and differed depending on the Initial Preferred Hypothesis assigned to the participant (see description below). Before the experiment, three judges had rated the consistency relationship of a larger corpus of evidence items in relation to the three hypotheses. The ratings were used to select 80 unambiguous items and to balance the support across the item set, for the three hypotheses. Overall, the support of the final set of 80 items for the three hypotheses was quite even. An ideal unbiased analyst after considering all the evidence was expected to update her/his beliefs in the three hypotheses until they would become approximately equal across the three hypotheses (i.e., 33% probability for each hypothesis).
Group Effects in Computer-supported Collaborative Analysis
373
Table 3 Procedure by group condition. Phases/ Training (50 min) condition Hetero
Homo Solo
Block 1 (25 min)
Blocks 2, 3, 4 (20 min each, 60 total)
1. Indiv. 1. Indiv. 1. Group (35 min): ACH and (5 min): Read 5 (5 min): Analyze new block items, system; Practice in items; Rate 5 add to matrix, interpretat. the CACHE-A rate; Rate belief in (bias check) system hypotheses 2. Indiv. (20 min): 2. Group 2. Indiv. (15 min): (15 min): View Analyze block Learn role, 1, add to matrix, partners’ matrices, task, and case; rate; Rate belief in ticker, check new Background items, discuss in hypotheses survey chat; Rate belief in (bias check) hypotheses (bias check) As above As above As above As above As above 1. Indiv. (5 min): (see Indiv. above) 2. Indiv. (15 min): (see Indiv. above)
Questionnaire, interval (16 min) 1. Indiv. (8 min): Posttask survey on system and task
2. Group (8 min): Interview on task, system, process; Debriefing
As above As above
The columns indicate the phases and the rows the condition. Training and Question Phases included group and individual work in all conditions. Blocks 2, 3, and 4 included (distributed) group work only for the Homogeneous and Heterogeneous conditions.
The experiment was designed to induce in each participant an initial bias favoring one of the three hypotheses. We refer to the hypothesis toward which a participant was initially biased as the Initially Preferred Hypothesis, or Initial Belief. Such initial bias was induced by two means. First, each participant was assigned a distinct analyst role (Navy, Sandia, or FBI expert). The role primed the participant with a preference for evidence from her/his agency and a particular type of etiological argument (human factors, mechanical, or motivational). Second, the order of presentation of the evidence was manipulated in several ways within and across blocks: (a) in the first block, the first five items analyzed included four positive items strongly in favor of the preferred hypothesis and one neutral item – this primed the analyst to “anchor” on this hypothesis; (b) across the four blocks, the participant analyzed more positive evidence in support of the preferred hypothesis in the earlier blocks than positive evidence for an alternative hypothesis; and (c) within each block the evidence was ordered so that stronger confirmatory evidence for the preferred hypothesis was presented earlier. In summary, we induced bias at the beginning of the task, but by the end of the task each participant had viewed the identical, and balanced, evidence set. The experiment design is similar to those used in prior studies of bias with experts
374
Gregorio Convertino et al.
(e.g., Cheikes et al. 2004; Tolcott et al. 1989) or non-experts (e.g., Schultz-Hart et al. 2000). 5.4. Procedure For all conditions, the procedure consisted of training, the core analysis task, and final questionnaires and interview. Table 3 summarizes the phases of the procedure in the three conditions. The core analysis task took place in four blocks. The conditions differed in whether the task included collaboration. Participants were trained in groups of three, in a meeting room for about a half hour. They received a preliminary description of the study and signed informed consent. They were introduced to and practiced with the ACH method and the components of the CACHE-A system. They moved to workstations located in three separate rooms where they had about 15 min to read the descriptions of their role (Navy, Sandia, or FBI expert), background information about the case, and the three hypotheses. The main analysis task lasted about one hour and half and was structured in four blocks, lasting about 20-min each. In each of the four blocks, the CACHE-A server presented each group member with the appropriate block of 20 evidence items. Throughout the analysis task, participants used the CACHE-A tools to find and read evidence that they considered relevant, and gradually added the evidence selected to their ACH matrix. Any time, after adding a new item of evidence to the matrix, the participant could specify the importance of that item and its relationships to any of the three predefined hypotheses in the matrix (consistent, inconsistent, or neutral; see Appendix: Figure 7). Participants could update their belief in the hypotheses at any time, but were requested to do so at the end of each block, assigning 1–100 belief ratings at the bottom of the matrix. Belief judgments were constrained to sum to 100 across the three hypotheses (see Figure 2). During the first block all the participants worked alone. For each of the remaining three blocks the members of interacting groups (Homogeneous and Heterogeneous groups), were able to collaborate with one another through the ticker, the views of the partners’ ACH matrices, and the chat tool. At the beginning of each block, they worked individually for five minutes, and then they could interact with their partners for about 15 min. For the collaborative part, the participants were invited to share information (“use the information from your teammates to help your own analysis, whether or not their opinions are similar to your own”) and discuss differences via chat. The members of Solo (nominal) groups worked individually for the entire duration of the analysis task. The time they had to work on each block was the same as in the two interacting conditions; that is, collaborating individuals had no additional time for communication during analysis, nor did they have additional time for training on the collaborative tools. After finishing the four blocks of the analysis task, participants answered a usability questionnaire, took part in a brief interview, and finally were debriefed.
Group Effects in Computer-supported Collaborative Analysis
375
5.5. Illustrative scenario: a team working in CACHE-A Three participants are working as analysts on the USS Iowa case. Analyst “Bertram”, who plays the role of the Sandia analyst, suspects that the explosion was caused by friction producing a spark. At the start of the analysis task, Bertram scans the two monitors in his office, checking his empty ACH matrix, ticker, and chat windows. He recalls that his own matrix and the ticker should always remain open. Then the ticker reports the availability of evidence. Bertram searches the evidence for “friction” and reads over the interpretations presented, summarizing pieces of evidence. He begins to open and read evidence. He clicks the ADD button and watches the item appear in his matrix. He sets the value of the evidence as moderately important and changes the cell indicating its relation to the Friction hypothesis from the default Neutral value to Strongly Consistent. This item doesn’t seem very relevant to the other hypotheses so he leaves those cell values at neutral. Presently he reads the ticker message announcing that the collaborative part of the block has begun. Bertram finishes up a couple more pieces of evidence and then opens “Alphred’s” matrix. Alphred has a lot of evidence entered but not rated. However, Bertram notices that Alphred has a piece of evidence marked as strongly inconsistent with the friction hypothesis, so he opens and reads this. “Gamba” has posted a question asking what the others think about a particular piece of evidence. The three analysts continue working with a mix of individual and shared activity through the remainder of the block. The cycle of individual and group work continues across blocks. The group chats more toward the end of the last block, asking about the others’ assessments. 6. Results 6.1. Overview Across all bias measures the pattern of results were the same, though it varied in whether or not it reached significance: groups in the homogeneous condition always tended to be more biased than those in the heterogeneous and solo conditions, which were similar to one another. We report bias effects on two types of measures in Sections 6.2 and 6.3. (1) The primary measure of bias and debiasing was the overall judged Belief in the preferred hypothesis, including changes in belief over blocks. This is the value that users entered in their matrix in the Belief row. (2) Additional cells, from the final matrix, provided finer grained measures that can suggest what aspect of judgment contributed most to bias: amount of positive evidence included (Inclusion) and assessment of that evidence (Importance and Weight). For these measures we assessed bias using a difference score, comparing values for the preferred versus alternative hypotheses. We also used the system-generated, unbiased integration of user-provided values (Strength).
376
Gregorio Convertino et al. Block 1: Intended Bias Manipulation Produces Greater Belief in Target Hypothesis Means (st. dev.)
% belief in rated hypothesis
100
H1:Friction H2:Overram H3: Suicide
90 80 70 60 50 40 30 20 10 0
Pref=Friction
Pref=Overram
Pref=Suicide
Initial Bias Hypothesis
Figure 5 Initial Belief (after Block 1). Successful bias across conditions and Initially Preferred Hypotheses.
Independently of questions of bias, we looked for condition effects in the amount and type of evidence included in the final matrix (Section 6.4). Finally we take a broader perspective about using the CACHE-A tool and report some on-line tracking data and highlights from the usability questionnaire and debriefing (Section 6.5 to 6.6). Some logging data collected during the course of the experiment was missing: where a measure was not captured for all users, the actual N is noted. Note that this exploratory study used a small number of groups and individuals, so our statistical sensitivity is modest and best suited to detecting robust effects.
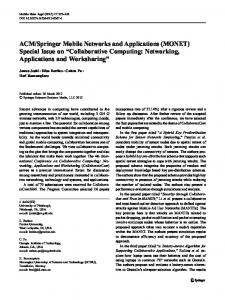
Belief Allocated to Preferred Hypothesis over Blocks % of belief in preferred hypothesis
100 90 80 70 60 50 40 30 20 10
Solo Homogeneous Heterogeneous
0 1 (N=26)
2 (N=25)
3 (N=23)
4 (N=27)
BLOCK
Figure 6 Belief (%) in the Initially Preferred Hypothesis at the end of each block. Standard Deviation for Homogeneous and Heterogeneous Conditions (vertical bars). N Number of participants with data available for each block (on the x-axis).
Group Effects in Computer-supported Collaborative Analysis
377
Table 4 Bias measures by group condition. Bias measure
(a) Inclusion difference score={(# pieces of positive evidence items included for the preferred hypothesis)−(# for average of the alternatives)} (b) Importance difference score={(ave. rated importance of positive evidence items for the preferred hypothesis)−(importance for average of the alternatives)} (c) Weight difference score in consistent/inconsistent relation={(ave. rated consistency of positive evidence items for the preferred hypothesis)−(value for average of the alternatives)} (d) Strength={CACHE-computed summative score of strength of support for preferred hypothesis} (e) Belief={Overall rating of belief in the preferred hypothesis}
Condition (averages) Hetero
Homo
Solo
Total average
1.61
2.17
1.17
1.65*
1.07
1.51
1.17
1.25*,**
3.06
8.22
1.72
4.33*
3.67
6.75
−1.33
2.88*,**
46.67
72.22
41.44
53.44*,**
Difference scores (rows a, b, c) aggregate judgments expressed on the evidence items. Absence of bias for these scores corresponds to zero: i.e., large values indicate greater bias. The Strength and Belief scores indicate bias at the level of the entire ACH matrix (i.e., belief in preferred hypotheses). *Significant bias overall, p>0.05 **Significant EFFECT of Group CONDITION: condition difference in bias, p>0.05
6.2. Belief bias: initial, final, and change To get a clean measure of bias change, we needed to induce strong, analogous initial bias across conditions. We succeeded as shown in Figure 5. We produced our intended initial bias toward the preferred hypothesis, targeted for the individual user, F(4, 34)=8.49, p