This discussion paper is/has been under review for the journal Geoscientific Model Development (GMD). Please refer to the corresponding final paper in GMD if available.
Discussion Paper
Geosci. Model Dev. Discuss., 8, 3443–3479, 2015 www.geosci-model-dev-discuss.net/8/3443/2015/ doi:10.5194/gmdd-8-3443-2015 © Author(s) 2015. CC Attribution 3.0 License.
|
S. Miyazaki et al.
Title Page Abstract
Introduction
Conclusions
References
Tables
Figures
J
I
J
I
Back
Close
Full Screen / Esc
Discussion Paper |
3443
GTMIP: overview and experiment protocol for Stage 1
|
National Institute of Polar Research, Tachikawa, Japan Japan Agency for Marine-Earth Science and Technology, Yokohama, Japan 3 Graduate School of Science, Tohoku University, Sendai, Japan 4 Field Science Education and Research Center, Kyoto University, Kyoto, Japan 5 Advanced Institute for Computational Science, RIKEN, Kobe, Japan 6 Met Office Hadley Centre, Exeter, UK 7 Meteorological Research Institute, Tsukuba, Japan 8 National Institute for Agro-Environmental Sciences, Tsukuba, Japan 9 National Institute for Environmental Studies, Tsukuba, Japan 10 Forestry and Forest products Research Institute, Tsukuba, Japan
Discussion Paper
1
2
8, 3443–3479, 2015
|
S. Miyazaki1,2,* , K. Saito2 , J. Mori1,2 , T. Yamazaki3 , T. Ise4 , H. Arakida5 , T. Hajima2 , Y. Iijima2 , H. Machiya1,2 , T. Sueyoshi1,2 , H. Yabuki1,2 , E. J. Burke6 , M. Hosaka7 , 2 8 9 12 10 7 11 K. Ichii , H. Ikawa , A. Ito , A. Kotani , Y. Matsuura , M. Niwano , T. Nitta , 1,11 12 2 13 14 2 15 R. O’ishi , T. Ohta , H. Park , T. Sasai , A. Sato , H. Sato , A. Sugimoto , 2 2 14 11 R. Suzuki , K. Tanaka , S. Yamaguchi , and K. Yoshimura
Discussion Paper
The GRENE-TEA Model Intercomparison Project (GTMIP): overview and experiment protocol for Stage 1
GMDD
Printer-friendly Version Interactive Discussion
Discussion Paper
Received: 27 March 2015 – Accepted: 13 April 2015 – Published: 29 April 2015
Discussion Paper
12
Correspondence to: K. Saito (
[email protected]) Published by Copernicus Publications on behalf of the European Geosciences Union.
|
Atmosphere and Ocean Research Institute, The University of Tokyo, Kashiwa, Japan Graduate School of Bioagricultural Sciences, Nagoya University, Nagoya, Japan 13 Graduate School of Life and Environmental Science, University of Tsukuba, Tsukuba, Japan 14 Snow and Ice Research Center, National Research Institute for Earth Science and Disaster Prevention, Nagaoka, Japan 15 Faculty of Environmental Earth Science, Hokkaido University, Sapporo, Japan * now at: Sonic Corporation, Tachikawa, Japan
11
GMDD 8, 3443–3479, 2015
GTMIP: overview and experiment protocol for Stage 1 S. Miyazaki et al.
Title Page Introduction
Conclusions
References
Tables
Figures
J
I
J
I
Back
Close
|
Abstract
Discussion Paper |
Full Screen / Esc
Discussion Paper |
3444
Printer-friendly Version Interactive Discussion
5
GMDD 8, 3443–3479, 2015
GTMIP: overview and experiment protocol for Stage 1 S. Miyazaki et al.
Title Page Abstract
Introduction
Conclusions
References
Tables
Figures
J
I
J
I
Back
Close
| Discussion Paper
20
Discussion Paper
15
|
10
As part of the terrestrial branch of the Japan-funded Arctic Climate Change Research Project (GRENE-TEA), which aims to clarify the role and function of the Arctic terrestrial system in the climate system, and assess the influence of its changes on a global scale, this model intercomparison project (GTMIP) is planned and being conducted to (1) enhance communication and understanding between the “minds and hands” (i.e., between the modelling and field scientists) and (2) assess the uncertainty and variations stemming from variability in model implementation/design and in model outputs due to climatic and historical conditions in the Arctic terrestrial regions. This paper provides an overview and the experiment protocol of Stage 1 of the project, site simulations driven by statistically fitted data created using the GRENE-TEA site observations for the last three decades. The target metrics for the model evaluation cover key processes in both physics and biogeochemistry, including energy budgets, snow, permafrost, phenology, and carbon budgets. The preliminary results on four metrics (annual mean latent heat flux, annual maximum snow depth, gross primary production, and net ecosystem production) already demonstrate the range of variations in reproducibility among existing models and sites. Full analysis on annual as well as seasonal time scales, to be conducted upon completion of model outputs submission, will delineate inter-dependence among the key processes, and provide the clue for improving the model performance.
Discussion Paper
Abstract
|
1
Full Screen / Esc
The pan-Arctic ecosystem is characterized by low mean temperatures, snow cover, seasonal frozen ground, and permafrost with a large carbon reservoir, covered by various biomes (plant types) ranging from deciduous and evergreen forests to tundra. To investigate the impact of climate change in this region, a number of studies using both analysis of observed data and numerical modelling have been carried out (e.g., Zhang
|
3445
Discussion Paper
25
Introduction
Printer-friendly Version Interactive Discussion
3446
|
Discussion Paper
8, 3443–3479, 2015
GTMIP: overview and experiment protocol for Stage 1 S. Miyazaki et al.
Title Page Abstract
Introduction
Conclusions
References
Tables
Figures
J
I
J
I
Back
Close
| Full Screen / Esc
Discussion Paper
25
GMDD
|
20
Discussion Paper
15
|
10
Discussion Paper
5
et al., 2005; Brown and Robinson, 2011; Brutel-Vuilmet et al., 2013; Koven et al., 2011, 2013; Slater and Lawrence, 2013). Various numerical modelling schemes have been developed to treat physical and biogeochemical processes on and below the land surface, and interactions with the overlying atmosphere as components of atmosphere– ocean coupled global climate models (AOGCMs), or Earth system models (ESMs). Among these processes, snowpack, ground freezing/thawing, and carbon exchange are the most important processes in terrestrial process models (TPM) applied in the pan-Arctic region. Since the 1990s, a number of model intercomparison projects (MIPs) have been carried out, focusing on the performance of TPMs, AOGCMs, and ESMs; some examples include PILPS (Project for Intercomparison of Land-Surface Parameterization Schemes; Henderson-Sellers, 1993), SnowMIP (Snow Models Intercomparison Project; Etchevers et al., 2004; Essery et al., 2009), Potsdam NPP MIP (Potsdam Net Primary Production Model Intercomparison Project; Cramer et al., 1999), C4MIP (Coupled Climate–Carbon Cycle Model Intercomparison Project; Friedlingstein et al., 2006), CMIP5 (Coupled Model Intercomparison Project; Taylor et al., 2012), and MsTMIP (Multi-scale synthesis and Terrestrial Model Intercomparison Project; Huntzinger et al., 2013). For snow dynamics, SnowMIP2 showed a broad variety in the maximum snow accumulation values, particularly at warmer sites and in warmer winters, although the duration of snow cover was relatively well simulated (Essery et al., 2009). This study also noted that the SnowMIP2 models tend to predict winter soil temperatures that are too low in the cold sites and for sites with shallow snow, a discrepancy arguably caused by the remaining uncertainties in ecological and physical processes and the scarcity of winter process measurements for model development and testing in the boreal zone. The CMIP5 models simulated the snow cover extent for most of the Arctic region well, except for the southern realm of the seasonal snow cover area. The poor performance of some of the TPMs in this region is due to an incorrect timing of the snow onset, and possibly by an incorrect representation of the annual maximum snow cover fraction
Printer-friendly Version Interactive Discussion
3447
|
Discussion Paper
8, 3443–3479, 2015
GTMIP: overview and experiment protocol for Stage 1 S. Miyazaki et al.
Title Page Abstract
Introduction
Conclusions
References
Tables
Figures
J
I
J
I
Back
Close
| Full Screen / Esc
Discussion Paper
25
GMDD
|
20
Discussion Paper
15
|
10
Discussion Paper
5
(Brutel-Vulmet et al., 2013). For ground freezing/thawing processes, Koven et al. (2013) showed the current status of the performance of AOGCMs for permafrost processes based on CMIP5 experiments. There was large disagreement among modelled soil temperatures, which may have been due to the representation of the thermal connection between the air and the land surface and, in particular, its mediation by snow in winter. Vertical profiles of the mean and amplitude of modelled soil temperatures showed large variations, some of which can be attributed to differences in the physical properties of the modelled soils and coupling between energy and water transfer. This appears to be particularly relevant for the representation of organic layers. For the biogeochemical cycles, a number of studies based on MIPs have been carried out. The broad global distribution of net primary productivity (NPP) and the relationship of annual NPP to the major climatic variables coincide in most areas with differences among the 17 global terrestrial biogeochemical models that cannot be attributed to the fundamental modelling strategies (Cramer et al., 1999). The ESMs in CMIP5 use the climate and carbon cycle performance metrics, and they showed that the models correctly reproduced the main climatic variables controlling the spatial and temporal characteristics of the carbon cycle (Anav et al., 2013). However, they found a weakness in the modeling of the land carbon cycle: a general overestimation of photosynthesis and leaf area index due to the lack of nutrient limitation on gross primary production (GPP). The future projection by ESMs suggests that the carbon sink characteristic will increase in northern high latitudes, although there are some uncertainties, such as nutrient limitations in CO2 fertilization, the effect of soil moisture on decomposition rates, and mechanistic representations of permafrost (Qian et al., 2010; Ahlstrom et al., 2012). As for the carbon-concentration feedback, the carbon cycle response to atmospheric CO2 decreases for both the land and the ocean as CO2 increases, which is related to saturation of the CO2 fertilization effect and increased ecosystem respiration fluxes as vegetation and soil carbon biomass increase (Arora et al., 2013). It should be noted that the reference observation data, which were used for those evaluations, are prone to uncertainties due to random and bias errors in the measurements them-
Printer-friendly Version Interactive Discussion
Discussion Paper
8, 3443–3479, 2015
GTMIP: overview and experiment protocol for Stage 1 S. Miyazaki et al.
Title Page Abstract
Introduction
Conclusions
References
Tables
Figures
J
I
J
I
Back
Close
| Full Screen / Esc
Discussion Paper |
3448
GMDD
|
20
Discussion Paper
15
|
10
Discussion Paper
5
selves, sampling errors, and analysis error, especially for the biogeochemical variables such as land GPP (e.g., Anav et al., 2013; Piao et al., 2013). Based on the outcomes of these MIPs, TPMs have improved their performances. However, as past MIPs were carried out on a global scale or in the subarctic region using gridded outputs from the models, intercomparisons dedicated to Arctic region processes that include both physical and biogeochemical aspects at a site level are still limited (e.g. Ekici et al., 2014; Rawlins et al., 2015; Wang et al., 2015). A mission of the modelling group in the terrestrial research project of the GRENE Arctic Climate Change Research Project (GRENE-TEA) is to (a) pass possible improvements regarding physical and biogeochemical processes for Arctic terrestrial modelling (excluding glaciers and ice sheets) in the existing AOGCM terrestrial schemes to the AOGCM research community, and (b) lay the foundations for the development of future-generation Arctic terrestrial models. This model intercomparison project (GTMIP) is planned and being conducted to achieve these goals. It is also designed to promote communication and understanding between modelling and empirical scientists, to assess the effect of model implementation on model uncertainty and variations, and to investigate the model output variability due to climatic and historical conditions among the pan-Arctic sites. The GTMIP consists of two stages: one dimensional, historical GRENE-TEA site evaluations (Stage 1) and circumpolar evaluations using projected climate change data from GCM outputs (Stage 2). This paper focuses on Stage 1 of the project, which evaluates the TPMs for the physical and biogeochemical processes by site simulations for the last three decades, driven and validated by GRENE-TEA site observation data that were compiled through a tight collaboration between the GRENE-TEA field and modelling groups.
Printer-friendly Version Interactive Discussion
2.1
5
8, 3443–3479, 2015
GTMIP: overview and experiment protocol for Stage 1 S. Miyazaki et al.
Title Page Abstract
Introduction
Conclusions
References
Tables
Figures
J
I
J
I
Back
Close
| Full Screen / Esc
Discussion Paper |
3449
Discussion Paper
25
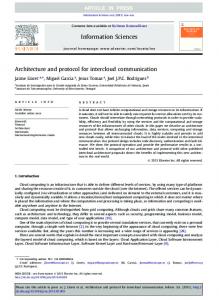
The target period for Stage 1 was set from 1980 to 2013, providing at least 30 years of data to enable climatological analyses. We provided the following driving data for Stage 1: surface air temperature, precipitation, specific humidity, air pressure, wind speed, incident short-wave and long-wave radiation. For this stage (site simulations), forcing and validation data have been prepared, taking maximum advantage of the observation data from GRENE-TEA sites (Fairbanks (FB) in Alaska; Tiksi (TK), Yakutsk (YK), Chokurdakh (CH), and Tura (TR) in Russia; and Kevo (KV) in Finland, shown in Fig. 1), to evaluate the inter-model and intersite variations for 1980–2013. The backbone of the continuous forcing data (called “level 0” or L0; Saito et al., 2014a) was constructed from reanalysis data to avoid limited coverage and/or missing data, or the lack of consistency inherent in observational data, with bias-corrected monthly Climate Research Unit (CRU) for temperature;
GMDD
|
20
Driving datasets and model parameters
Discussion Paper
The following five categories (from “a” to “e” below) were selected as the key processes to assess the performance of the existing TPMs in the pan-Arctic region, to evaluate the variations among the models and the mechanisms behind their strengths and weaknesses, and to obtain information and guidance to improve the next generation of TPMs. The five categories are (a) exchange of energy and water between atmosphere and land, (b) the snowpack, (c) phenology, (d) ground freezing/thawing and the active layer, and (e) the carbon budget. The scientific questions at the Stage 1 are: how well do the TPMs reproduce target metrics (examples are shown in column B in Table 1) in terms of agreement with observations? How do the reproductions vary among the models? If the reproductions are good or poor in some models, which processes in the TPMs are responsible and why? 2.2
15
Targeted processes
|
10
Experiment design
Discussion Paper
2
Printer-friendly Version Interactive Discussion
3450
|
Discussion Paper
8, 3443–3479, 2015
GTMIP: overview and experiment protocol for Stage 1 S. Miyazaki et al.
Title Page Abstract
Introduction
Conclusions
References
Tables
Figures
J
I
J
I
Back
Close
| Full Screen / Esc
Discussion Paper
25
GMDD
|
20
Discussion Paper
15
|
10
Discussion Paper
5
Harris et al. (2014) and Global Precipitation Climatology Project (GPCP) for precipitation; Adler et al. (2003) datasets at the respective nearest grid to the sites. The European centre for medium-range weather forecasts ReAnalysis (ERA)-interim reanalysis data (Dee et al., 2011) were chosen from four products (National Centers for Environmental Prediction (NCEP)/National Center for Atmospheric Research (NCAR); NCEP/NCAR, NCEP-Department of Energy (DOE), Japanese Reanalysis (JRA)-55, and ERA-interim) because it showed the smallest bias relative to the monthly CRU and GPCP in terms of 2 m air temperature and precipitation in the pan-Arctic region (north ◦ of 60 N). Assimilation of the observed data was then applied to reflect local characteristics and to derive the primary driving data, “level 1” data (L1; Saito et al., 2014b) and, in addition, the level 1 hybrid data (L1H) by replacing data with observed data when available. The L1 dataset was provided for four sites (FB, KV, TK and YK) due to availability of observed data for validations. Further details of the method used to create the L0 and L1 datasets, and their basic statistics, are described in Sueyoshi et al. (2015). The 20 year detrended meteorological driving dataset was provided for spin up, allowing biogeochemical models to set up initial soil carbon conditions without including warming trends and/or ENSO (El Niño Southern Oscillation). This dataset is based on the L1 data for the period of 1980–1999 (Saito et al., 2015). The monthly values of the photosynthetically active radiation (fPAR) and leaf area index (LAI) datasets at GRENE-TEA sites, created based on Moderate Resolution Imaging Spectroradiometer (MODIS) satellite data (MOD15A2, MYD15A2), were also provided where required (Saito et al., 2014c). The driving datasets are provided in the ASCII fixed-length record files, and are available through the Arctic Data Archive System (ADS; https://ads.nipr.ac.jp/gtmip/ gtmip.html), along with the simulation protocol. The site description, including location, dominant vegetation type, soil, climate, fPAR, LAI, data available for model validation, and references for observation data, is summarized in Table 2. The annual air temperature and precipitation at the six sites ranges
Printer-friendly Version Interactive Discussion
5
25
(1)
GTMIP: overview and experiment protocol for Stage 1 S. Miyazaki et al.
Title Page Abstract
Introduction
Conclusions
References
Tables
Figures
J
I
J
I
Back
Close
Full Screen / Esc
|
where X is a physical variable (e.g., fluxes, ground temperature, soil moisture, or ice content). The subscript n denotes the annual mean for the nth year. For biogeochemical cycle models, we recommended maintaining spin up over at least 2000 years using the detrended meteorological driving data (also provided through ADS) and pre-industrial atmospheric CO2 concentrations (e.g., 280 ppmv for around the year of 1750) until the soil carbon reached equilibrium; the atmospheric CO2 concentration should then be increased to the current level (e.g., 340 ppmv) over 3451
Discussion Paper
20
< 10
8, 3443–3479, 2015
|
Xn
−2
Discussion Paper
Xn − Xn−1
GMDD
|
Stage 1 consists of two sub-stages: 1A and 1B. Stage 1A, which aim to evaluate the inter-model variations in baseline performance at each site, requested the participants to use the parameters in the default settings for the provided boundary conditions, such as land cover type. In contrast, Stage 1B allows tuning for the best reproduction of observations so that the parameter sensitivity among the sites can be evaluated. We set the initial condition date to 1 September 1979, so that simulations started with a no-snow condition. The initial data for the model boundary conditions were available, as most stations can provide observation data for soil temperature and soil moisture profiles. However, each model could use its own method for initialization. The spin up process may also differ between models. However, we recommended continuing spin up until a steady state was achieved for the main variables (see Sect. 2.5). For example, Takata (2002) defined a threshold of a steady state in a slowly varying system as
Discussion Paper
15
Model setup
|
10
2.3
Discussion Paper
from −13.5 to −1.6 ◦ C and from 188 to 415 mm, respectively. Four sites (FB, KV, YK, and TR) are in the boreal forest, while TK is in tundra and CH in the tundra–forest transition zone. Most of the sites are located in the permafrost zone with an active layer ranging from 0.4 to 1.2 m, except for the KV site, which is seasonally frozen.
Printer-friendly Version Interactive Discussion
2.4 5
Discussion Paper
8, 3443–3479, 2015
GTMIP: overview and experiment protocol for Stage 1 S. Miyazaki et al.
Title Page Abstract
Introduction
Conclusions
References
Tables
Figures
J
I
J
I
Back
Close
| Full Screen / Esc
Discussion Paper
25
GMDD
|
20
Discussion Paper
15
|
To answer the key questions for the target processes proposed in Sect. 2.1, we planned to analyze the model output by describing the model–model and model–observation differences, discerning the cause of differences, and investigating parameter sensitivity. We compared the outputs of multiple models using the metrics shown in Table 3. These metrics, divided into five categories (i.e., energy and water budget, snowpack, phenology, subsurface hydrological and thermal states, carbon budget), were used to evaluate model performance in each category, and search for clues to improve the TPMs. For the decadal-scale climate simulation, the most important outputs are the latent heat flux and the net ecosystem exchange. The latent heat flux (evapotranspiration) is the essential driver of precipitation inland at high latitudes owing to high rates of recycling (e.g., Dirmeyer et al., 2009; Saito et al., 2006). Net ecosystem exchange (NEE) plays a fundamental role in determining global CO2 concentrations by determining whether a site forms a carbon source or sink (e.g. Abramowitz et al., 2008; Mcguire et al., 2012). NEE represents the net land–atmosphere CO2 flux, and a positive NEE represents net loss of CO2 from the land to the atmosphere (i.e., carbon source; Mcguire et al., 2012). Although NEE is commonly used for the tower flux observation and some TPMs, we decided to use the net ecosystem production (NEP) for both the observed and simulated values because the latter is more widely used in nonbiogeochemical communities. A positive (negative) value of NEP represents a carbon sink (source). First, we will examine both the inter-annual and the inter-decadal model output variability based on the output time series over more than 30 years. Inter-site differences will also be evaluated for the four GRENE-TEA sites in the Arctic region, each of which has distinct characteristics. The vegetation type for three of the four sites is forest (two 3452
|
10
Analysis plan
Discussion Paper
200 years or so (the period being dependent on the model). For the submission period (1979 to 2013), use of the historical atmospheric CO2 concentration was recommended for these models so that they are driven by time-variant CO2 concentrations.
Printer-friendly Version Interactive Discussion
[Model-ID]_[stage-ID]_[forcing ID]_[station-ID]_[yymmdd (date of submission)].csv,
GTMIP: overview and experiment protocol for Stage 1 S. Miyazaki et al.
Title Page Abstract
Introduction
Conclusions
References
Tables
Figures
J
I
J
I
Back
Close
Full Screen / Esc
Discussion Paper
25
8, 3443–3479, 2015
|
20
|
where stage_ID is either “1a” or “1b,” forcing_ID is “L0,” “L1,” or “L1H,” and station_ID is shown in Table S2 (refer to the Supplement). The variables for submission are categorized into six groups: (0) model driving, (1) energy and water budget, (2) snow dynamics, (3) vegetation, (4) subsurface hydrological and thermal states, and (5) carbon budget. The priority for each variable, classed at three levels, was set according to the necessity and availability for evaluation of the model performance. In addition, participants are requested to provide information on the status of the variables in their model (i.e., model driving, prescribed parameter, prognostic, diagnostic, or not applicable), through the provided questionnaire (Supplement, Table S3; provided through ADS), to identify the characteristics of the model. 3453
Discussion Paper
We are requesting participants to submit those variables listed in Table S1 (refer to the Supplement) in ASCII format with CSV-type files. The template file for output submission has been provided through ADS. The file naming convention for submitting the result of each model is defined as follows:
GMDD
|
15
Model output variables
Discussion Paper
2.5
|
10
Discussion Paper
5
evergreen conifer: FB and KV; one deciduous conifer: YK) and the remaining site is tundra (TK). Three sites (FB, TK, and YK) are in the permafrost region, while KV is underlain by seasonally frozen ground. Second, we aim to discern the cause of differences among models, or between models and observations, by employing statistical evaluations such as multivariate analyses and time series analyses to investigate the connections between the metrics and individual eco-climate variables. This will improve understanding of the interrelation between the incorporated processes in each model. Finally, we will conduct sensitivity tests for the model parameters to quantify the effect of parameter sensitivity on models’ reproducibility.
Printer-friendly Version Interactive Discussion
GTMIP: overview and experiment protocol for Stage 1 S. Miyazaki et al.
Title Page Abstract
Introduction
Conclusions
References
Tables
Figures
J
I
J
I
Back
Close
Full Screen / Esc
Discussion Paper |
3454
8, 3443–3479, 2015
|
25
Discussion Paper
20
GMDD
|
15
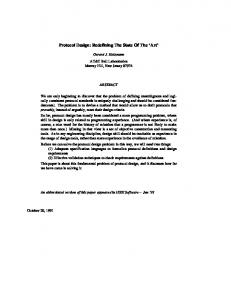
As of 1 March 2015, 16 TPMs have been participating in the GTMIP, Stage 1. Those models are the permafrost model (FROST), physical snow models (SMAP and SNOWPACK), land surface models (2LM, HAL, JULES, several versions of MATSIRO, and SPAC-Multilayer), a physical and biogeochemical soil dynamics model (PB-SDM), terrestrial biogeochemical models (BEAMS, Biome-BGC, STEM1, and VISIT), dynamic global vegetation models (LPJ and SEIB-DGVM, coupled with a land surface model [Noah-LSM] or stand-alone), and a coupled hydrological and biogeochemical model (CHANGE). The models with higher degrees of complexity in their treatment of physical processes are 2LM, CHANGE, FROST, HAL, JULES, MATSIRO, PB-SDM, SNOWPACK, SMAP, and SPAC-multilayer. The models with higher degrees of complexity in their treatment of biogeochemical processes are BEAMS, Biome-BGC, CHANGE, LPJ, SEIB-DGVM, STEM1, and VISIT. The models enabled to couple with AOGCMs (currently, JULES, HAL, LPJ, MATSIRO, and SMAP) make up about 30 % of the participating models. To illustrate the variability of the participating models with respect to the implemented physical and biogeochemical processes, we created a diagram showing the habitat of the models (Fig. 2) by incorporating the model survey results referred to in the previous section. The spread of the currently participating models is large for both physical pro-
Discussion Paper
10
Participating models
|
2.6
Discussion Paper
5
Although the temporal resolution of a variable should depend on the model, we are requesting submission of the variables with the minimum temporal resolution available for the model. For the models that provide daily outputs, the time for each day should be defined by the local time (FB: UTC − 10; KV: UTC + 2; TK: UTC + 9; YK: UTC + 9; CH: UTC + 10; TR: UTC + 7). Those models that use the no-leap calendar (365 days for all years) are requested to leave out 29 February. For those models with a 360 day calendar, data on DOYs 90, 151, 212, 304, and 365 (corresponding to 31 March, 31 May, 31 July, 31 October, and 31 December in a no-leap year) should be left out.
Printer-friendly Version Interactive Discussion
3
3455
GMDD 8, 3443–3479, 2015
GTMIP: overview and experiment protocol for Stage 1 S. Miyazaki et al.
Title Page
|
Abstract
Introduction
Conclusions
References
Tables
Figures
J
I
J
I
Back
Close
| Full Screen / Esc
Discussion Paper
25
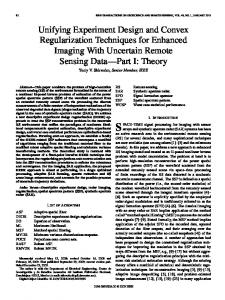
Annual mean latent heat flux is one of the best metrics for evaluating the energy and water budget reproducibility of TPMs for annual time scales. Figure 3 shows a comparison of the model outputs by site, expressing intra-model variations by box plots. When observed values were available (i.e., for FB for 2011–2013 and YK for 1998, 2001, 2003, 2004, 2007, and 2008), they are shown by black dots. The physicalprocesses-oriented models (hereafter, P-models: 2LM, JULES, MATSIRO, and PBSDM) generally reproduced observed latent heat flux well at FB and YK, while the biogeochemical-processes-oriented models (hereafter, BG-models: BEAMS (only for 2001–2011), Biome-BGC, CHANGE, SEIB-DGVM, and VISIT) tended to show higher values than the observations. The inter-model variation of Qle_total_an among BGmodels was higher than among P-models at KV and TK, where it was not possible to compare the model output with data since no flux observations were conducted. Annual maximum snow depth is an important metric for evaluating the snowpack process, especially the snow accumulation process, and the water resources in TPMs. Figure 4 shows a similar comparison to Fig. 3 for maximum snow depth. Note that for
Discussion Paper
20
Latent heat flux and annual maximum snow depth
|
15
3.1
Discussion Paper
10
This section presents preliminary results based on the outputs already submitted for the Stage 1A, in which the land cover and soil type parameters are kept at the default settings shown in Table 2. In this paper, we have focused on the four metrics mentioned in Sect. 2.4: annual mean latent heat flux (Qle_total_an), annual maximum snow depth (SnowDepth_max), annual gross primary production (GPP_an), and annual net ecosystem production (NEP_an).
|
5
Preliminary results
Discussion Paper
cesses and biogeochemical processes, which will benefit the evaluation and attribute examinations of the models regarding their ability to reproduce observations.
Printer-friendly Version Interactive Discussion
8, 3443–3479, 2015
GTMIP: overview and experiment protocol for Stage 1 S. Miyazaki et al.
Title Page Abstract
Introduction
Conclusions
References
Tables
Figures
J
I
J
I
Back
Close
| Full Screen / Esc
Discussion Paper
25
Discussion Paper
20
|
Annual gross primary production is a good indicator for evaluating the photosynthesis process in TPMs. Figure 5 shows a similar analysis to Fig. 3, but for GPP_an from BG-models (BEAMS, Biome-BGC, CHANGE, LPJ, SEIB-DGVM, STEM1, and VISIT for carbon budget). The observed values for the carbon budget are available only at FB (2011–2013) and YK (2004–2012). The simulated GPP_an for FB covers a wide range of values, from half the observed value of 0.4 kg C m−2 yr−1 to more than three times the observed value. The simulated GPP_an for YK showed smaller variations both among models and between models and observed values, from half the observed value of −2 −1 0.6 up to 0.7 kg C m yr . Results for KV, showed similar variations (50 %) to FB, with no outliers. Results for TK show the smallest absolute values, with small inter-model variations, which are probably due to the characteristics of the tundra vegetation. Annual net ecosystem production is a substantial parameter in determining whether a site is a carbon source or sink. Figure 6 shows a similar analysis to Fig. 5, but for NEP_an. The simulated NEP_an was positive at all sites except one outlier at FB, which suggests all the examined sites are carbon sinks. The simulated NEP_an for FB was about 0.03–0.06 kg C m−2 yr−1 , while the observed value was almost zero. Note that the value for the observation at FB is only derived from 2011–2012, while that for 3456
GMDD
|
15
Carbon budget
Discussion Paper
3.2
|
10
Discussion Paper
5
those models that calculate snow water equivalent (SWE) but not snow depth (SD), we converted SWE to SD assuming a constant snow density of 300 kg m−3 . Snow observations were conducted at all sites: for 1980–2012 at FB, 1996–2013 at KV, 1980–2008 at TK, and 1980–2008 at YK. While dedicated snow models are good at reproducing maximum snow depth (except for at TK), those models with an invariant snow density show relatively lower values than the observations. Both P-models (2LM, JULES, MATSIRO, PB-SDM, and SMAP for snow) and BG-models gave values that were approximately double the observed values of the SnowDepth_max at TK. This overestimation of SnowDepth_max at TK is probably related to the formation of wind crust or snowdrift by strong winds, as noted by Hirashima et al. (2004).
Printer-friendly Version Interactive Discussion
4
|
3457
GTMIP: overview and experiment protocol for Stage 1 S. Miyazaki et al.
Title Page Abstract
Introduction
Conclusions
References
Tables
Figures
J
I
J
I
Back
Close
Full Screen / Esc
Discussion Paper
Acknowledgements. This study is supported by the GRENE Arctic Climate Change Research Project, Ministry of the Ministry of Education, Culture, Sports, Science and Technology, Japan.
8, 3443–3479, 2015
|
The Supplement related to this article is available online at doi:10.5194/gmdd-8-3443-2015-supplement.
Discussion Paper
20
GMDD
|
15
Discussion Paper
10
This paper presented the experiment protocol for Stage 1 of the GTMIP, with site simulations using the GRENE-TEA site observation data in the pan-Arctic region for the previous three decades. We have described the framework of our project including targets, provided datasets, conditions on model integration, analysis plans, lists of model output variables, and the habitat of currently participating models. We also included the results from a preliminary analysis of the model–model and model–observation comparison with respect to the major metrics defined for energy budget, snowpack dynamics, and the carbon budget. Through this model intercomparison project for the coldregion terrestrial physical and biogeochemical models, we will be able to offer insightful demonstrations of various TPMs and valuable information for future improvements of the relevant models. All meteorological driving data for this project have already been made publicly available through ADS. The model outputs and comprehensive results from the GTMIP, which we hope will provide a useful benchmark dataset for the community, will also be available to the public at the end of the project.
|
5
Summary
Discussion Paper
simulation is a 34 year average. The simulated NEP_an for YK was about half of the observed value. Generally the inter-model range of NEP_an was smaller than that of GPP_an.
Printer-friendly Version Interactive Discussion
5
GTMIP: overview and experiment protocol for Stage 1 S. Miyazaki et al.
Title Page Abstract
Introduction
Conclusions
References
Tables
Figures
J
I
J
I
Back
Close
Full Screen / Esc
Discussion Paper |
3458
8, 3443–3479, 2015
|
30
Discussion Paper
25
GMDD
|
20
Discussion Paper
15
|
10
Abramowitz, G., Leuning, R., Clark, M., and Pitman, A.: Evaluating the performance of land surface models, J. Climate, 21, 5468–5481, 2008. Adler, R. F., Huffman, G. J., Chang, A., Ferraro, R., Chang, A., Ferraro, R., Xie, P. P., Janowiak, J., Rudolf, B., Scheneider, U., Curtis, S., Bolvin, D., Gruber, A., Susskind, J., Arkin, P., and Nelkin, E.: The version-2 Global Precipitation Climatology Project (GPCP) monthly precipitation analysis (1979–present), J. Hydrometeorol., 4, 1147–1167, 2003. Ahlstrom, A., Schurgers, G., Arneth, A., and Smith, B.: Robustness and uncertainty in terrestrial ecosystem carbon response to CMIP5 climate change projections, Environ. Res. Lett., 7, 044008, doi:10.1088/1748-9326/7/4/044008, 2012. Anav, A., Friedlingstein, P., Kidston, M., Bopp, L., Ciais, P., Cox, P., Jones, C., Jung, M., Myneni, R., and Zhu, Z.: Evaluating the land and ocean components of the global carbon cycle in the CMIP5 Earth system models, J. Climate, 26, 6801–6843, 2013. Arora, V. K., Boer, G. J., Friedlingstein, P., Eby, M., Jones, C. D., Christian, J. R., Bonan, G., Bopp, L., Brovkin, V., Cadule, P., Hajima, T., Ilyina, T., Lindsay, K., Tjiputra, J. F., and Wu, T.: Carbon-concentration and carbon-climate feedbacks in CMIP5 Earth system models, J. Climate, 26, 5289–5314, 2013. Brown, R. D. and Robinson, D. A.: Northern Hemisphere spring snow cover variability and change over 1922–2010 including an assessment of uncertainty, The Cryosphere, 5, 219– 229, doi:10.5194/tc-5-219-2011, 2011. Brutel-Vuilmet, C., Ménégoz, M., and Krinner, G.: An analysis of present and future seasonal Northern Hemisphere land snow cover simulated by CMIP5 coupled climate models, The Cryosphere, 7, 67–80, doi:10.5194/tc-7-67-2013, 2013. Cramer, W., Kicklighter, D. W., Bondeau, A., Moore, B., Churkina, G., Nemry, B., Ruimy, A., Schloss, A. L., and the participants of the Potsdam NPP model intercomparison: Comparing global models of terrestrial net primary productivity (NPP): overview and key results, Glob. Change Biol., 5, 1–15, 1999. Dee, D. P., Uppalaa, S. M., Simmonsa, A. J. Berrisford, P., Poli, P., Kobayashi, S., Andrae, U., Balmaseda, M. A., Balsamo, G., Bauer, P., Bechtold, P., Beljaars, A. C. M., van de Berg, L., Bidlot, J., Bormann, N., Delsol, C., Dragani, R., Fuentes, M., Geer, A. J., Haimberger, L., Healy, S. B., Hersbach, H., H’olm, E. V., Isaksen, L., Kallberg, P., Kohler, M., Matricardi, M., McNally, A. P., Monge-Sanz, B. M., Morcrette, J.-J., Park, B.-K., Peubey, C., de Rosnay, P.,
Discussion Paper
References
Printer-friendly Version Interactive Discussion
3459
|
8, 3443–3479, 2015
GTMIP: overview and experiment protocol for Stage 1 S. Miyazaki et al.
Title Page Abstract
Introduction
Conclusions
References
Tables
Figures
J
I
J
I
Back
Close
| Full Screen / Esc
Discussion Paper
30
Discussion Paper
25
GMDD
|
20
Discussion Paper
15
|
10
Discussion Paper
5
Tavolato, C., Thepaut, J.-N., and Vitart, F.: The ERA-Interim reanalysis: configuration and performance of the data assimilation system, Q. J. Roy. Meteor. Soc., 137, 553–597, 2011. Dirmeyer, P. A., Schlosser, C. A., and Brubaker, K. L.: Precipitation, recycling, and land memory: an integrated analysis, J. Hydrometeorol., 10, 278–288, 2009. Ekici, A., Chadburn, S., Chaudhary, N., Hajdu, L. H., Marmy, A., Peng, S., Boike, J., Burke, E., Friend, A. D., Hauck, C., Krinner, G., Langer, M., Miller, P. A., and Beer, C.: Site-level model intercomparison of high latitude and high altitude soil thermal dynamics in tundra and barren landscapes, The Cryosphere Discuss., 8, 4959–5013, doi:10.5194/tcd-8-4959-2014, 2014. Essery, R., Rutter, N., Pomeroy, J., Baxter, R., Stahli, M., Gustafsson, D., Barr, A., Bartlett, P., and Elder, K.: SnowMIP2: an evaluation of forest snow process simulations, B. Am. Meteorol. Soc., 90, 1120–1135, doi:10.1175/2009BAMS2629.1, 2009. Etchevers, P., E. Martin, E., Brown, R., Fierz, C., Lejeune, Y., Bazile, E., Boone, A., Dai, Y. J., Essery, R., Fernandez, A., Gusev, Y., Jordan, R., Koren, V., Kowalczyk, E., Nasonova, N. O., Pyles, R. D., Schlosser, A., Shmakin, A. B., Smirnova, T. G., Strasser, U., Verseghy, D., Yamazaki, T., and Yang, Z. L.: Validation of the surface energy budget simulated by several snow models, Ann. Glaciol., 38, 150–158, 2004. Friedlingstein, P., Cox, P., Betts, R., Bopp, L., Bloh, W. V., Brovkin, V., Cadule, P., Doney, S., Eby, M., Fung, I., Bala, G., John, J., Jones, C., Joos, F., Kato, T., Kawamiya, M., Knorr, W., Lindsay, K., Matthews, H. D., Raddatz, T., Rayner, P., Reick, C., Roeckner, E., Schnitzler, K. G., Schnur, R., Strassmann, K., Weaver, J., Yoshikawa, C., and Zeng, N.: Climate– carbon cycle feedback analysis: results from the C4 MIP model intercomparison, J. Climate, 19, 3337–3353, 2006. Harris, I., Jones, P. D., Osborn, T. J., and Listera, D. H.: Updated high-resolution grids of monthly climatic observations – the CRU TS3.10 Dataset, Int. J. Climatol., 34, 623–642, 2014. Henderson-Sellers, A., Yang, Z. L., and Dickinson, R. E.: The Project for Intercomparison of Land Surface Schemes (PILPS), B. Am. Meteorol. Soc., 74, 1335–1349, 1993. Hirashima, H., Ohata, T., Kodama, Y., Yabuki, H., Sato, N., and Geoggiadi, A.: Nonuniform distribution of tundra snow cover in eastern Siberia, J. Hydrometeorol., 5, 373–389, 2004. Huntzinger, D. N., Schwalm, C., Michalak, A. M., Schaefer, K., King, A. W., Wei, Y., Jacobson, A., Liu, S., Cook, R. B., Post, W. M., Berthier, G., Hayes, D., Huang, M., Ito, A., Lei, H., Lu, C., Mao, J., Peng, C. H., Peng, S., Poulter, B., Riccuito, D., Shi, X., Tian, H., Wang, W., Zeng, N., Zhao, F., and Zhu, Q.: The North American Carbon Program Multi-Scale Synthesis
Printer-friendly Version Interactive Discussion
3460
|
8, 3443–3479, 2015
GTMIP: overview and experiment protocol for Stage 1 S. Miyazaki et al.
Title Page Abstract
Introduction
Conclusions
References
Tables
Figures
J
I
J
I
Back
Close
| Full Screen / Esc
Discussion Paper
30
Discussion Paper
25
GMDD
|
20
Discussion Paper
15
|
10
Discussion Paper
5
and Terrestrial Model Intercomparison Project – Part 1: Overview and experimental design, Geosci. Model Dev., 6, 2121–2133, doi:10.5194/gmd-6-2121-2013, 2013. Iwahana, G., Takano, S., Petrov, R. E., Tei, S., Shingubara, R., Maximov, T. C., Fedrov, A. N., Desyatkin, A. R., Nikolaev, A. N., Desyatkin, R. V., and Sugimoto, A.: Geocryological characteristics of the upper permafrost in a tundraforest transition of the Indigirka River Valley, Russia, Polar Science, 8, 96–113, doi:10.1016/j.polar.2014.01.005, 2014. Kodama, Y., Sato, N., Yabuki, H., Ishii, Y., Nomura, M., and Ohata, T.: Wind direction dependency of water and energy fluxes and synoptic conditions over a tundra near Tiksi, Siberia, Hydrol. Process., 21, 2028–2037, 2007. Kotani, A., Kononov, A. V., Ohta, T., and Maximov, T. C.: Temporal variations in the linkage between the net ecosystem exchange of water vapour and CO2 over boreal forests in eastern Siberia, Ecohydrology, 7, 209–225, doi:10.1002/eco.1449, 2013. Koven, C. D., Ringeval, B., Friedlingstein, P., Ciais, P., Cadule, P., Khvorostyanov, D., Krinner, G., and Tarnocai, C.: Permafrost carbon-climate feedbacks accelerate global warming, P. Natl. Acad. Sci. USA, 108, 14769–14774, doi:10.1073/pnas.1103910108, 2011. Koven, C. D., Riley, W. J., and Stern, A.: Analysis of permafrost thermal dynamics and response to climate change in the CMIP5 Earth System Models, J. Climate, 26, 1877–1900, 2013. Lopez, M. L., Saito, H., Kobayashi, K., Shirota, T., Iwahana, G., Maximov, T. C., and Fukuda, M.: Interannual environmental-soil thawing rate variation and its control on transpiration from Larix cajanderi, central Yakutia, Eastern Siberia, J. Hydrol., 338, 251–260, doi:10.1016/j.jhydrol.2007.02.039, 2007. McGuire, A. D., Christensen, T. R., Hayes, D., Heroult, A., Euskirchen, E., Kimball, J. S., Koven, C., Lafleur, P., Miller, P. A., Oechel, W., Peylin, P., Williams, M., and Yi, Y.: An assessment of the carbon balance of Arctic tundra: comparisons among observations, process models, and atmospheric inversions, Biogeosciences, 9, 3185–3204, doi:10.5194/bg9-3185-2012, 2012. Nakai, T., Kim, Y., Busey, R. C., Suzuki, R., Nagai, S., Kobayashi, H., Park, H., Sugiura, K., and Ito, A.: Characteristics of evapotranspiration from a permafrost black spruce forest in interior Alaska, Polar Science, 7, 136–148, 2013. Nakai, Y., Matsuura, Y., Kajimoto, T., Abaimov, A. P., Yamamoto, S., and Zyryanova, O. A.: Eddy covariance CO2 flux above a Gmelin larch forest in continuous permafrost of central Siberia during a growing season, Theor. Appl. Climatol., 93, 133–147, doi:10.1007/s00704007-0337-x, 2008.
Printer-friendly Version Interactive Discussion
3461
|
8, 3443–3479, 2015
GTMIP: overview and experiment protocol for Stage 1 S. Miyazaki et al.
Title Page Abstract
Introduction
Conclusions
References
Tables
Figures
J
I
J
I
Back
Close
| Full Screen / Esc
Discussion Paper
30
Discussion Paper
25
GMDD
|
20
Discussion Paper
15
|
10
Discussion Paper
5
Ohta, T., Hiyama, T., Tanaka, H., Kuwada, T., Maximov, T. C., Ohata, T., and Fukushima, Y.: Seasonal variation in the energy and water exchanges above and below a larch forest in eastern Siberia, Hydrol. Process., 15, 1459–1476, 2001. Ohta, T., Maximov, T. C., Dolman, A. J., Nakai, T., van der Molen, M. K., Kononov, A. V., Maximov, A. P., Hiyama, T., Iijima, Y., Moors, E. J., Tanaka, H., Toba, T., and Yabuki, H.: Interannual variation of water balance and summer evapotranspiration in an eastern Siberian larch forest over a 7-year period (1998–2006), Agr. Forest Meteorol., 148, 1941–1953, 2008. Ohta, T., Kotani, A., Iijima, Y., Maximov, T. C., Ito, S., Hanamuraa, M., Kononov, A. V., and Maximov, A. P.: Effects of waterlogging on water and carbon dioxide fluxes and environmental variables in a Siberian larch forest, 1998–2011, Agr. Forest Meteorol., 188, 64–75, 2014. Piao, S., Stich, S., Ciais, P., Friedlingstein, P., Peylin, P., Wang, X., Ahstrom, A., Anav, A., Candell, J. G., Cong, N., Huntingford, C., Jung, M., Levis, S., Levy, P. E., Li, J., Lin, X., Lomas, M. R., Lu, M., Luo, Y., Ma, Y., Myneni, R. B., Poulter, B., Sun, Z., Wang, T., Viovy, N., Zaehle, S., and Zeng, N.: Evaluation of terrestrial carbon cycle models for their response to climate variability and CO2 trends, Glob. Change Biol., 19, 2117–2132, 2013. Qian, H., Joseph, R., and Zeng, N.: Enhanced terrestrial carbon uptake in the Northern High Latitudes in the 21st century from the coupled carbon cycle climate model intercomparison project model projections, Glob. Change Biol., 16, 641–656, doi:10.1111/j.13652486.2009.01989.x, 2010. Rawlins, M. A., McGuire, A. D., Kimball, J. K., Dass, P., Lawrence, D., Burke, E., Chen, X., Delire, C., Koven, C., MacDougall, A., Peng, S., Rinke, A., Saito, K., Zhang, W., Alkama, R., J. Bohn, T., Ciais, P., Decharme, B., Gouttevin, I., Hajima, T., Ji, D., Krinner, G., Lettenmaier, D. P., Miller, P., Moore, J. C., Smith, B., and Sueyoshi, T.: Assessment of model estimates of land–atmosphere CO2 exchange across Northern Eurasia, Biogeosciences Discuss., 12, 2257–2305, doi:10.5194/bgd-12-2257-2015, 2015. Saito, K., Yasunari, T., and Takata, K.: Relative roles of large-scale orography and land surface processes in the global hydroclimate. Part II: Impacts on hydroclimate over Eurasia, J. Hydrometeorol., 7, 642–659, 2006. Saito, K. Miyazaki, S., Mori, J., Ise, T., Arakida, H., Sueyoshi, T., Hajima, T., Iijima, Y., Yamazaki, T., and Sugimoto, A.: GTMIP Meteorological Driving Dataset for the GRENE-TEA Observation Sites (Level 0.2), 0.20, Arctic Data Archive System (ADS), Japan, available at: https://ads.nipr.ac.jp/dataset/A20141009-005 (last access: 26 March 2015), 2014a.
Printer-friendly Version Interactive Discussion
3462
|
8, 3443–3479, 2015
GTMIP: overview and experiment protocol for Stage 1 S. Miyazaki et al.
Title Page Abstract
Introduction
Conclusions
References
Tables
Figures
J
I
J
I
Back
Close
| Full Screen / Esc
Discussion Paper
30
Discussion Paper
25
GMDD
|
20
Discussion Paper
15
|
10
Discussion Paper
5
Saito, K., Miyazaki, S., Mori, J., Ise, T., Arakida, H., Suzuki, R., Sato, A., Iijima, Y., Yabuki, H., Iijima, Y., Sueyoshi, T., Hajima, T., Sato, H., Yamazaki, T., and Sugimoto, A.: GTMIP Meteorological Driving Dataset for the GRENE-TEA Observation Sites (Level 1.0), 1.00, Arctic Data Archive System (ADS), Japan, available at: https://ads.nipr.ac.jp/dataset/A20141009-006 (last access: 26 March 2015), 2014b. Saito, K., Sasai, T., Miyazaki, S., Mori, J., Ise, T., Arakida, H., Sueyoshi, T., Hajima, T., Iijima, Y., Yamazaki, T., and Sugimoto, A.: GTMIP Fraction of Photosynthetically Active Radiation (fPAR) and Leaf Area Index (LAI) for the GRENE-TEA Observation Sites (Level 1.0), 1.00, Arctic Data Archive System (ADS), Japan, available at: https://ads.nipr.ac.jp/dataset/ A20141009-007 (last access: 26 March 2015), 2014c. Saito, K., Miyazaki, S., Mori, J., Ise, T., Arakida, H., Suzuki, R., Sato, A., Iijima, Y., Yabuki, H., Iijima, Y., Sueyoshi, T., Hajima, T., Sato, H., Yamazaki, T., and Sugimoto, A.: GTMIP Meteorological Driving Dataset for the GRENE-TEA Observation Sites (20-Year Detrended), 1.00, Arctic Data Archive System (ADS), Japan, available at: https://ads.nipr.ac.jp/dataset/ A20150205-001 (last access: 26 March 2015), 2015. Sasai, T., Saigusa, N., Nasahara, K. N., Ito, A., Hashimoto, H., Nemani, R. R., Hirata, R., Ichii, K., Takagi, K., Saitoh, T. M., Ohta, T., Murakami, K., Yamaguchi, Y., and Oikawa, T.: Satellite-driven estimation of terrestrial carbon flux over Far East Asia with 1-km grid resolution, Remote Sens. Environ., 115, 1758–1771, doi:10.1016/j.rse.2011.03.007, 2011. Sato, A., Kubota, H., Matsuda, M., and Sugiura, K.: Seasonal variation of heat exchange in the boreal forest of Finnish Lapland, in: Second Wadati Conference, on Global Change and the Polar Climate, 7–9 March, Tsukuba, Japan, extended abstracts, 228–230, 2001. Slater, A. G. and Lawrence, D. M.: Diagnosing present and future permafrost from climate models, J. Climate, 26, 5608–5623, doi:10.1175/JCLI-D-12-00341.1, 2013. Sueyoshi, T., Saito, K., Miyazaki, S., Mori, J., Ise, T., Arakida, H., Suzuki, R., Sato, A., Iijima, Y., Yabuki, H., Hajima, T., Sato, H., Yamazaki, T., Sugimoto, A.: GRENE-TEA Model Intercomparison Project (GTMIP) forcing and evaluation dataset, Earth Syst. Sci. Data, in preparation, 2015. Takata, K.: Sensitivity of land surface processes to frozen soil permeability and surface water storage, Hydrol. Process., 16, 2155–2172, 2002. Taylor, K. E., Stouffer, R. J., and Meehl, G. A.: An overview of CMIP5 and the experiment design, B. Am. Meteorol. Soc., 93, 485–498, 2012.
Printer-friendly Version Interactive Discussion
| Discussion Paper
10
Discussion Paper
5
Wang, W., Rinke, A., Moore, J. C., Cui, X., Ji, D., Li, Q., Zhang, N., Wang, C., Zhang, S., Lawrence, D. M., McGuire, A. D., Zhang, W., Delire, C., Koven, C., Saito, K., MacDougall, A., Burke, E., and Decharme, B.: Diagnostic and model dependent uncertainty of simulated Tibetan permafrost area, The Cryosphere Discuss., 9, 1769–1810, doi:10.5194/tcd-9-17692015, 2015. Watanabe, K., Mizoguchi, M., Kiyosawa, H., and Kodama, Y.: Properties and horizons of active layer soils in tundra at Tiksi, Siberia (in Japanese with English abstract), J. Japan S. Hydrol. Water Resour., 13, 9–16, 2000. Zhang, T. J., Frauenfeld, O. W., Serreze, M. C., Etringer, A., Oelke, C., McCreight, J., Barry, R. G., Gilichinsky, D., Yang, D., Ye, H., Ling, F., and Chudinova, S.: Spatial and temporal variability in active layer thickness over the Russian Arctic drainage basin, J. Geophys. Res. Atmos., 110, D16101, doi:10.1029/2004JD005642, 2005.
GMDD 8, 3443–3479, 2015
GTMIP: overview and experiment protocol for Stage 1 S. Miyazaki et al.
Title Page Introduction
Conclusions
References
Tables
Figures
J
I
J
I
Back
Close
|
Abstract
Discussion Paper |
Full Screen / Esc
Discussion Paper |
3463
Printer-friendly Version Interactive Discussion
Discussion Paper |
Energy and water budget
Partition of energy and water at surface, canopy, and subsurface, albedo Snow water equivalent, snow density, snow cover duration (length and dates) Annual maximum leaf area index, growing season (length and dates) Active layer thickness (in permafrost) or maximum seasonal frozen depth, trumpet curve, ice content ratio Net primary production, heterotrophic and autotrophic respiration, net ecosystem production, stored carbon mass in different pools, turnover rates
Snowpack (snow cover ratio, snow depth/snow water equivalent) Phenology Ground freezing/thawing, active layer
Carbon budget
Discussion Paper
B: target processes and metrics
8, 3443–3479, 2015
GTMIP: overview and experiment protocol for Stage 1 S. Miyazaki et al.
Title Page Abstract
Introduction
Conclusions
References
Tables
Figures
J
I
J
I
Back
Close
|
A: key processes categories
Discussion Paper
Table 1. The key process categories and target processes.
GMDD
| Full Screen / Esc
Discussion Paper |
3464
Printer-friendly Version Interactive Discussion
Discussion Paper
Table 2. The location, dominant vegetation type, soil, climate, fraction of photosynthetically active radiation (fPAR), possible data for validation, and references for observed data for (a) Fairbaks, (b) Kevo, (c) Tiksi, (d) Yakutsk, (e) Chokurdakh, and (f) Tura. (a): Fairbanks (Poker Flat Research Range), Alaska, USA
|
1
|
3465
S. Miyazaki et al.
Title Page Abstract
Introduction
Conclusions
References
Tables
Figures
J
I
J
I
Back
Close
Full Screen / Esc
Discussion Paper
Reference
GTMIP: overview and experiment protocol for Stage 1
|
Data available for model validation
Discussion Paper
fPAR and LAI
8, 3443–3479, 2015
|
Climate
65◦ 070 2400 N, 147◦ 290 1500 W 210 m Black spruce forest 0–14 cm layer: moss 14–25 cm: undecomposed organic layer 25–39 cm: decomposed organic layer 39 cm: silt soil 39–43 cm: silty and cryoturbated Active layer thickness: 43 cm in 2013 ◦ Mean annual air temperature: −2.8 C (2011) Annual precipitation: 312 mm (2011) fPAR: 0.03 (Jan), 0.05 (Feb), 0.05 (Mar), 0.13 (Apr), 0.39 (May), 0.69 (Jun), 0.69 (Jul), 0.69 (Aug), 0.43 (Sep), 0.23 (Oct), 0.06 (Nov), 0.00 (Dec) LAI: 0.05 (Jan), 0.09 (Feb), 0.09 (Mar), 0.23 (Apr), 0.99 (May), 2.26 (Jun), 2.32 (Jul), 1.90 (Aug), 0.80 (Sep), 0.49 (Oct), 0.10 (Nov), 0.01 (Dec) Snow depth, ground temperature (−0.05, −0.1, −0.2, −0.4, −1.0 m), soil moisture (−0.05, −0.1, −0.2, −0.4 m), leaf area index, albedo, FPAR (Fraction of photosynthetically active radiation), upward short and long wave radiation, energy and carbon fluxes Nakai et al. (2013)
Discussion Paper
Location Altitude Dominant vegetation type Soil
GMDD
Printer-friendly Version Interactive Discussion
Discussion Paper
Table 2. Continued.
|
(b): Kevo (Kevo Research Station), Finland
Climate
S. Miyazaki et al.
Title Page Abstract
Introduction
Conclusions
References
Tables
Figures
J
I
J
I
Back
Close
Full Screen / Esc
Discussion Paper |
3466
GTMIP: overview and experiment protocol for Stage 1
|
Reference
Discussion Paper
Data available for model validation
8, 3443–3479, 2015
|
fPAR and LAI 1
69◦ 450 2500 N, 27◦ 000 3700 E 100 m Pine forest 0–20 cm: humus soil 20–50 cm: sandy silt Mean annual air temperature: −1.6 ◦ C Annual precipitation: 415 mm fPAR: 0.03 (Jan), 0.06 (Feb), 0.08 (Mar), 0.11 (Apr), 0.51 (May), 0.56 (Jun), 0.69 (Jul), 0.76 (Aug), 0.68 (Sep), 0.45 (Oct), 0.10 (Nov), 0.02 (Dec) LAI: 0.05 (Jan), 0.10 (Feb), 0.14 (Mar), 0.21 (Apr), 1.13 (May), 1.63 (Jun), 2.52 (Jul), 2.78 (Aug), 1.66 (Sep), 1.18 (Oct), 0.21 (Nov), 0.05 (Dec) Snow depth, snow (0.1, 0.2, 0.3, 0.4, 0.5, 0.6, 0.7 m) and ground temperature (−0.1, −0.2, −0.3, −0.35 m), soil moisture (−0.1, −0.2, −0.3 m), albedo, upward short and long wave radiation Sato et al. (2001)
Discussion Paper
Location Altitude Dominant vegetation type Soil
GMDD
Printer-friendly Version Interactive Discussion
Discussion Paper
Table 2. Continued.
0
00
|
3467
S. Miyazaki et al.
Title Page Abstract
Introduction
Conclusions
References
Tables
Figures
J
I
J
I
Back
Close
Full Screen / Esc
Discussion Paper
Reference
◦
GTMIP: overview and experiment protocol for Stage 1
|
Data available for model validation
00
Discussion Paper
fPAR and LAI
1
0
8, 3443–3479, 2015
|
Climate
◦
71 35 21 N, 128 46 27 E 40 m Non-tussock sedge, dwarf-shrubs, and moss tundra 0–1 cm: partially decomposed litter 1–15 cm: loam 15–70 cm: silt with gravel Active layer thickness: 70 cm Mean annual air temperature: −13.5 ◦ C Annual precipitation: 331 mm fPAR: 0.00 (Jan), 0.00 (Feb), 0.00 (Mar), 0.00 (Apr), 0.03 (May), 0.29 (Jun), 0.45 (Jul), 0.47 (Aug), 0.28 (Sep), 0.04 (Oct), 0.00 (Nov), 0.00 (Dec) LAI: 0.00 (Jan), 0.00 (Feb), 0.00 (Mar), 0.00 (Apr), 0.05 (May), 0.52 (Jun), 0.88 (Jul), 0.73 (Aug), 0.49 (Sep), 0.07 (Oct), 0.00 (Nov), 0.00 (Dec) Snow depth, ground temperature (−0.1, −0.2, −0.3, −0.47, −1, −2, −3, −5, −10, −20, −30 m), soil moisture (0, −0.05, −0.15, −0.3 m), albedo, upward short and long-wave radiation Kodama et al. (2007), Watanabe et al. (2000)
Discussion Paper
Location Altitude Dominant vegetation type Soil
|
(c): Tiksi, Sakha Republic, Russian Federation
GMDD
Printer-friendly Version Interactive Discussion
(d): Yakutsk (Spasskaya Pad), Sakha Republic, Russian Federation
|
3468
S. Miyazaki et al.
Title Page Abstract
Introduction
Conclusions
References
Tables
Figures
J
I
J
I
Back
Close
Full Screen / Esc
Discussion Paper
62 15 18 N, 129 37 6 E 220 m Larch forest 0–20 cm: organic layer Upper mineral layer: sandy loam Lower mineral layer: silty loam (More than 80 % of root: within a soil depth of 20 cm) Active layer thickness: 1.2 m Mean annual air temperature: −10.2 ◦ C Annual precipitation: 188 mm fPAR: 0.00 (Jan), 0.00 (Feb), 0.00 (Mar), 0.05 (Apr), 0.28 (May), 0.46 (Jun), 0.42 (Jul), 0.21 (Aug), 0.03 (Sep), 0.00 (Oct), 0.00 (Nov), 0.02 (Dec) 0.00 LAI: 0.00 (Jan), 0.00 (Feb), 0.00 (Mar), 0.00 (Apr), 0.07 (May), 0.58 (Jun), 1.05 (Jul), 0.81 (Aug), 0.28 (Sep), 0.04 (Oct), 0.00 (Nov), 0.00 (Dec) Snow depth, ground temperature (−0.1, −0.2, −0.4, −0.6, −0.8, −1.2), soil moisture (−0.1, −02, −0.4, −0.6, −0.8 m), albedo, FPAR, upward short and long wave radiation, energy and carbon fluxes Ohta et al. (2001, 2008, 2014), Kotani et al. (2013), Lopez et al. (2007)
GTMIP: overview and experiment protocol for Stage 1
|
Reference
0 00
Discussion Paper
Possible data for model validation
◦
8, 3443–3479, 2015
|
fPAR and LAI 1
00
Discussion Paper
Climate
0
|
Location Altitude Dominant vegetation type Soil
◦
Discussion Paper
Table 2. Continued.
GMDD
Printer-friendly Version Interactive Discussion
Discussion Paper
Table 2. Continued.
Climate 1
◦
0
00
S. Miyazaki et al.
Title Page Abstract
Introduction
Conclusions
References
Tables
Figures
J
I
J
I
Back
Close
Full Screen / Esc
Discussion Paper |
3469
GTMIP: overview and experiment protocol for Stage 1
|
Reference
00
Discussion Paper
Data available for model validation
0
8, 3443–3479, 2015
|
fPAR and LAI
◦
70 33 48 N, 148 15 51 E 9m Tussock wetland/shrubs/sparse larch trees Clay loam, silty clay loam Active layer thickness: 0.4–0.7 m Mean annual air temperature: −13.4 ◦ C Annual precipitation: 196 mm fPAR: 0.00 (Jan), 0.00 (Feb), 0.00 (Mar), 0.00 (Apr), 0.00 (May), 0.01 (Jun), 0.18 (Jul), 0.45 (Aug), 0.48 (Sep), 0.26 (Oct), 0.07 (Nov), 0.02 (Dec) LAI: 0.00 (Jan), 0.00 (Feb), 0.00 (Mar), 0.00 (Apr), 0.02 (May), 0.32 (Jun), 0.91 (Jul), 0.79 (Aug), 0.41 (Sep), 0.15 (Oct), 0.00 (Nov), 0.00 (Dec) Ground temperature (−0.01, −0.05, −0.1, −0.2, −0.3, −0.4, −0.5, −0.75, −1.0, −1.5, −2.0, −2.5, −3.0, −4.0, −5.0, −5.5, −7.0, −10.0 m), soil moisture (−0.035, −0.145, −0.335, −0.535 m), albedo, upward short and long-wave radiation, energy and carbon fluxes Iwahana et al. (2014)
Discussion Paper
Location Altitude Dominant vegetation type Soil
|
(e): Chokurdakh (Kodack/Krybaya), Sakha Republic, Russian Federation
GMDD
Printer-friendly Version Interactive Discussion
Discussion Paper
Table 2. Continued.
Climate
Average values extracted from 1 km grid MODIS satellite from 2001 to 2011 (Sasai et al., 2011).
|
3470
S. Miyazaki et al.
Title Page Abstract
Introduction
Conclusions
References
Tables
Figures
J
I
J
I
Back
Close
Full Screen / Esc
Discussion Paper
1
GTMIP: overview and experiment protocol for Stage 1
|
Reference
Discussion Paper
Data available for model validation
8, 3443–3479, 2015
|
fPAR and LAI average value extracted from 1 km grid MODIS satellite from 2001 to 2011 (Sasai et al., 2011)
64◦ 120 3200 N, 100◦ 270 4900 E 250 m Larch forest (average age: 105 years in 2005) 10–20 cm organic layer Cryosol Active layer thickness: 1 m Mean annual air temperature: −8.9 ◦ C Annual precipitation: 360 mm fPAR: 0.00 (Jan), 0.00 (Feb), 0.00 (Mar), 0.01 (Apr), 0.20 (May), 0.48 (Jun), 0.52 (Jul), 0.49 (Aug), 0.29 (Sep), 0.10 (Oct), 0.00 (Nov), 0.00 (Dec) LAI: 0.00 (Jan), 0.00 (Feb), 0.00 (Mar), 0.01 (Apr), 0.46 (May), 1.28 (Jun), 1.43 (Jul), 1.17 (Aug), 0.48 (Sep), 0.17 (Oct), 0.00 (Nov), 0.00 (Dec) Ground temperature (−0.05, −0.1, −0.2, −0.4, −0.5), soil moisture (−0.05, −0.1, −0.2, −0.4, −0.5), albedo, FPAR, upward short and long-wave radiation, energy and carbon fluxes Nakai et al. (2008)
Discussion Paper
Location Altitude Dominant vegetation type Soil
|
(f): Tura, Russian Federation
GMDD
Printer-friendly Version Interactive Discussion
Discussion Paper
Table 3. The list of metrics for model performance evaluation for (a) energy and water budgets, (b) snowpack, (c) phenology, (d) subsurface hydrological and thermal states, and (e) the carbon budget. (a) Energy and water budget
|
Variable
Definition
Units
Direction (+)
Time step
Wm
Downward
seasonal annual
Qh_season, Qh_annual
Seasonally and annually averaged sensible heat flux
W m−2
Upward
seasonal annual
Qle_season, Qle_annual
Seasonally and annually averaged latent heat flux
W m−2
Upward
seasonal annual
Upward
seasonal annual
Out of soil column
seasonal annual
Out of soil column
seasonal annual
ET_season, ET_annual Qs_season, Qs_annual
Seasonally and annually averaged total evapotranspiration
−1
mm day
−1
Seasonally and annually averaged surface runoff
mm day
−1
Qsb_season, Qsb_annual
Seasonally and annually averaged subsurface runoff
mm day
Et_veg_season, Et_veg_annual
Seasonally and annually averaged transpiration of vegetation
mm day
Upward
seasonal annual
E_soil_season, E_soil_annual
Seasonally and annually averaged soil evaporation
mm day−1
Upward
seasonal annual
Wg_frac_season Wg_frac_annual
–
–
seasonal annual
deltaWg_season, deltaWg_annual
Seasonally and annually averaged fraction of saturation of soil water content (wilting = 0, saturation = 1) Seasonally and annually averaged change of stored soil moisture
mm day
–
seasonal annual
alpha_season, alpha_annual
Seasonally and annually averaged shortwave albedo
–
–
seasonal annual
E_can_season, E_can_annual
Seasonally and annually averaged canopy interception evaporation
mm day−1
Upward
seasonal annual
GTMIP: overview and experiment protocol for Stage 1 S. Miyazaki et al.
Title Page Abstract
Introduction
Conclusions
References
Tables
Figures
J
I
J
I
Back
Close
|
−1
Full Screen / Esc
Discussion Paper |
3471
−1
Discussion Paper
Seasonally and annually averaged net radiation
8, 3443–3479, 2015
|
Rn_season, Rn_annual
Discussion Paper
−2
GMDD
Printer-friendly Version Interactive Discussion
(b) Snowpack Variable
Annual maximum snow water equivalent and the date reached Annual maximum snow depth and the date reached Annual duration of snow cover h and the date of snow cover start/end Seasonally and annually averaged total sublimation from the ground snow pack
kg/m day m day day
2
Direction (+)
Time step
–
annual
–
annual
–
annual
mm day−1
Upward
annual
(c) Phenology Units
Annual maximum leaf area index Growing season length and the date of start/end of growing season
2
m m day
−2
Direction (+)
Time step
– –
annual annual
Discussion Paper
LAI_max GrowSeasonLentgh
Definition
|
Variable
(d) Subsurface hydrological and thermal states Definition
Units
Direction (+)
Time step
ALT or ThawDepth_max
Active layer thickness (permafrost region) or annual maximum thawing depth (seasonal frozen ground) and the date reached Annual maximum frozen depth and the date reached Annual range of soil temperature in pre-defined soil layer Annual maximum fraction of soil moisture mass in the solid phase in pre-defined soil layer
m
–
annual
Wg_frozfrac_max_depth
–
annual
K
–
annual
–
–
annual
|
3472
8, 3443–3479, 2015
GTMIP: overview and experiment protocol for Stage 1 S. Miyazaki et al.
Title Page Abstract
Introduction
Conclusions
References
Tables
Figures
J
I
J
I
Back
Close
Full Screen / Esc m
Discussion Paper
Tg_range_depth
GMDD
|
Variable
FrozenDepth_max
Discussion Paper
Sub_snow_season, Sub_snow_annual
Units
|
SWE_max Date_SWE_max SnD_max Date_SnD_max SnowDuration Date_start_snow_cover
Definition
Discussion Paper
Table 3. Continued.
Printer-friendly Version Interactive Discussion
Discussion Paper
Table 3. Continued. (e) Carbon budget
|
Direction (+)
Time step
kg C m−2 year−1 −2 −1 kg C m duration
Downward
–
annual growing season annual growing season annual growing season annual growing season annual growing season annual growing season annual
kg C m−2
–
annual
1 yr−1
–
–
1 yr−1
–
–
−2
−1
−2
−1
GPP_annual GPP_growing
Annual gross primary production
kg C m year −2 −1 kg C m duration
Rh_annual Rh_growing
Annual heterotrophic respiration on land
kg C m year kg C m−2 duration−1
Upward
Ra_annual Ra_growing
Annual autotrophic (plant) respiration on land
kg C m−2 year−1 kg C m−2 duration−1
Upward
−2
−1
Downward
NEP_annual NEP_growing
Annual net ecosystem productivity (=NPP-Rh) on land
kg C m year −2 −1 kg C m duration
Downward
Re_annual Re_growing
Annual and growing season ecosystem respiration (=Ra + Rh) on land Stored carbon mass in biomass pool Stored carbon mass in litter pool and soil Turnover rate of carbon in biomass pool Turnover rate of carbon litter pool and soil
kg C m−2 year−1 −2 −1 kg C m duration
Downward
cBiomass_annual TotCarLitSoil
|
3473
S. Miyazaki et al.
Title Page Abstract
Introduction
Conclusions
References
Tables
Figures
J
I
J
I
Back
Close
Full Screen / Esc
Discussion Paper
cTurnoverRate_soil
−2
GTMIP: overview and experiment protocol for Stage 1
|
cTurnoverRate_biomass
kg C m
Discussion Paper
Units
Annual and growing season net primary production on land
8, 3443–3479, 2015
|
Definition
NPP_annual NPP_growing
Discussion Paper
Variable
GMDD
Printer-friendly Version Interactive Discussion
Discussion Paper
0˚
Discussion Paper
60 ˚E
|
˚W 60
Kevo
GMDD 8, 3443–3479, 2015
GTMIP: overview and experiment protocol for Stage 1 S. Miyazaki et al.
Title Page Introduction
Conclusions
References
Tables
Figures
J
I
J
I
Back
Close
|
Abstract
12
0˚W
Tiksi
12
0˚E
Chokurdakh Yaktsk
|
Fairbanks
Discussion Paper
Tura
Full Screen / Esc
Figure 1. Location map of the GRENE-TEA sites.
|
3474
Discussion Paper
180˚
Printer-friendly Version Interactive Discussion
STEM1
CHANGE
|
SEIB-N
VISIT
Physical
BEAMS
FROST
JULES 2LM MAT-cnv MAT-rev SNOWPACK SMAP HAL
|
3475
GTMIP: overview and experiment protocol for Stage 1 S. Miyazaki et al.
Title Page Abstract
Introduction
Conclusions
References
Tables
Figures
J
I
J
I
Back
Close
Full Screen / Esc
Discussion Paper
Figure 2. The habitat of models participating in the GTMIP. The vertical and horizontal axes show the ratio of the incorporation of biogeochemical processes and physical processes, respectively.
8, 3443–3479, 2015
|
: enable to couple with AOGCM MAT-cnv: MATSIRO-4,-5 MAT-rev : MATSIRO-snowd, MATSIRO-permafrost
Discussion Paper
SPAC
GMDD
|
PB-SDM
Discussion Paper
B-BGC SEIB-M
Biogeochemical
LPJ
Discussion Paper
Models’ Habitat
Printer-friendly Version Interactive Discussion
40
Biogeochem.
Phys.
|
30
Max 75% 50% 25% Min Max 75% 50% 25% Min
20
10
Discussion Paper
Obs.
W/m2
Discussion Paper
Qle_total (annual mean)
GMDD 8, 3443–3479, 2015
GTMIP: overview and experiment protocol for Stage 1 S. Miyazaki et al.
Title Page Introduction
Conclusions
References
Tables
Figures
J
I
J
I
Back
Close
|
Abstract
FB
KV
TK
YK
Sites
Full Screen / Esc
Discussion Paper |
3476
|
Figure 3. Comparison of model outputs with observations, and the inter-model range for the annual mean latent heat flux for averages from 1980 to 2013. The results of biogeochemical and physical models are shown the boxes and lines in orange and blue, respectively. The biogeochemical models include BEAMS, Biome-BGC, CHANGE, SEIB-DGVM, and VISIT. The physical models include 2LM, JULES, MATSIRO, and PB-SDM. The orange and blue horizontal lines indicate medians. The bottom and top of the boxes correspond to the 25th and 75th percentiles of the average values, for 1980 to 2013 (except BEMAS, which is for 2001 to 2011), of model outputs. The bottom and top of the lines show the minimum and maximum outputs from the participating models, respectively. The dots show the observed average values for 2011, 2012, and 2013 at FB and for 1998, 2001, 2003, 2004, 2007, and 2008 at YK.
Discussion Paper
0
Printer-friendly Version Interactive Discussion
1.4
Phys.
Obs.
m
0.8 0.6
Discussion Paper
1.0
Biogeochem.
|
1.2
Max 75% 50% 25% Min Max 75% 50% 25% Min
Discussion Paper
SnowDepth (annual max)
GMDD 8, 3443–3479, 2015
GTMIP: overview and experiment protocol for Stage 1 S. Miyazaki et al.
Title Page Introduction
Conclusions
References
Tables
Figures
J
I
J
I
Back
Close
|
Abstract
0.2 0.0 FB
KV
TK
YK
|
3477
Full Screen / Esc
Discussion Paper
Figure 4. As for Fig. 3, except the plot displays annual maximum snow depth. The physical models include 2LM, JULES, MATSIRO, PB-SDM, SMAP, and SNOWPACK (for FB and KV only). The observation shows the average values for 1980–2012, 1996–2013, 1980–2008, and 1980–2008 at FB, KV, TK, and YK, respectively.
|
Sites
Discussion Paper
0.4
Printer-friendly Version Interactive Discussion
2.0
Max 75% 50% 25% Min
Biogeochem.
Discussion Paper
GPP (annual total)
|
Obs.
kgC/m2/yr
Discussion Paper
1.5
1.0
GMDD 8, 3443–3479, 2015
GTMIP: overview and experiment protocol for Stage 1 S. Miyazaki et al.
Title Page Introduction
Conclusions
References
Tables
Figures
J
I
J
I
Back
Close
|
Abstract
0.0 FB
KV
TK
YK
|
Sites
Discussion Paper
0.5
Full Screen / Esc
Figure 5. As for Fig. 3, except the plot displays annual gross primary production. The relevant biogeochemical models include BEAMS, Biome-BGC, CHANGE, LPJ, SEIB-DGVM, STEM1, and VISIT. The observation shows the average values for 2011–2013 and 2004–2012 at FB and YK, respectively.
Discussion Paper
3478
|
Printer-friendly Version Interactive Discussion
Biogeochem.
|
0.2
Obs.
0.0
8, 3443–3479, 2015
GTMIP: overview and experiment protocol for Stage 1 S. Miyazaki et al.
Title Page Abstract
Introduction
Conclusions
References
Tables
Figures
J
I
J
I
Back
Close
|
kgC/m2/yr
0.1
Discussion Paper
Max 75% 50% 25% Min
Discussion Paper
NEP (annual total)
GMDD
Discussion Paper
-0.1
-0.2 KV
TK
YK
Figure 6. As for Fig. 5, except the plot displays annual net primary production.
|
3479
Full Screen / Esc
Discussion Paper
Sites
|
FB
Printer-friendly Version Interactive Discussion