Implanting a device that performs both detection and closed- loop suppression is the ultimate goal. Today, the Responsive. Neurostimulator (RNS) by ...
Hardware-Friendly Seizure Detection with a Boosted Ensemble of Shallow Decision Trees Mahsa Shoaran, Masoud Farivar, Azita Emami Abstract— Efficient on-chip learning is becoming an essential element of implantable biomedical devices. Despite a substantial literature on automated seizure detection algorithms, hardwarefriendly implementation of such techniques is not sufficiently addressed. In this paper, we propose to employ a gradientboosted ensemble of decision trees to achieve a reasonable trade-off between detection accuracy and implementation cost. Combined with the proposed feature extraction model, we show that these classifiers quickly become competitive with more complex learning models previously proposed for hardware implementation, with only a small number of low-depth (d < 4) “shallow” trees. The results are verified on more than 3460 hours of intracranial EEG data including 430 seizures from 27 patients with epilepsy.
I. I NTRODUCTION Given the large population of patients with intractable epilepsy, the automatic detection of seizure onset has sparked great interest among researchers over the past 20 years. In addition to providing a vital seizure alert to the patient, caregiver or a therapeutic device, it significantly eases the task of reviewing and labeling seizure segments in a patient’s EEG, a time-intensive task routinely done by neurologists. Implanting a device that performs both detection and closedloop suppression is the ultimate goal. Today, the Responsive Neurostimulator (RNS) by NeuroPace provides an FDAapproved therapy option to reduce the seizure frequency. However, RNS is bulky, limited in number of channels, and only relies on simple hard thresholding with moderate seizure classification accuracy. The power and area constraints imposed by implantable devices do not allow the implementation of sophisticated on-chip classification algorithms. Indeed, even the simple arithmetic operations performed in conventional classification methods, such as SVMs [1] and k-nearest neighbor (KNN) algorithms [2] can become very costly with increasing number of recording channels and higher sampling rates. With only simple comparator stages as their building blocks, decision trees (DTs) are a preferable solution to reduce hardware design complexity. Despite all their advantages, decision trees are unfortunately very susceptible to overfitting in seizure detection, particularly due to the high dimensionality of the feature space. This necessitates a careful design. We present and evaluate a very light seizure detection algorithm using an ensemble of gradient-boosted decision tree classifiers. With the proposed feature extraction steps, we show that these ensembles can compete with more complex The authors are with the Electrical Engineering Department, California Institute of Technology, Pasadena, CA. E-mail: {mshoaran, mfarivar, azita}@caltech.edu
978-1-4577-0220-4/16/$31.00 ©2016 IEEE
learning models proposed for on-chip implementation, with only a small number of low-depth trees. The proposed approach is tested on a large dataset of over 140 days of intracranial EEG data from 27 epileptic patients. Related Work: [3] has utilized a decision tree spike classification method that interleaves 8 neural channels into one decision tree block. Operating at 50kHz, the proposed system performs spike sorting with negligible power and area per channel. As opposed to spikes that can be classified into multiple shapes, the seizure detection problem is normally simplified into two states of seizure and non-seizure, thus exhibits great potentials for a hardware-optimized implementation using decision trees. In another application [4], a wearable gait monitor using decision tree classifiers achieved roughly identical detection accuracy to support vector machines, while drawing three times less power. It therefore provides a framework for power-efficient detection in wearable systems, by hierarchical activation of sensors through a hierarchical decision tree classifier [4]. The authors in [5] propose a non-linear classifier using Adaboost technique with decision stumps (trees with depth of one) as base classifier, to achieve a low complexity seizure detection system. However, as discussed in Section III, the choice of d = 3 achieves a better trade-off between classification performance and implementation complexity. II. DATA D ESCRIPTION AND M ETHODOLOGY A. Intracranial EEG Data In this work, we use the publicly available data from the iEEG portal1 [6], augmented with 8 additional patients from the UPenn and Mayo clinic’s seizure detection competition dataset [7], 7 of whom are iEEG recorded at 5kHz and one at 500Hz. The portal includes iEEG recordings at both high and low sampling rates and various types of epilepsy. All patients in the portal with three or more expert marked seizures are included in this analysis. The access IDs of analyzed patients and further details are provided in Table I. In total, more than 3460 hours of data from 27 patients including 430 seizures are processed. B. Feature Selection Based on our initial study on discriminative performance versus hardware complexity of several frequency and time domain features, and the existing literature in [8]-[11], we limited ourself to the following set of features: linelength, time-domain variance, and multiple band powers,
1826
1 www.ieeg.org
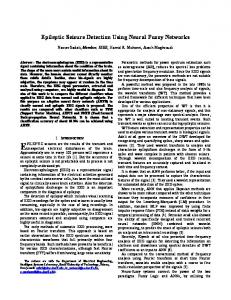
Comparison nodes
excellent accuracy, fast computation and operation. The output of a boosted � classifier (or regressor) has the additive form of H(x) = t αt ht (x). A general schematic diagram illustrating the components of an ensemble of depth-2 trees is shown in Fig. 1. In this paper, we have employed the XGBoost package [16], a parallelized implementation of Gradient-boosting algorithm. Applying this method to our iEEG dataset, we observed over 100 times improvement in training speed compared to common SVM implementations.
N
Y
N
N
Leaf values
Ȉ DECISION
Fig. 1: A general schematic diagram of a boosted ensemble of shallow decision trees proposed for hardware efficient seizure detection (here d = 2). as described in Table II. While studies on EEG signals have emphasized on an epileptic frequency range of below 30Hz [8], [10], the intracranial EEG (iEEG) signals span a wider frequency range, lately shown to go beyond 200Hz for seizure biomarker extraction [12], [13]. These highfrequency oscillations (HFOs) have been previously studied [14] on 36h of iEEG data to evaluate their seizure detection accuracy. The authors have concluded a significant potential of HFOs for seizure detection. In this work, we compare the discriminative performance of various frequency bands, including HFOs, on an extensive iEEG database. C. Gradient-Boosted Decision Trees Gradient-boosting [15] is one of the most successful machine learning techniques that exploits Gradient-based optimization and boosting, by adaptively combining many simple models to get an improved predictive performance. Binary split decision trees are commonly used as the “weak” learners. Boosted trees are at the core of the state-of-theart solutions in a variety of learning domains, given their TABLE I: Patient Data and Signal Acquisition Info. Subj. 1 2 3 4 5 6 7 8 9 10 11 12 13 14 15 16 17 18 19 20 21 22 23 24 25 26 27
iEEG Portal ID Study 004-2 Study 006 Study 040 Study 017 Study 011 Study 022 I001 P034 D01 Study 010 Study 023 Study 012-1 Study 027 Study 016 Study 031 I001 P010 D01 Study 030 Study 036 Study 020 Study 014 Study 021 Study 026 Study 024 Study 028 Study 038 Study 005 Study 012-2 Study 019 Study 033
No. Elec. 56 56 116 16 88 56 47 56 88 60 48 64 116 56 64 96 56 104 108 96 88 96 88 16 84 96 128
No. Seiz. 3 5 6 9 3 7 16 3 4 6 6 7 5 10 8 4 8 15 13 22 19 9 10 151 28 36 17
Rec. Dur. 7d 18h 1d 14h 2d 23h 7d 17h 3d 12h 3d 23h 1d 8h 12d 16h 2d 5h 3d 7h 3d 21h 5d 21h 6d 19h 3d 18h 5d 23h 4d 14h 5d 0h 6d 0h 6d 11h 3d 3h 8d 10h 1d 16h 3d 0h 6d 16h 13d 16h 5d 16h 6d 17h
Samp. Rate 500 500 5k 500 500 500 5k 500 500 500 500 500 500 5k 500 5k 500 500 500 500 500 500 500 500 500 500 500
III. C LASSIFIER D ESIGN AND P ERFORMANCE E VALUATION Decision trees are very efficient, but also susceptible to overfitting in problems with high feature-space dimensionality. One way to address this is to limit the number of nodes in each tree, i.e., design shallow trees using small number of features. Shorter trees are also more efficient in hardware and equally important, incur less detection delay. Therefore, it is important to carefully select the depth parameter and also to understand the relative predictive value of individual features in prior. Figure. 2 shows the Area Under the Curve (AUC) performance of an ensemble of gradient-boosted trees versus the number of trees for different values of the depth parameter. An important observation is that the detection accuracy is not significantly improved (< 0.5%) with the depth values of 4 and higher. As a simple benchmark, let us consider a boosted ensemble of 5 shallow trees with depth of 3, and compare it to linear SVM, cubic SVM and KNN3 models, previously proposed in the literature for on-chip classification. Figure. 3 shows the F1-measure performance of these classifiers across different patients. We can see that this benchmark is already competitive with its peers, and that it can outperform with larger ensemble sizes. In our simulations, this benchmark achieved an average seizure detection sensitivity of 98.3%. Figure. 4 summarizes the overall performance of examined features across patients. In order to obtain a more realistic estimation of accuracy under various measurement conditions, we have not used any pre-processing techniques. The performance could be further boosted by artifact removal, as some datasets (e.g. patient 3 and 18) are contaminated by high-frequency artifacts that particularly overlap with HFO band. Line-length stands out as the best single discriminative TABLE II: Evaluated Features Feature Line-Length (LLN) Power (POW) Variance (VAR) Delta Power (δ) Theta Power (θ) Alpha Power (α) Beta Power (β) Gamma Power (γ) Ripple Power (Ripple) Fast Ripple Power (FR) HFO Power (HFO)
1827
1 d
�
Description
d |x[n] − x[n − 1]|, d = window length Total spectral power � 1 1 � 2 d (x[n] − μ) where μ = d d (x[n]) d Spectral power in 1-4Hz Spectral power in 4-8Hz Spectral power in 8-13Hz Spectral power in 13-30Hz Spectral power in 30-80Hz Spectral power in 80-200Hz Spectral power in 200-250Hz @ SR = 500Hz, Spectral power in 200-600Hz @ SR = 5kHz Spectral power in 80-250Hz @ SR = 500Hz, Spectral power in 80-600Hz @ SR = 5kHz
Fig. 2: The overall classification performance at various depths versus number of trees. Fig. 4: Feature importance for patients with two different sampling rates of 500Hz and 5kHz. feature, in confirmation with the results reported in [8] and being used as a gold standard in [17]. It captures both low-amplitude fast and high-amplitude slow activities during the course of a seizure. As shown in Fig. 4, the optimal frequency range that exhibits the most discriminating epileptiform activity is patient-dependent, but in majority of patients sampled at a sufficiently high rate of 5k, it has a clear shift from Berger bands (delta, theta, alpha, beta) towards gamma, fast ripple, and more specifically, the HFOs. As discussed in [14], HFOs may be missing in some cases and hard to capture at low sampling rates. In addition, it is somewhat challenging to capture them due to presence of artifacts, their low amplitude and duration, and rare occurrence. However, their potential in early detection of seizure onset is promising, a factor of great importance in seizure control devices. Inspired by the early works on exploration and analysis of HFOs [13], several researchers are therefore seeking to alleviate these challenges by developing automatic detection methods [18] to ease the use of HFOs in clinical routine. Applying circuit techniques to suppress the effect of artifacts and improve the signal-to-noise ratio 1
SVM-PLY3 SVM-LIN
0.95
0.85 0.8 0.75 0.7 0.65 0.6 0.55
0
1
2
3
4
5
6
7
8
9
10
11
12
13
14
15
16
17
18
19
20
21
22
IV. H ARDWARE -F RIENDLY C LASSIFICATION As our feature importance studies showed, two features prove to be dominant: line-length and a single spectral power specific to each patient. Furthermore as shown in Fig. 2, very little improvement in performance is achieved by using trees with a depth of 4 and above. These findings can lead to proper design solutions to implement hardware-efficient decision trees, as discussed below. A. Mixed-Signal Decision Tree Topology
KNN3 DT
0.9
0.5
in measurements may help to successfully capture them in future devices. The results presented above encourage a patient-specific training step to set the frequency passband of the feature extraction filter, in order to get the desired performance for every patient. While the physical implementation of all spectral power features, then selection and elimination of failed ones may cause significant hardware cost, the circuitlevel tuning of a band-pass filter is much more practical. Upon training for each patient, the bandwidth may be fixed, as the dominant range of rhythmic seizure activity for each person is nearly consistent over time [10].
23
Fig. 3: Comparison of predictive ability (F1 Scores) of three different classification methods with an ensemble of five trees of depth d = 3.
In addition to choosing an inherently simple classifier such as DT, further hardware saving could be achieved by performing an initial detection in analog domain. As opposed to the fully digital approach in [19], we suggest to build a mixed-signal DT classifier by combining the light analog predetectors with more complex digital features. The proposed architecture is shown in Fig. 5. Since the final decision in majority of cases during the operation of device is equal to NO (i.e., seizures are rare events), the power consumption can be significantly reduced by performing an initial ultra-lowpower and sensitive analog detection within each channel (e.g. line-length and a tunable bandpass filter) and keeping the digital circuitry off during this phase. Once this step is completed, those channels with a “YES” or “UNCERTAIN” state are further processed in digital domain. This technique
1828
Fixed tree topology, depth = 3
Selected channels
FE1 LLN POWf1,f2
X1