WWW 2012 – LSNA'12 Workshop
April 16–20, 2012, Lyon, France
Harnessing User Library Statistics for Research Evaluation and Knowledge Domain Visualization Peter Kraker
Know-Center Inffeldgasse 21a 8010 Graz, Austria
[email protected]
Christian Körner
Graz University of Technology Inffeldgasse 21a 8010 Graz, Austria
[email protected]
Kris Jack
Mendeley 144a Clerkenwell Road London, EC1R 5DF, United Kingdom
[email protected]
Michael Granitzer
University of Passau Innstrasse 43 D-94032 Passau, Germany
[email protected] ABSTRACT
1.
Social reference management systems provide a wealth of information that can be used for the analysis of science. In this paper, we examine whether user library statistics can produce meaningful results with regards to science evaluation and knowledge domain visualization. We are conducting two empirical studies, using a sample of library data from Mendeley, the world’s largest social reference management system. Based on the occurrence of references in users’ libraries, we perform a large-scale impact factor analysis and an exploratory co-readership analysis. Our preliminary findings indicate that the analysis of user library statistics can produce accurate, timely, and content-rich results. We find that there is a significant relationship between the impact factor and the occurrence of references in libraries. Using a knowledge domain visualization based on co-occurrence measures, we are able to identify two areas of topics within the emerging field of technology-enhanced learning.
Social media o↵ers new possibilities for researchers to collaborate and communicate [29]. Social reference management systems in particular, enable researchers to store their references in an online library, and to share and discuss them with other users. Furthermore, social reference management systems provide information that can be used for the analysis of science. Quantitative analysis of science aims at investigating scholarly communication and reducing the information overload triggered by the exponential growth of scientific knowledge [22, 30]. These kinds of analyses help to evaluate scientific output (e.g. journal impact factor), and allow us to visualize scientific knowledge domains [28]. Therefore, they provide a concise overview of the literature, and give pointers to important publications and publication outlets. Quantitative analysis of science is usually based on largescale citation networks from scientific databases. The main drawback of this approach is that citations take a long time to become available, thus bringing considerable delay to the analysis. Furthermore, the corpus has to be limited, hence results vary depending on the data source being used [20]. With the advent of web-based archives such as PLoS1 and arXiv2 , usage measures like click data and download data have been suggested as a potential alternative to citations [24]. In comparison to citation data, usage data (1) becomes sooner available, (2) also contains informal communication and implicit links, and (3) is more resilient towards manipulation [1]. Nevertheless, usage based on click/download data is a very weak indicator of whether someone has actually read a paper. In social reference management tools like BibSonomy3 and Mendeley4 , we can go beyond mere usage: we are able to inspect the users’ library data. This is an improvement in
Categories and Subject Descriptors D.2.8 [Software Engineering]: Metrics; H.2.8 [Database Applications]: Scientific databases; H.3.4 [Systems and Software]: Information networks
General Terms Experimentation, Measurement
Keywords science mapping, impact factors, networks, user library statistics, readership, quantitative analysis, social reference management
1
INTRODUCTION
http://plos.org http://arxiv.org 3 http://bibsonomy.org 4 http://mendeley.com
Copyright is held by the International World Wide Web Conference Committee (IW3C2). Distribution of these papers is limited to classroom use, and personal use by others. WWW 2012 Companion, April 16–20, 2012, Lyon, France. ACM 978-1-4503-1230-1/12/04.
2
1017
WWW 2012 – LSNA'12 Workshop
April 16–20, 2012, Lyon, France teULike and BibSonomy) and show how social bookmarking information can be employed to describe journal usage. Kousha et al. [16] utilize web sources such as Google Scholar, blogs, and presentations to create an Integrated Online Impact (IOI) indicator. Li et al. [18] take a first step towards evaluating journal usage with library statistics. In a smallscale study, they compare citations from various established sources to Mendeley library uses of articles from Nature and Science. They find statistically significant correlations between citation counts and Mendeley library occurrences. To a smaller extent, usage data was also employed in scientific knowledge domain visualization e↵orts. Bollen and Van De Sompel [3] analyze usage data from a research library. They use consecutive accesses to journal articles as a measure of journal relationships. They derive clusters of journals which are statistically significantly related to ISI subject categories. Jiang et al. [14] are the first to use social reference information. They employ library statistics from CiteULike to form clusters based on the occurrence and cooccurrence of articles. They also correlate these clusters with ISI subject categories, and find them as e↵ective as citation-based clusters when removing journals that cannot be found in CiteULike. Our work goes beyond the state-of-the-art in two regards: (1) In the area of evaluation, we conduct an analysis including all journals listed in SCIMago. To the best of our knowledge, this is the first large-scale study based on library statistics. (2) In the area of knowledge domain visualization, we go beyond subject categories by utilizing information from the user profile to analyze an emerging field that is not yet covered by established subject categories.
several regards. First, we hypothesize that publications that are worthy of being added to a personal library are a better indicator of readership than clicks or downloads. Second, being able to precisely attribute papers to individual readers allows for a wealth of new analyses. With the help of profile information for example, we can segment data into di↵erent disciplines, and we can analyze di↵erent geographic regions and languages, addressing the spatial and social dimensions of science. Third, we are able to create publication networks derived from explicit and implicit links between references in libraries (e.g. established through sharing or co-occurrence), which is the basis for mapping the intellectual structure of a scientific domain. In this paper, we examine whether user library statistics can produce meaningful results with regards to evaluation and knowledge domain visualization. We conduct two empirical studies, using a sample of library data from Mendeley, the world’s largest social reference management system. Mendeley has 1.5 million users who collaboratively built the world’s largest scientific paper database of 50 million unique articles. Using the occurrence of references in users’ libraries, we perform a large-scale impact factor analysis and correlate the results with established measures of scientific impact. Furthermore, we perform an exploratory co-readership analysis in the field of technology-enhanced learning based on the co-occurrence of references. We then utilize research interests stated by users in their profiles to investigate an emerging field that is fragmented and therefore hard to describe using established subject categories. The remainder of the paper is structured as follows: in section 2, we examine related work. An overview of Mendeley and the infrastructure for large scale data analysis can be found in section 3. In section 4, we describe the dataset that was used. In sections 5 and 6, we report on the results of the empirical studies, including a detailed description of the dataset, the method used and the data processing applied. The paper finishes with a set of conclusions and an outlook on future work.
3.
COLLABORATIVE REFERENCE MANAGEMENT IN MENDELEY
Quantitative analysis of science using web data has been conducted before. Most of these e↵orts have been made in the area of evaluation and impact analysis. Darmoni et al. [8] are among the first to propose a usage based measure derived from electronic access to journals. Bollen et al. [2] outline the architecture and methodology of MESUR3 - a project dedicated to build a semantic model of the scholarly communication process in order to measure scholarly impact. Schloegl and Gorraiz [25] apply the usage impact factor formulated in that project to download rates from oncology journals. They find a moderate correlation between full-text article request and article citations, but lower correlations between usage impact factor and journal impact factor. Recent work has emphasized measures derived from social media.5 Priem and Hemminger [23] list several social media tools that could be leveraged for usage based evaluation, among them social bookmarking and online reference management. Haustein and Siebenlist [12] use data gathered from three di↵erent social bookmarking sites (Connotea, Ci-
Mendeley provides researchers with software tools that support them in conducting research [13]. One of the most popular of these tools is Mendeley Desktop, a cross-platform, freely downloadable PDF and reference management application. It helps users to organize their personal research libraries by storing them in relevant folders and applying tags to them for later retrieval. Mendeley Desktop also digitalizes the research process of reading and annotating articles through providing PDF viewing and annotation features, replacing the traditional process of printing an article to paper and annotating it with pen and highlighter. These articles, provided by users around the world, are then crowdsourced into a single collection called the Mendeley research catalogue (see [11] for details). This collection connects researchers and articles together in a network. In just over three years, Mendeley has built the world’s largest research catalogue6 , containing more than 50 million unique articles, crowd-sourced from over 1.5 million users, making it an interesting source of data for large scale network analysis. Furthermore, Mendeley enables users to create and maintain a user profile that includes their discipline, research interests, biographical information, contact details, and their own publications. Mendeley then takes this data and automatically generates a profile page for the user that acts as a CV in which they can showcase their expertise. The user’s publications are also augmented by readership counts, allow-
5 A very active community in this regard is altmetrics: http://altmetrics.org
6 The second largest collection is Reuter’s Web of Knowledge at around 40 million source items.
2.
RELATED WORK
1018
WWW 2012 – LSNA'12 Workshop
April 16–20, 2012, Lyon, France
5.
ing them to track the popularity of their individual papers within the Mendeley community. These readership counts indicate how many Mendeley users have added the author’s article to their personal research library. Mendeley has heavyweight data warehousing, analysis and serving requirements, making it particularly important to use technologies that operate at large scale. In crowd-sourcing the catalogue, for example, Mendeley Desktop must match a user’s article to the correct entry in the catalogue, a nearexact deduplication problem, or create a new entry for it, in real-time. Given millions of requests daily, Mendeley makes use of HBase7 , Apache’s open source, distributed, Big Data store, based on Google Bigtable [4], to permanently warehouse the data. HBase runs on Hadoop8 , a distributed file system, that implements a version of the MapReduce framework [9]. MapReduce is used in a variety of use cases, from crowd-sourcing the catalogue, to analyzing usage data that drive business analytics decisions. Mendeley also makes use of Apache’s PIG9 for quickly scripting MapReduce implementations. The data described in this paper, were generated and analyzed using PIG’s basic tool set plus some bespoke user defined functions.
4.
STUDY 1 - LARGE-SCALE ANALYSIS OF JOURNAL IMPACT
One way to measure the impact of a publication outlet is to assess the number of readers it has. Price [22] even argued that we are using citations to circumvent the problem of not being able to determine the number of readers. Nowadays, social reference management tools such as Mendeley enable us to approximate this information by inspecting the users’ library data. We hypothesize that publications that are worthy of being added to a personal library are a better indicator of readership than click or download data. For our calculations, we use the occurrences of documents which can be found in user libraries within the Mendeley system. We call this impact factor based on library statistics MRank. The question we want to answer is “How do the library occurrences reflect traditional measures of impact based on citations?” To validate our results, we compare them to data from SCIMago10 , which is based on Scopus11 data. To discover if certain disciplines are better suited for approximating journal impact on user library statistics, we selected three disciplines from the dataset: Arts, biology, and computer science. Furthermore we also included the complete dataset in the analysis, without splitting it into disciplines.
DATA
5.1
We used a snapshot from Mendeley library data from March 2011. The data set contains 437, 812 users and their libraries. The total number of unique documents contained is 18, 080, 679. Figure 1 gives an overview of the disciplines indicated by each user in his or her profile.
Data Processing
For the calculation of the usage based measures, we used documents that were published in 2008, 2009, and 2010. The following measures were computed from the Mendeley system: • Occurrences - Number of all occurrences of all papers of a journal in user libraries. • Unique Occurrences - Number of unique papers of a research outlet in the system. • Authority Score - Treating users as hubs and the journals included in their library as authorities, we calculated respective scores for both classes using Kleinberg’s HITS algorithm [15] with 500 iterations. The intuition is that the higher the authority score, the more influential a journal is. We calculated the correlation between the library information and the following traditional factors for measuring impact taken from SCIMago: • Total number of documents - Total number of documents that were published in the given year. • Citations per document - Average number of citations per document in a given year to documents from the two prior years. This is the classic impact factor. The journals from the two datasets were mapped through the string-wise comparison of the journal name. We included only journals that were present in both datasets. For the discipline-wise comparison, we mapped disciplines from Mendeley user profiles to the subject areas from SCIMago. We generated ranks for each of the measures and key figures and calculated Spearman’s rank correlation between the two groups of key data.
Figure 1: Distribution of the Users’ Disciplines in the Dataset
7
http://hbase.apache.org/ http://hadoop.apache.org/ 9 http://pig.apache.org/ 8
10 11
1019
http://www.scimagojr.com http://scopus.com
WWW 2012 – LSNA'12 Workshop
5.2
April 16–20, 2012, Lyon, France
Results
be expressed by users in their profile. The adoption of collaborative reference management was earlier reported in this field [17]. Small [27] proposed co-citation as a measure of subject similarity and co-occurrence of ideas. The basic proposition of this measure is that papers that are cited together are of the same area of topic. Co-citation has subsequently been used to visualize scientific fields, based on the most influential (i.e. most cited) authors. Examples include information management [26], hypertext [6], and also technologyenhanced learning [5]. In analogy, we use co-occurrences of references in libraries as measure for subject similarity. For this co-readership analysis, we employed multi-dimensional scaling (MDS). MDS is frequently used in visualizing scientific fields, see e.g. [26]. To verify our results from multidimensional scaling, we performed agglomerative hierarchical clustering on the data.
Table 1 shows the Spearman correlations of the total number of documents in SCIMago with unique occurrences of publications in Mendeley library data for the year 2010. The table shows that the number of unique papers of a journal in the Mendeley system correlates well with the number of total documents in SCIMago. This is a sign that the Mendeley corpus represents a good approximation for the research papers indexed by Scopus. It should be noted though that there are di↵erences between the disciplines. While biology and computer science compare relatively well, arts does not. One possible explanation is the number of users for each discipline (see Figure 1). Biology and computer science have the most users, while arts has only about a seventh of the users of biology. The arts data can be seen as less complete representations. Total Docs
Overall 0.70
Biology 0.76
Computer Science 0.57
Arts 0.28
Table 1: Spearman correlations for total documents in SCIMago with unique occurrences in Mendeley library data 2010 For the impact factor, we generated rankings for Mendeley library statistics for a two year timeframe (2008-2009). We compared this data with the impact factors from SCIMago for 2010. The results for these correlations can be seen in Table 2. Both the authority score as well as the occurrences in libraries show a good correlation with the impact factor. It is interesting to see that the authority score outperforms occurrences on all accounts. The HITS algorithm assigns a higher importance to users that have more references in their library measures, which gives them more authority. Biasing the ranking towards these power users seems to have an impact especially in disciplines with a lower number of users such as arts. HITS might be a good approximation for the traditional impact factors and therefore a good entry point for a library statistics based MRank impact factor measure. Overall Biology Computer Science Arts
Authority Score 0.64 0.60 0.60 0.52
Occurrences 0.53 0.56 0.59 0.30
Table 2: Spearman correlations for Mendeley library statistics of publications from 2008 and 2009 and the impact factor from SCIMago for 2010
6.
6.1
1. Adaptive Hypermedia (AH) Publications related to adaptive hypermedia and adaptive web-based learning. 2. Game-based Learning (GL) Publications related to game-based learning
STUDY 2 - KNOWLEDGE DOMAIN VISUALIZATION OF TECHNOLOGYENHANCED LEARNING
Inspired by the results from MRank, we conducted an exploratory study on scientific knowledge domain visualization using library data. We wanted to see whether the analogy of citation to readership can also be taken from co-citation to co-readership. We chose technology-enhanced learning (TEL) as the application domain, because TEL is an emerging field that is not yet included in traditional subject category systems. Instead, we identified researchers’ libraries from TEL by filtering research interests that can
Data Processing
For the second study, we limited the data to researchers from computer science. As shown above, user library statistics for computer science exhibit a reasonable coverage of recent publications in the field, and has a good correlation with the impact factor. The subset consists of 35, 560 user libraries, and 1, 964, 367 articles. At first, we had to extract all researchers from Technology Enhanced Learning. For that reason, we performed string comparisons between entries from the TEL thesaurus12 and research interests from Mendeley. In addition, we searched the research interests for the generic terms “learn”, “educat”, “pedagog”, “train”, “teach”, “class”, “school”, “college”, and ”university”. The results from that search were manually filtered to find TELspecific research interests that are not included in the TEL thesaurus. This lead to 1,025 profiles, and 256 corresponding libraries. In a next step, we retrieved all articles for these libraries, amounting to 47, 118 articles. We merged all articles with the same (lowercase) title and deleted those articles that were not related to research (such as “Introduction to Mendeley”), or had a nondescript title (e.g. “Thesis Proposal Presentation”). For the visualization, we limited the amount of documents that occur seven times or more within the user libraries, leading to a set of 25 articles (see Appendix A). We inspected titles and abstracts of these 25 publications, as well as their citation counts. On this basis, we manually attributed them to five categories:
3. Citation Classics (CC) Papers from TEL that do not fall in any of the previous two categories and received more than 200 citations in Google Scholar 4. Miscellaneous Publications from TEL (MC) Publications that are neither from AH or GL, and that did not receive a significant amount of citations 5. Publications from Other Disciplines (OD) 12
1020
http://thesaurus.telearn.org
WWW 2012 – LSNA'12 Workshop
April 16–20, 2012, Lyon, France
Other
Adaptive Hypermedia
20
AH5 AH6
AH7
OD1
AH3
CC6
10
AH1
MC2
0
CC5 MC1OD5 CC3
CC1 GL3
−10
Coordinate 2
AH2 AH4
CC2 CC4 GL1
−20
OD3
GL2 OD2 −30
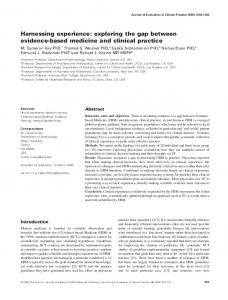
6.2
30
Finally, we performed the multi-dimensional scaling with R. We produced a co-occurrence matrix from the co-occurrences within individual libraries, which formed the basis of our approach. Next, we computed the Pearson correlation coefficient matrix based on the co-occurrence matrix. Diagonal values were treated as missing values, one of the suggested procedures in [19]. These correlation coefficients were then used to calculate Euclidian distances between the articles, which in turn provided the input for the MDS algorithm, cmdscale. We plotted the results to a two-dimensional space. For the agglomerative hierarchical clustering we employed Ward’s method (minimum variance). The input for the R command hclust was again the Euclidian distances matrix calculated from correlation coefficients.
Results
OD4
Game-based Learning −40
The results from multidimensional scaling can be seen in Figure 2. The publications have been divided into three di↵erent areas: (1) Adaptive Hypermedia (6 papers), (2) Game-based Learning (7 papers), and (3) Other (10 papers). The adaptive hypermedia area contains seven papers on the topic, as well as a citation classic in intelligent tutoring systems, of which adaptive hypermedia is an application area [21]. This area is very much expected as adaptive hypermedia is one of the core topics of technology-enhanced learning. This is also evidenced by recent co-citation studies by Chen and Lien [7] and Fisichella et al. [10], that surface distinct adaptive hypermedia clusters. Game-based Learning has gained a lot of attention in the recent years, as demonstrated by specific conferences like the “European Game-based Learning Conference”13 or “Games + Learning + Society”14 , and projects, e.g. “GALA - Network of Excellence for Serious Games”15 . The core of this area is formed by four papers that can be directly attributed to the subject. Furthermore, there are two articles from different disciplines, relating to artificial intelligence and to the concept of “flow”, as well as a citation classic from TEL on “situated cognition”. All of those topics are important to game-based learning, and it might be a sign of the relative immaturity of this concept, that researchers relate to publications from other disciplines and other areas within technology-enhanced learning. The “Other” area contains various publications from technology-enhanced learning, and several diverse publications from other disciplines. We attribute this to the fact that we restricted ourselves to one discipline; but even with more data, we do not expect to completely lose those “miscellaneous” publications. After all, technology-enhanced learning is still a highly transformative field with many outside influences, a process that regularly brings up new concepts such as mobile learning and educational data mining. The results from hierarchical clustering can be seen in Figure 3. The results are the same as in multi-dimensional scaling, with two notable exceptions: the papers AH4 and CC1 have been attributed to the game-based learning area. As one can observe, these two publications are also the closest to the game-based learning area in the MDS case in Figure 2. Again, we attribute this to the comparatively smaller
OD6 GL4
−20
0
20
40
Coordinate 1
Figure 2: Results from multidimensional scaling dataset. Nevertheless, it also shows that the results from these quantitative analyses require external validation and should not be taken as is.
Height 0
d hclust (*, "ward")
OD6 CC4 OD4 OD5 CC6 CC3 MC1 MC2 CC5 OD1 AH7 AH1 AH2 AH3 AH5 AH6 AH4 CC1 GL1 GL3 GL4 GL2 OD2 OD3 CC2
50
100
150
200
250
300
350
Other
Adaptive Hypermedia
Game-based Learning
Figure 3: Results from hierarchical clustering
7.
CONCLUSIONS AND FUTURE WORK
The results achieved in these two empirical studies are encouraging. They indicate that the analysis of user library statistics can produce accurate, timely, and content-rich results. In the first study, we showed a significant relationship between library statistics and the impact factor. There is an indication that results improve with the amount of references that are available in a field. Biology and computer science, which are well-represented, performed better than arts, which was badly represented at this point in time. In the second study, we produced meaningful results utilizing user profile information to select researchers from the field of technology-enhanced learning. Using a knowledge domain visualization based on co-occurrence measures, we
13
http://www.academic-conferences.org/ecgbl/ ecgbl2012/ecgbl12-home.htm 14 http://www.glsconference.org 15 http://galanoe.eu
1021
WWW 2012 – LSNA'12 Workshop
April 16–20, 2012, Lyon, France
were able to identify two areas of topics, one that is already well-established and one that has received a lot of attention lately. This leads us to believe that by including more data from other disciplines, we will be able to analyze a field like technology-enhanced learning thoroughly. There are certain limitations to our study. Regarding impact, we are currently only looking at publication outlets indexed with Scopus. In the future, we want to go beyond traditional publishing outlets and look at the impact of social media artifacts, such as blogs. Even though the results are promising, we clearly need further validation of our findings. Since there is an indication that results improve with more data, we will apply these measures to a new snapshot of the ever-increasing Mendeley catalog. For the knowledge domain visualization aspect, we want to go beyond just one discipline to present a complete map of a scientific field. We are also planning to include maps from the perspective of different disciplines. Thus, we can shed light on relationships in interdisciplinary research communities. Furthermore, we want to use more attributes from user profiles such as location and academic status. To get even closer to actual readership, we will incorporate click data in our results, e.g. the number of times a user looked at a certain paper. That way, we will be able to make more accurate predictions of whether someone has actually read a paper. We are in the process of exploiting these results in Mendeley. By visualizing a particular knowledge domain, users can quickly and easily learn important facts about a field, such as its current state and complexity, helping them to better contextualize their current research and target emerging areas of interest.
8.
[5]
[6]
[7]
[8]
[9]
[10]
[11]
ACKNOWLEDGMENTS
The authors would like to thank Dr. Barbara Kump for her valuable comments on the draft. The research presented in this work is in part funded by the European Commission as part of the FP7 Marie Curie IAPP project TEAM (grant no. 251514) and by the FWF Austrian Science Fund Grant I677. This contribution is partly funded by the KnowCenter, which is funded within the Austrian COMET program - Competence Centers for Excellent Technologies - under the auspices of the Austrian Federal Ministry of Transport, Innovation and Technology, the Austrian Federal Ministry of Economy, Family and Youth, and the State of Styria. COMET is managed by the Austrian Research Promotion Agency FFG.
[14]
9.
[16]
[12]
[13]
[15]
REFERENCES
[1] C. Bartneck and S. Kokkelmans. Detecting h-index manipulation through self-citation analysis. Scientometrics, 87(1):85–98, 2011. [2] J. Bollen, M. Rodriguez, and H. Van de Sompel. MESUR: usage-based metrics of scholarly impact. In Proceedings of the 7th ACM/IEEE-CS joint conference on Digital libraries, pages 474–474. ACM, 2007. [3] J. Bollen and H. van de Sompel. Mapping the structure of science through usage. Scientometrics, 69(2):227–258, 2006. [4] F. Chang, J. Dean, S. Ghemawat, W. C. Hsieh, D. A. Wallach, M. Burrows, T. Chandra, A. Fikes, and R. E. Gruber. Bigtable: A Distributed Storage System for Structured Data. In Proceedings of the 7th USENIX
[17]
[18]
[19]
[20]
1022
Symposium on Operating Systems Design and Implementation. ACM, 2008. K.-C. Chang, D.-Z. Chen, and M.-H. Huang. The relationships between the patent performance and corporation performance. Journal of Informetrics, 6(1):131–139, 2012. C. Chen and L. Carr. Trailblazing the literature of hypertext: author co-citation analysis (1989–1998). In Proceedings of the Tenth ACM Conference on Hypertext and Hypermedia, pages 51–60, New York, 1999. ACM. L.-C. Chen and Y.-H. Lien. Using author co-citation analysis to examine the intellectual structure of e-learning: A MIS perspective. Scientometrics, 89(3):867–886, 2011. S. Darmoni, F. Roussel, J. Benichou, B. Thirion, and N. Pinhas. Reading factor: a new bibliometric criterion for managing digital libraries. Journal of the Medical Library Association, 90(3):323–327, 2002. J. Dean and S. Ghemawat. MapReduce : Simplified Data Processing on Large Clusters. Communications of the ACM, 51(1):1–13, 2004. M. Fisichella, E. Herder, I. Marenzi, and W. Nejdl. Who are you working with? - Visualizing TEL Research Communities. In Proceedings of World Conference on Educational Multimedia, Hypermedia and Telecommunications, pages 283–292, 2010. J. A. Hammerton, M. Granitzer, D. Harvey, M. Hristakeva, and K. Jack. On generating large-scale ground truth datasets for the deduplication of bibliographic records. In International Conference on Web Intelligence, Mining and Semantics 2012, submitted. S. Haustein and T. Siebenlist. Applying social bookmarking data to evaluate journal usage. Journal of Informetrics, 5(3):446–457, 2011. V. Henning and J. Reichelt. Mendeley - A Last.fm For Research? IEEE Fourth International Conference on eScience, pages 327–328, 2008. J. Jiang, D. He, and C. Ni. Social reference: aggregating online usage of scientific literature in CiteULike for clustering academic resources. In Proceeding of the 11th Annual International ACM/IEEE Joint Conference on Digital libraries, pages 401–402. ACM, 2011. J. M. Kleinberg. Authoritative sources in a hyperlinked environment. J. ACM, 46:604–632, 1999. K. Kousha, M. Thelwall, and S. Rezaie. Using the Web for research evaluation: The Integrated Online Impact indicator. Journal of Informetrics, 4(1):124–135, 2010. P. Kraker and S. Lindstaedt. Research Practices on the Web in the Field of Technology Enhanced Learning. In Proceedings of the ACM WebSci’11, Koblenz, Germany, 2011. X. Li, M. Thelwall, and D. Giustini. Validating online reference managers for scholarly impact measurement. Scientometrics, 2011. K. W. Mccain. Mappping Authors in Intellectual Space: A Technical Overview. Journal of the American Society for Information Science, 41(6):433–443, 1990. L. I. Meho and K. Yang. Impact of Data Sources on
WWW 2012 – LSNA'12 Workshop
[21]
[22] [23]
[24] [25]
[26]
[27]
[28] [29] [30]
April 16–20, 2012, Lyon, France Code GL1
Citation Counts and Rankings of LIS Faculty: Web of Science Versus Scopus and Google Scholar. Journal of the American Society for Information Science, 58(13):2105–2125, 2007. T. Murray. Authoring Intelligent Tutoring Systems: An Analysis of the State of the Art. International Journal of Artificial Intelligence in Education, 10(1):98–129, 1999. D. J. D. S. Price. Little science, big science. Columbia Univ. Press, New York, 1963. J. Priem and B. M. Hemminger. Scientometrics 2.0: Toward new metrics of scholarly impact on the social Web. First Monday, 15(7), 2010. I. Rowlands and D. Nicholas. The missing link: journal usage metrics. Aslib Proceedings, 59(3):222–228, 2007. C. Schloegl and J. Gorraiz. Comparison of citation and usage indicators: the case of oncology journals. Scientometrics, 82(3):567–580, 2010. C. Schl¨ ogl. Bestandsaufnahme Informationsmanagement: Eine szientometrische, qualitative und empirische Analyse. Gabler, Wiesbaden, 2001. H. Small. Co-citation in the scientific literature: A new measure of the relationship between two documents. Journal of the American Society for Information Science, 24(4):265–269, 1973. M. Thelwall. Bibliometrics to webometrics. Journal of Information Science, 34(4):1–18, 2007. M. Waldrop. Science 2.0. Scientific American, 298(5):46–51, 2008. H. D. White and K. McCain. Bibliometrics. Annual Review of Information Science and Technology, 24:119–186, 1989.
GL2
GL3
GL4
CC1
CC2
CC3
CC4
CC5
CC6
MC1
MC2
OD1 OD2
APPENDIX A. ANALYZED PUBLICATIONS IN STUDY 2 Code AH1
AH2
AH3
AH4
AH5
AH6
AH7
Citation Brusilovsky, P. 2001. Adaptive Hypermedia. User Modeling and User Adapted Interaction. 1(11):87-110. De Bra, P. et al. AHA! The adaptive hypermedia architecture. Proceedings of the 14th ACM Conference on Hypertext and Hypermedia. 81-84. Brusilovsky, P. 1996. Methods and techniques of adaptive hypermedia. User Modeling and User Adapted Interaction. 23(6):87-129. De Bra, P. and Calvi, L. 1998. AHA! An open Adaptive Hypermedia Architecture. New Review Of Hypermedia And Multimedia. 1(4):115-139. Brusilovsky, P. and Peylo, C. 2003. Adaptive and Intelligent Web-based Educational Systems. International Journal of Artificial Intelligence in Education. 2-4(13):159-172. Brusilovsky, P. and Mill´ an, E. 2007. User models for adaptive hypermedia and adaptive educational systems. The Adaptive Web. P. Brusilovsky et al., eds. Springer. 3-53. Zaiane, O.R. 2002. Building a recommender agent for e-learning systems. International Conference on Computers in Education 2002, 55-59.
OD3 OD4 OD5 OD6
Occ. 59
54
54
46
38
27
24
1023
Citation Prensky, M. 2003. Digital game-based learning. Computers in Entertainment. 1(1):21. Morenoger, P. et al. 2008. Educational game design for online education. Computers in Human Behavior. 6(24):2530-2540. Garris, R. et al. 2002. Games, Motivation, and Learning: A Research and Practice Model. Simulation & Gaming. 4(33):441467. Zyda, M. 2005. From visual simulation to virtual reality to games. Computer. 9(38):2532. Murray, T. 1999. Authoring Intelligent Tutoring Systems: An Analysis of the State of the Art. International Journal of Artificial Intelligence in Education. 1(10):98-129. Brown, J.S. et al. 1989. Situated Cognition and the Culture of Learning. Educational Researcher. 1(18):32-42. Siemens, G. 2005. Connectivism: A learning theory for the digital age. International Journal of Instructional Technology and Distance Learning. 1(2):3-10. Lave, J. and Wenger, E. 1991. Situated Learning: Legitimate Peripheral Participation. Cambridge University Press. Stahl, G. et al. 2006. Computer-supported collaborative learning: An historical perspective. Cambridge handbook of the learning sciences. R.K. Sawyer, ed. Cambridge University Press. 409-426. Prensky, M. 2001. Digital Natives, Digital Immigrants Part 1. On the Horizon. 5(9):16. Rosen, A. 2009. e-Learning 2.0: Proven Practices and Emerging Technologies to Achieve Real Results. American Management Association. Romero, C. and Ventura, S. 2007. Educational data mining: A survey from 1995 to 2005. Expert Systems with Applications. 1(33):135-146. Berners-Lee, T. et al. 2001. The Semantic Web. Scientific American. 5(284):34-43. Csikszentmihalyi, M. 1990. Flow: The Psychology of Optimal Experience. Harper & Row Russell, S. and Norvig, P. 2003. Artificial Intelligence: A Modern Approach. Prentice Hall. Norman, D.A. 2002. The Design of Everyday Things. Basic Books. Bush, V. 1945. As we may think. Atlantic. Morris, G.M. et al. 1998. Automated docking using a Lamarckian genetic algorithm and an empirical binding free energy function. Journal of Computational Chemistry. 14(19):1639-1662.
Occ. 40 39
36
15
44
35
25
24
17
12
21
19
33 28
27 24 24 14