Remote Sens. 2011, 3, 1104-1138; doi:10.3390/rs3061104 OPEN ACCESS
Remote Sensing ISSN 2072-4292 www.mdpi.com/journal/remotesensing Article
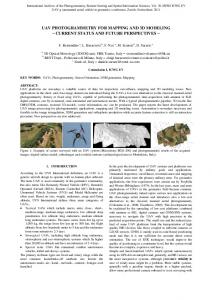
Heritage Recording and 3D Modeling with Photogrammetry and 3D Scanning Fabio Remondino 3D Optical Metrology (3DOM) Research Unit, Bruno Kessler Foundation (FBK), 38122 Trento, Italy; E-Mail:
[email protected] Received: 7 April 2011; in revised form: 16 May 2011 / Accepted: 17 May 2011 / Published: 30 May 2011
Abstract: The importance of landscape and heritage recording and documentation with optical remote sensing sensors is well recognized at international level. The continuous development of new sensors, data capture methodologies and multi-resolution 3D representations, contributes significantly to the digital 3D documentation, mapping, conservation and representation of landscapes and heritages and to the growth of research in this field. This article reviews the actual optical 3D measurement sensors and 3D modeling techniques, with their limitations and potentialities, requirements and specifications. Examples of 3D surveying and modeling of heritage sites and objects are also shown throughout the paper. Keywords: surveying; sensors; 3D modeling; photogrammetry; remote sensing; laser scanning; Cultural Heritage
1. Introduction The creation of 3D models of heritage and archaeological objects and sites in their current state requires a powerful methodology able to capture and digitally model the fine geometric and appearance details of such sites. Digital recording, documentation and preservation are demanded as our heritages (natural, cultural or mixed) suffer from on-going attritions and wars, natural disasters, climate changes and human negligence. In particular the built environment and natural heritage have received a lot of attention and benefits from the recent advances of range sensors and imaging devices [1,2]. Nowadays 3D data are a critical component to permanently record the form of important objects and sites so that, in digital form at least, they might be passed down to future generations. This has generated in the last decade a large number of projects, mainly led by research groups, which have
Remote Sens. 2011, 3
1105
realized very good quality and complete digital models [3-9]. Indeed remote sensing technologies and methodologies for Cultural Heritage 3D documentation and modeling [10] allow the generation of very realistic 3D results (in terms of geometric and radiometric accuracy) that can be used for many purposes, such as historical documentation [11,12], digital preservation and conservation [13,14], cross-comparisons, monitoring of shape and colors, simulation of aging and deterioration, virtual reality/computer graphics applications [15,16], 3D repositories and catalogues [17], web-based geographic systems, computer-aided restoration [18], multimedia museum exhibitions [19], visualization and so on. However, despite all these potential applications and the constant pressure of international heritage organizations, a systematic and targeted use of 3D surveying and modeling in the Cultural Heritage field is still not yet employed as a default approach and when a 3D model is generated, it is often subsampled or reduced to a 2D drawing due to a lack of software or knowledge in properly handling 3D data by non-expert. However, the availability and use of 3D data opens a wide spectrum of further applications and allows new analyses, studies, interpretations, conservation policies or digital restoration. Thus 3D virtual heritages should be more frequently used due to the great advantages that remote sensing technologies and the third dimension offer to the heritage world and to recognize the digital documentation and preservation needs stated in numerous international charters and resolutions. Unfortunately, there are still some difficulties of communications between the geomatics people and the heritage community. New technologies and new hardware are increasing the quality of 3D models with the purpose of attracting new people into the 3D world. Many companies entered inside this market developing and employing software and survey systems with good potentialities and often with very impressive results. Thus the number of 3D products is huge and if, on one hand, the cost of these technologies is slowly reducing, on the other hand it is difficult, in particular for non-specialists, to select the right product due to a lack of standard terminologies, specifications and performance benchmarking. Furthermore, new technologies can be a powerful tool to improve the classical standard of heritage recording and documentation and create a new methodology. However caution must be used and the new recording technologies have to be further studied and customized to be fully effective and useful, since even the standard bi-dimensional representations are still not problem-free. Although digitally recorded and modeled, our heritages require also more international collaboration and information sharing to make them accessible in all the possible forms and to all the possible users and clients. Nowadays, the digital documentation and 3D modeling of Cultural Heritage should always consist of [20]: – – – –
Recording and processing of a large amount of 3D (possibly 4D) multi-source, multi-resolution, and multi-content information; Management and conservation of the achieved 3D (4D) models for further applications; Visualization and presentation of the results to distribute the information to other users allowing data retrieval through the Internet or advanced online databases; Digital inventories and sharing for education, research, conservation, entertainment, walkthrough, or tourism purposes.
In the following sections, optical sensors for reality-based recording and modeling of large sites and complex objects are reported. The actual problems and open issues in the entire 3D modeling pipeline
Remote Sens. 2011, 3
1106
are also summarized. Since a large body of work on 3D recording and modeling with photogrammetry and 3D scanning exists, the paper mainly focuses on the most accepted and practically tested sensors, recording and 3D modeling approaches. Despite the fact that sensor’s technology is developing very fast and that very few standards are available for the sensor specifications, some summarizing tables of the existing active and passive sensors are also reported with their main performance parameters. 2. Recording Optical Sensors and Platforms Today a large number of remote sensing sensors and data are available for mapping purposes and digital recording of visual Cultural Heritage. Generally non-invasive optical recording sensors are divided in passive and active systems. Passive sensors (e.g., digital cameras) deliver image data which are then processed with some mathematical formulations to infer 3D information from the 2D image measurements. On the other hand, active sensors (e.g., laser scanner or radar) can provide data directly for 3D information or ranges. Terrestrial active and passive sensors employed to derive 3D shapes are often referred to 3D imaging techniques [21]. Synthetic Aperture Radar (SAR) systems (Table 1) are not considered as optical sensors, although their use for mapping and monitoring purposes is increasing in recent years with really impressive and interesting results [22-24]. Radar sensors are weather independent although the interpretation of radar images is more complicated if compared to optical images. Reality-based 3D surveying and modeling is meant as the digital recording and 3D reconstruction of visual and existing scenes using active sensors and range data (Section 2.1), passive sensors and image data (Section 2.2), classical surveying (e.g., total stations or GNSS), 2D maps [25] or an integration of the aforementioned methods (Section 2.3). The choice or integration depends on the required accuracy, object dimensions, location constraints, instrument’s portability and usability, surface characteristics, working team experience, project budget, final goal of the survey, and so on. On the other hand, non-real 3D modeling approaches are based on computer graphics software (e.g., 3D Studio Max, Maya, Sketchup, Blender, etc.) or procedural modeling approaches [26-28] allowing the generation of really remarkable 3D data without any particular survey or knowledge of a site and with generally no metrical results. 2.1. Active Optical Sensors Optical range sensors [29-31] like pulsed (Time-of-Flight), phase-shift and triangulation-based (light sheet or pattern projection) instruments have received much attention in recent years, also from non-experts, for 3D surveying and modeling purposes. Range sensors directly record the 3D geometry of surfaces, producing quantitative 3D digital representations (point clouds or range maps) in a given field of view with a defined measurement uncertainty. Range sensors are getting quite common in the mapping community and heritage field, despite their high costs, weight and the usual lack of good texture. Interferometry-based systems (not covered here) can also be used to capture accurate high resolution 3D data of Cultural Heritage [32-34]. Terrestrial range sensors (Tables 2 and 3) work from very short ranges (few centimeters up to a few kilometers) in accordance with surface proprieties and environment characteristics, delivering 3D data with accuracy from some microns up to some millimeters.
Remote Sens. 2011, 3
1107
Table 1. SAR missions and sensors (VV = Vertical transmit and Vertical receive polarizations; HH = Horizontal transmit and Horizontal receive; HV = Horizontal transmit and Vertical receive). Ground
Acquisition
Swath
Repeated
resol. (m)
mode
(km)
cycle
VV
25 m
Stripmap
100
35 days
HH
20 m
Stripmap
70
44 days
50–100
24 days
Stripmap
30–350
11 days
Stripmap,
100–
ScanSAR, AP
405
Mission/Sensor
Agency
Frequency
Polarization
ERS-1/-2
ESA
C-band
JERS-1
JAXA
L-band
RADARSAT-1
CSA NASA/JPL &
SRTM
DARA/ASI ESA
ASAR
10–100
X-/C-band
VV
20–30
C-band
HH/HV,
15–1,000
VV/VH
ALOS
JAXA
PALSAR-1 1/-2
HH
HH, VV,
ENVISAT
TerraSAR-X-
C-band
Astrium/Infoterra, DLR
(TanDEM-X) RADARSAT-2
CSA & MDA
L-band
X-band
C-band
COSMO Skymed-1/-2/-
ASI
X-band
3/-4 RISAT-1
ISRO
C-band
single, dual, full pol single, dual, full pol single, dual, full pol Single pol (HH or HV) Single, dual, full pol
7–100
Stripmap, ScanSAR
Stripmap, ScanSAR
35 days
20–350
46 days
15–60
11 days
50–500
24 days
5–100
15 days
10–240
12 days
Stripmap, 1–16
ScanSAR, Spotlight
3–100
Stripmap, ScanSAR Stripmap,
1–15
ScanSAR, Spotlight Stripmap,
2–50
ScanSAR, Spotlight
Table 2. Most common close-range terrestrial range sensors (LL = Laser light; TR = Triangulation-based systems; SL = Structured light systems). Meas. principle
Lateral res (mm)
Range (cm)
Accura cy (m)
SL
0.02–0.8
6–150
5–100
SL
0.01–0.8
3–150
5–120
ShapeGrabber
LL-TR
0.02
Gom ATOS III Nextengine Creaform EXAscan PolhemusFastSCAN Kreon SOLANO Artec MHT 3D
SL LL-TR LL-TR LL-TR LL-TR LL-TR
0.01–0.6 0.05 0.5@200 mm
21, 29, 63, 120 16–45
28, 38, 87, 275 40–100 40 130 40 100
Minolta Range7
LL-TR
Vialux
SL
Breuckmann stereoSCAN Breuckmann smartSCAN3D-HE
0.5 0.08, 0.14, 0.16, 0.28 0.1
10 40–100 54, 97, 109, 194 30
Weight (kg)
Acquisition
~6
~1 s
~4
~1 s
1 (1.3 Mpx)
>14
>18K pts/s
2 (8 Mpx) 2 (3 Mpx) 2 1 or 2 1 1 (1.3 Mpx)
3.2 1.25
120 s 25 K pts/s