Byblos, Lebanon 1401 2010. Abstract. Rule-based classifiers are supervised learning techniques that are extensively used in various domains. This type of.
Heuristic Approaches for Optimizing the Performance of Rule-Based Classifiers Danielle Azar and Haidar Harmanani Department of Computer Science and Mathematics Lebanese American University Byblos, Lebanon 1401 2010
Abstract Rule-based classifiers are supervised learning techniques that are extensively used in various domains. This type of classifiers is popular because of its nature which makes it modular and easy to interpret and also because of its ability to provide the classification label as well as the reason behind it. Rule-based classifiers suffer from a degradation of their accuracy when they are used on new data. In this paper, we present an approach that optimizes the performance of the rule-based classifiers on the testing set. The approach is implemented using five different heuristics. We compare the behavior on different data sets that are extracted from different domains. Favorable results are reported.
1
Introduction
The binary classification problem is one of assigning to a given case or instance one of two pre-existing classification labels. Formally, binary classification is defined as follows: Given T = (vi , ci ) of n data points where vi =< a1 , a2 , ...ak >∈ Rd is a vector of k attributes and ci ∈ {+1, −1}, the objective is to find a mapping M from the vector space to the set of classification labels with a low error rate. Most learning algorithms (such as C4.5 [1], feedforward neural networks and back propagation) divide T into two sets – a learning set that they use to build the mapping and a testing set that they use to validate the mapping. The mapping is a prediction model that is evaluated in terms of its error rate which is extracted from the contingency matrix shown in Table 1. The rows in the contingency matrix indicate the true classification label of data points in T , the columns indicate the classification label as given by the mapping. The error rate of M is defined as 1 − Accuracy. The accuracy is given by (TP +TN )/(TP +TN +FP +FN ) where TP is the number of true positives i.e. positive cases that are correctly classified as positive; TN is the number of true negatives i.e. negative cases that are correctly classified as negative; FP is the number of false positives i.e. negative IEEE IRI 2011, August 3-5, 2011, Las Vegas, Nevada, USA 978-1-4577-0966-1/11/$26.00 ©2011 IEEE
cases incorrectly classified as positive, and FN is the number of false negatives i.e. positive cases that are incorrectly classified as negative. In this work, we assume that all misclassifications incur the same cost and hence we formulate our problem as an optimization problem where the goal is to maximize the accuracy or equivalently minimize the error rate without taking into consideration the classification label. Typically, such models show an increase in their error rate when they are used on a testing set. We design and implement five different heuristics that minimize this error rate. In our problem, the input is a set of prediction models built by C4.5 and the output models are of the same form. These are rulesets that take the form of {R1 or R2 or ... or Rm−1 or Rm } where Ri , 1 < i ≤ m − 1 is a conjunction of conditions of the form Ri = C1 � ... � Cn → Lj where � indicates the boolean operator AN D, Lj is the classification label, and Rm is the default classification label. Classification models have been widely used in different domains. For example, in the medical domain, Das [9] compare different classification methods for diagnosing Parkinson disease. These include neural networks, DMneural, regression, and decision trees. Sakar et al. [10] use support vector machines to build classifiers for tele-diagnosing parkinson’s disease and selecting a minimal set of relevant features. Guvenir et al. [11] present a supervised learning algorithm for diagnosis and classification of heart arrhythmia. Wolberg et al. [12] use machine learning techniques for the diagnosis and prognosis of breast cancer. In the domain of software engineering, Selby et al. [13] and Mao et al. [14] used C4.5 to build models that predict reusability of a class in an object-oriented software system from metrics for inheritance, coupling and complexity. Basili et al. [15] used C4.5 to build models that estimate the cost of
P N
P TP FP
N FN TN
Table 1. Contingency Matrix
25
Rule 1: NOC > 5 Rule 2: CUB < 2 Default Class 1
Rule Set 2
Rule Set 1
1 NOM > 10
0 A
NOC
CUB
−1
10
0
1
B
1
1
5
−1
0
1
10
B
0
1
1
0 5
2
C
3
−1 0
D
10
Figure 2. Chromosome Encoding
0
rework in a library of reusable components. De Almeida et al. [16] use C4.5 rulesets to predict the average isolation effort and the average effort. Briand et al. [17] investigated the relationship between most of the existing coupling and cohesion measures defined at the level of a class in an object-oriented system on one hand, and fault-proneness on the other hand. Azar et al. [18] presented an adaptive approach in order to optimize models built from common domain knowledge to company-specific data in the domain of software quality. Classification models have also been widely successfully in bioinformatics [2], hardware design [3, 4], ecology [5], multiple business sectors [6], humanities [7] and cognition [8] among others.
wij ∈ {0, −1, +1} is a weight associated with edge eij joining nodes vi ∈ V1 and vj ∈ V2 ∪ V3 . If vj ∈ V3 then wij = 0. However, if vj ∈ V2 then wij = 1 when the underlying condition involves the > operator and −1 when the underlying condition involves the ≤ operator. cij is a color assigned to the weight that uniquely identifies the ruleset. pij is a pattern assigned to eij that uniquely identifies a rule in a ruleset. Figure 1 illustrates the graph representation of a ruleset. Figure 2 illustrates the chromosome encoding scheme. Each chromosome is attributed a fitness value that indicates the quality of the underlying solution. In our case, the fitness of a chromosome is equal to the accuracy of the underlying ruleset. The GA iterates to create new populations through the application of genetic operators on the individuals in the current population. We have implemented two crossover operators and four mutation operators. These are:
Proposed Heuristic Approaches
• Crossover: The crossover operator exchanges rules and conditions between two different rulesets. This is implemented based on two different crossover operators. The first one, pattern change, consists of picking edges of different patterns and exchanging their pattern. At a ruleset level, this results in rules being exchanged between two different rulesets. The second crossover operator, color swap, consists of swapping colors between two edges connecting attributes and values. This is equivalent to swapping two conditions between two different rulesets (edges picked should be of different colors). Figure 3 shows the color swap crossover operator. Crossover happens with a certain probability (50% and above). In case this operation is not performed, the offspring are exact copies of their parents.
This paper presents a method to optimize the prediction capacity of rule-based classifiers on new, unseen data. We propose an adaptive approach which uses classifiers built from data extracted from the domain and adapts them to new data from the same domain. We implemented five different heuristics, and tested them on different domains. Although we validate the approach with binary classifiers, but it can easily be expanded to work on problems that have more than two classification labels. In what follows, the five heuristic approaches, including genetic algorithms, simulated annealing, tabu-search, ant optimization, and the hybrid heuristic approach are presented.
2.1
5
0
Figure 1. Rule Set Encoding
2
B
1
1
2
−1
NOM
Genetic Algorithm
• Mutation: After crossover, one or more genes in the offspring are changed randomly by the application of the mutation operator. Mutation also happens with a certain probability (usually 0.1% and below). We implemented five different types of mutation. In the first one, the weight of the edge is inverted if it is either +1 or -1. This results in changing the operator in the underlying condition. The second mutation operator consists of changing the value of a classification node. This results in a change in the classification label of the
Genetic algorithms (GA) are an optimization technique that is inspired from the Darwinian theory of evolution whereby chromosomes compete and the fittest have a higher chance to survive and produce progeny. In our GA instantiation, a chromosome represents a ruleset, and is encoded as a tripartite graph G = {(V, E) : V = V1 ∪ V2 ∪ V3 } and V1 , V2 and V3 are pairwise disjoint. V1 is the set of nodes that encode attributes; V2 is the set of nodes encoding values appearing in conditions and V3 is the set of nodes encoding classification labels. E = {(eij , wij , cij , pij )} where
26
A
−1
−1 10
B
3
C
1 B
1
1 B
5
2
−1 5
D
10
(a) Before Crossover
A
−1
−1 10
B
3
C
1 B
1
1 B
5
2
−1 5
D
10
(b) After Crossover
Figure 3. Color Swap Crossover underlying rule. The third mutation operator consists of changing a node value and the final one consists of inserting two connected nodes in the graph. Weight and attributes involved in the edge addition are randomly chosen. This results in the addition of a condition in a ruleset. The value of the node is chosen from a list of cut-point values for this attribute. Cutpoint values are computed by sorting the data set by this attribute and considering the border cases, which are the cases at which the classification label in the data set changes. The cutpoint is then the midway of such two values. This value is chosen because it is susceptible of changing the classification of the ruleset [1]. After the application of crossover and mutation, the offspring are copied into the new population. The best chromosomes found in a population are preserved by the elitism operator (by copying them as is to the next population). The size of the populations is kept constant across all iterations. The whole process of creating new populations is repeated n times where n is computed empirically. It is important to point out that selection of the chromosomes happens with a probability proportional to their fitness.
2.2
called tabulist. It then avoids making moves towards one of the configurations that had already been visited before. We implemented a Tabu Search algorithm for optimizing the performance of rule-based classifiers using the same encoding scheme that we used in the GA formulation. Thus, a ruleset is represented as a tripartite graph. We have implemented six different perturbation functions that result in the deletion, addition, or change of conditions or rules. A transformation function is used to move from one solution to a neighbor one where a neighbor solution of a ruleset R is defined as a ruleset that is not on the tabu list and that differs from R either by a rule or by a condition. All transformations occur with equal probability. Two transformations have a deletion effect. One deletes a random rule from a ruleset and the other one deletes a random condition. The next two transformations add either a new random rule to the ruleset at a random location, or a random condition into a randomly chosen rule in the ruleset. The last two transformations replace either a rule or a condition picked randomly from the ruleset with a different randomly created one of the same type. The large number of proposed transformations makes it unlikely to cycle back to a previously visited solution within a small number of iterations. Experiments have shown that it is possible to keep a solution on the tabu list for 10 iterations, and then copy it back to the search pool without the algorithm getting stuck at a local optimum.
2.3
Simulated Annealing [20] is a global stochastic method that begins with an initial feasible configuration and proceeds to generate a neighboring solution by perturbing the current one. We have used the same encoding as in the GA, and implemented six types of perturbation functions each applied with equal probability. These are: 1. Rule deletion: Remove a random rule from the ruleset. 2. Condition deletion: Delete a random condition from a randomly selected rule in the ruleset. 3. Rule addition: Create a new random rule and insert it in the ruleset at a random position. 4. Condition addition: Create a random condition and inserting it in a randomly chosen rule in the ruleset.
Tabu Search
Tabu Search [19] is a “best-improvement-local-search” algorithm that uses a single solution in order to generate neighborhood solutions, based on a set of moves or transformations. From this neighborhood, the algorithm chooses the best solution and continue by creating a new set of moves. In order to avoid undoing changes made in previous moves and to prevent the algorithm from cycling in the search space, Tabu Search stores recent moves in a memory
Simulated Annealing
5. Rule change: Replace a randomly selected rule in the ruleset with a randomly created one. 6. Condition change: Replace a randomly selected condition in the ruleset with a randomly created one. We use the same cost function that we used in the GA. After each iteration, the neighboring solution is accepted if its cost is less than that of the current solution. Otherwise,
27
R1: A < 10 B>3 class 1 R2: A > 5 class 0 R3: A < 2 C>3 class 1 DC 0
R1:
A < 10 x
R2:
A>5
R3:
A3
1 0
C>3
1 0 xreverse
Figure 4. Ant Algorithm Implementation ΔC
it is accepted or rejected with probability p = e− T where T is the temperature, and ΔC is the change in cost between the neighboring solution and the current solution. The set of parameters controlling the initial temperature, stopping criterion, temperature decrement between successive stages, and the number of iterations for each temperature is called the cooling schedule. Typically, at the beginning of the algorithm, the temperature T is large and an inferior solution has a high probability of being accepted. During this period, the algorithm acts as a random search to find a promising region in the solution space. As the optimization process progresses, the temperature decreases and there is a lower probability of accepting an inferior solution.
2.4
Ant Colony Optimization
Ant colony optimization (ACO) is inspired by the behavior of ants in search for food and was first introduced for the Traveling Salesman Problem [21]. In real life, ants explore routes from the nest to the food and deposit pheromone traces during this search. Initially, ants march in different directions but with time, shorter routes get more pheromone, an indicator of their length and hence more ants are attracted to them. In artificial ant systems, ants build solutions stochastically using some combination of heuristic information and a pheromone trail. Communication between ants is done through the environment (by depositing pheromone). In our ACO algorithm, the underlying representation of a ruleset is a N xM matrix where N is one plus the number of rules in a ruleset and M is one plus the number of conditions in the longest rule in the ruleset. Each entry in the table indicates a condition in a rule or a class label (last column in the table) with the exception of the last row which is all empty except for the last column which encodes the default classification label. The algorithm starts by creating n ants at random locations in the matrix. The ants move downwards and change the content of each non empty cell probabilistically. If the cell encodes a condition, the change occurs either to the operator of the condition or the value with equal probability. Similar to the other heuristics, the values that the algorithm chooses from are the cut-points of the attribute. When the ant reaches the lower border of the
matrix, it moves right and then upwards. When it reaches the topmost row, it moves to the right and then downwards. When it reaches the rightmost lowest cell in the matrix, it move to the left and then up again. This ensures that every time an ant reaches a border, it goes to the longest unvisited adjacent cell. This march can be perturbed by the presence of pheromone in nearby cells. If the ant detects pheromone on nearby cells, it moves directly to that cell (breaking ties at random). The neighborhood region is three cells away (given the relatively small size of the ruleset and of the rules in the ruleset). The cycle is repeated n times and at the end of each iteration, the pheromone intensity decreases to avoid the premature convergence of all ants to a subset of conditions only. Figure 4 illustrates a ruleset (left hand side) and its matrix representing (right hand side). Solid red lines indicate how an ant marches on the matrix. Dashed lines indicate the path that the ant follows on its way back.
2.5
Hybrid Algorithm
The hybrid algorithm combines simulated annealing with genetic algorithms, and works in a three phase optimization scheme. Rule sets generated using C4.5 are individually optimized using simulated annealing. The obtained rulesets are fed to the GA which re-combines and modifies them in order to produce new rulesets. The best ruleset obtained by the GA is then passed to simulated annealing for further improvement.
3
Experimental Results
We tested our algorithms on five different data sets extracted from different domains. Two sets describe the stability of classes in an object-oriented software system, and differ in the distribution of the classification label. The other two were taken from the UCI Machine Learning repository1 and one was extracted from websites.
3.1
Data Set 1: Stability of classes in OOP software systems
This set describes stability of classes in an objectoriented system. A class is said to be stable across two different versions of a software system if it maintains the same public method signatures which makes its usage fixed through the different versions. Metrics about coupling, cohesion, inheritance and size of classes were extracted from the software systems shown in Table 2. The data set includes 1735 cases where 1388 were stable and 347 unstable. The data set was then divided into two sets. The first was used to create 50 rulesets with C4.5 while the other was used to train and test the heuristics. 1 www.ics.uci.edu/
28
˜mlearn/MLRepository.html
Table 4. Data Set 3: Organization Names Tagging
Table 2. Data Set 1: Software Systems Used To Build Classifiers With C4.5 Software System
Number of classes
Software System
Number of classes
Bean browser Free Jchempaint Jetty Jlex Voji
388-392 46-93 84 229-285 20-23 16-39
Ejbvoyager Javamapper Jedit Jigsaw Lmjs
71-78 18-19 464-468 846-958 106
3.2
Sample code number Uniformity of Cell Size Marginal Adhesion Bare Nuclei Normal Nucleoli
Data Set 2: Stability of Classes in OOP Systems
Table 3. Data Set 2: Software systems used to build classifiers with C4.5 Software System
Number of classes
Software System
Number of classes
CDK Jedit Winie Geotools
295 179 45 5007
JDK Jetty Jrate Weka
1264 329 83 2339
3.5
Clump Thickness Uniformity of Cell Shape Single Epithelial Cell Size Bland Chromatin Mitoses
Data Set 5: Wine Classification
This data set describes chemical analysis of wines derived from different cultivars in one region in Italy. The wines are described by 13 constituents (Table 6) and the problem consists of classifying a wine into one of three categories, each specific to a cultivar. Table 6. Data set 4: Wine classification Alcohol Ash Magnesium Flavanoids Proanthocyanins Hue OD280/OD315 of diluted wines
Malic acid Alcalinity of ash Total phenols Nonflavanoid phenols Color intensity Proline
Data Set 3: Organization Name Tagging 3.6
The data set describes words in websites and the problem is that of tagging organization names. The words are described by 12 attributes (Table 4) and the problem is that of classifying a word as either an organization name or not.
3.4
InBold InLink AdjToLocation AdjToOrgSuffixWeak InList
Table 5. Data Set 4: Breast Cancer Diagnosis
This data set also describes the stability of classes in an object oriented system but it is more balanced. About 35% of the classes are unstable. Table 3 shows the software systems used to make up this data set. The first six software systems were used to build rulesets using C4.5. These rulesets were then adapted by the heuristics to the data set comprising the last software system (namely Geotools).
3.3
InCaps InEmail InTitle NoDef InCell AdjToOrgSuffixStrong
Data Set 4: Breast Cancer
This data set describes patients susceptible of suffering from breast cancer [22, 24]. Breast cancer diagnosis has been a problem long studied in the machine learning community [23, 25]. The data set is initially formed of 699 cases. After removing those with missing attribute values, the size of the data set was reduced to 683 cases. Table 5 shows the attributes used in this data set. The classification label is either malignant or benign.
Results Discussion
In order to assess our heuristics, we used 10-fold cross validation. Under this technique, the data set is divided into 10 folds of roughly equal size. Nine folds are combined together to form the training set for the heuristic and the remaining fold is used to test the heuristic. This is repeated 10 times, leaving each time a different folder for testing. This technique helps overcome the disadvantage caused by data not being abundant. We experimented with several parameters for the heuristics (crossover and mutation rates for the GA, tabu list size for the TS, etc.). Tables 7 and 8 show that all five heuristics out-perform C4.5 with the hybrid heuristic showing the best results on all data sets except for the wine data where the GA slightly outperforms it. On the imbalanced stability dataset, we can see
29
Stability of Classes (Imbalanced Data Set) Accuracy(σ) Accuracy (σ) Training Testing 71.60% (0.02) 68.05% (0.01) 74.95% (0.75) 69.93% (004) 74.77% (0.001) 70.3% (0.03) 75.96% (0.002) 69.82% (0.004) 77.23%(0.002) 69.38% (0.008) 74.36%(0.001) 69.18% (0.005)
C4.5 SA TS GA Hybrid ACO
Stability of Classes (Balanced Data Set) Accuracy(σ) Accuracy (σ) Training Testing 78.59%(0.043) 78.59%(0.042)) 96.31% (0.002) 96.23%(0.002) 95.79%(0.003) 95.70 %(0.003) 96.53%(0.0002) 96.46%(0.0005) 96.59%(0.0002) 96.42% (0.001) 84.82% (0.003) 84.72% (0.0031)
Wine Data Accuracy(σ) Training 45.70% (0.011) 91.59% (0.012) 87.10% (0.024) 95.19% (0.016) 94.41%(0.007) 73.10% (0.010)
Accuracy (σ) Testing 45.86% (0.055) 91.32% (0.036) 85.57% (0.053) 93.10% (0.073) 92.63% (0.022) 72.50% (0.0124)
Breast Cancer Data Accuracy(σ) Training 95.98%(0.002) 98.74% (0.001) 98.61% (0.002) 98.67% (0.002) 99.19%(0.001) 82.85% (0.014)
Accuracy (σ) Testing 95.98% (0.015) 97.40% (0.002) 97.32% (0.024) 97.18% (0.019) 97.51%(0.015) 82.6% (0.014)
Table 7. Results on Stability of Classes, Wine Data, and Breast Cancer Data
C4.5 SA TS GA Hybrid ACO
Accuracy (σ) Training 86.03% (0.01) 90.36% (0.001) 91.30% (0.001) 91.69% (0.0008) 93.28% (0.001) 88.50% (0.006)
Accuracy (σ) Testing 86.03% (0.01) 90.09% (0.001) 91.01% (0.005) 91.57% (0.002) 92.66% (0.004) 88.41% (0.007)
Table 8. Results on word tagging data
100
Training Accuracy
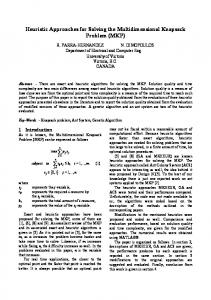
90 80 70 60 Stability (Balanced) Stability (Imbalanced) Wine Breast Cancer Word Tagging
50 40 C4.5
SA
TS
GA
Hybrid
ACO
Heuristic
Figure 5. Training Accuracy on All Data Sets
4
100
Testing Accuracy
80 70 60 Stability (Balanced) Stability (Imbalanced) Wine Breast Cancer Word Tagging
50
SA
TS
GA
Hybrid
Conclusion
This paper presented five different heuristics to optimize classifier systems. The approach uses rule-based classifiers built by C4.5 and optimizes and adapts them to new sets of data. The approach is validated using five different datasets from different domains. All heuristics outperformed C4.5, showing that the approach is independent of the classification problem and can generalize to different fields.
90
40 C4.5
that the hybrid heuristic outperforms C4.5 by about 6% on the training set but only slightly on the testing set (slightly more than 1%). We believe that this is due to the large amount of noise in the data set. On the balanced stability data set, all heuristics significantly out-beat C4.5 with 18% increase in accuracy on both the training and the testing sets for the hybrid heuristic. C4.5 performs very bad on the wine problem and reaches an accuracy of no more than 46% on the testing data whereas all heuristics reach an accuracy between 86 and 93%. The problem of learning breast cancer data appears to be an easy problem. All algorithms show a high accuracy with hybrid heuristic reaching an accuracy of 99% on the training data and more than 97% on the testing data thus out-beating C4.5 by 3% on the training data and almost 2% on the testing data. We believe that the small difference is due to the fact that the classifiers generated by C4.5 are already very good. On the word tagging dataset(Table 8), the heuristics out-beat C4.5 by around 3.5% (SA and TS) to 7% (hybrid). Finally, although ACO outperforms C4.5 in all cases (2-30%), we have noticed that it has achieved the lowest accuracy in all five data sets. This is normal and expected since ACO evolves one ruleset at a time whereas the other heuristics evolve all rulesets together. This allows the other heuristics to recombine conditions from different rulesets, and thus enlarge their search space.
ACO
Heuristic
References
Figure 6. Testing Accuracy on all Data Sets
[1] J. R. Quinlan, C4.5: Programs for Machine Learning. Morgan Kaufmann, 1993.
30
[2] A. C. Tan and D. Gilbert, “An Empirical Comparison of Supervised Machine Learning Techniques in Bioinformatics,” in Proc. APB Conf., 2003, pp. 219–22. [3] Z. Zhao, X. Jin, Y. Cao, and J. Wang, “Data Mining Application On Crash Simulation Data Of Occupant Restraint System,” in Expert Systems with Applications, vol. 37, no. 8, 2010, pp. 5788–5794.
[13] A. Porter and R. Selby., “Learning From Examples: Generation And Evaluation of Decision Trees for Software Resource Analysis,” Software Engineering, vol. 14, no. 12, pp. 1743–1757, 1988. [14] Y. Mao, H. A. Sahraoui, and H. Lounis, “Reusability Hypothesis Verification Using Machine Learning Techniques: A Case Study,” in Proc. IEEE ASE Conf., 1998.
[4] E. Cohen and C.Lund, “Packet Classification In Large ISPs: Design and Evaluation of Decision Tree Classifiers,” in Proc. Int. Conf. on Measurement and Modeling of Computer Systems, vol. 33, no. 1, 2005, pp. 73–84.
[15] V. Basili, K. Condon, K. E. Emam, R. B. Hendrick, and W. Melo, “Characterizing and Modeling the Cost of Rework in a Library of Reusable Software Components,” in Proc. 19th ICSE, 1997, pp. 282–291.
[5] M. Burl, L. Asker, P. Smyth, U. Fayyad, P. Perona, L. Crumpler, and J. Aubele, “Learning to recognize volcanoes on venus,” Machine Learning, vol. 30, no. 2-3, pp. 165–194, 1998.
[16] M. A. D. Almeida, H. Lounis, and W. Melo, “An Investigation on the Use Of Machine Learned Models for Estimating Software Correctability,” Int. Journal of Soft. Eng. and Knowledge Eng., vol. 9, no. 5, pp. 565–594, 1999.
[6] L. Sungjoo, L. Seunghoon, and P. Yongtae, “A Prediction Model For Success of Services in E-Commerce Using Decision Tree: E-Customer’s Attitude Towards Online Service,” Expert Systems With Applications, vol. 33, no. 3, pp. 572–581, 2007. [7] L. Devillers, L.Vidrascu, and L. Lamel, “Challenges in Real-Life Emotion Annotation and Machine Learning Based Detection,” Neural Networks, vol. 18, no. 4, pp. 407–422, 2005. [8] Z. Sun, Q. Su, and J. Wang, “Study of Student Model Based on Improved Genetic Algorithms,” in Proc. First Int. Workshop on Education Technology and Computer Science, vol. 1, 2009, pp. 912–915. [9] R. Das, “A Comparison of Multiple Classification Methods for Diagnosis of Parkinson Disease,” Journal of Expert Systems with Applications, vol. 34, no. 4, pp. 591–599, 2010. [10] C. Sakar and O. Kursun, “Telediagnosis of Parkinson’s Disease Using Measurements of Dysphonia,” Journal of Medical Systems, vol. 34, no. 4, pp. 591–599, 2003. [11] H. A. Guvenir, B. Acar, G. Demiroz, and A. Cekin, “A Supervised Machine Learning Algorithm for Arrhythmia Analysis,” in Proc. of Computers in Cardiology Conf., 1998, pp. 433–436. [12] W. Wolberg, W. Street, and O. Mangasarian, “Image Analysis and Machine Learning Applied to Breast Cancer Diagnosis and Prognosis,” Analytical and Quantitative Cytology and Histology, vol. 17, no. 2, pp. 77–87, 1995.
[17] L. C. Briand, W. M. Thomas, and C. J. Hetmanski, “Modeling And Managing Risk Early in Software Development,” in Proc. 15th ICSE, 1993, pp. 55–65. [18] D. Azar, H. Harmanani, and R. Korkmaz., “A Hybrid Hueristic to Optimize Rule-Based Software Quality Estimation Models,” Information and Software Technology, vol. 51, no. 9, pp. 1365–1376, 2009. [19] F. Glover, “Tabu-Search-Part I,” ORSA Journal on Computing, vol. 1, no. 3, pp. 190–206, 1989. [20] S. Kirkpatrick, C. Gelalt, and M. Vecchi, “Optimization by Simulated Annealing,” Science, vol. 220, no. 4598, pp. 671–680, May 1983. [21] M. Dorigo and G. Caro, “Ant Colony Optimization: A New Meta-Heuristic,” in Congress of Evolutionary Computation, vol. 2, 1999, pp. 1470–1477. [22] O. L. Mangasarian and W. H. Wolberg, “Cancer Diagnosis Via Linear Programming,” SIAM News, vol. 25, no. 5, 1990. [23] H. A. Abbass, “An Evolutionary Artificial Neural Networks Approach for Breast Cancer Diagnosis,” AI in Medicine, vol. 25, no. 3, pp. 265–281, 2002. [24] W. H. Wolberg and O. Mangasarian, “Multisurface Method of Pattern Separation for Medical Diagnosis Applied to Breast Cytology,” in Proc. of the National Academy of Sciences, vol. 87, 1990, pp. 9193–9196. [25] K. Grabczewski and W. Duch, “Heterogeneous forests of decision trees,” in Artificial Neural Networks — ICANN 2002. Springer, 2002, p. 140.
31