2005 IEEE Workshop on Applications of Signal Processing to Audio and Acoustics
October 16-19, 2005, New Paltz, NY
HIERARCHICAL MULTI-CLASS SELF SIMILARITIES Tristan Jehan Media Laboratory Massachusetts Institute of Technology 20 Ames Street, Cambridge, MA 02139
[email protected] ABSTRACT The music similarity question is yet to be defined. From an objective signal point of view, at least three classes of similarities may be considered: pitch, rhythm, and timbre. Within each class, several scales of analysis may be evaluated: segment, beat, pattern, section. We propose a recursive approach to this hierarchical and perceptual similarity problem. Our musically meaningful set of measurements is computed from the ground up via dynamic programming. This may be regarded as an analysis foundation for content-based retrieval, song similarities, or manipulation systems. 1. INTRODUCTION Measuring similarities in music audio is a particularly ambiguous task that has not been adequately addressed. The first reason why this problem is difficult is simply because there is a great variety of criteria (both objective and subjective) that listeners must consider and evaluate simultaneously, e.g., genre, instruments, tempo, melody, rhythm, timbre. Figure 1 depicts the problem in the visual domain, with at least two obvious classes to consider: outline, and texture.
Figure 1: Simple example of the similarity problem in the visual domain. The question is: how would you group these four images? Another major difficulty comes from the scale at which the similarity is estimated. Indeed, measuring the similarity of sound segments or entire records are different problems. Previous works have typically focused on one single task, for instance: instruments, rhythmic patterns, or songs. Our approach, on the other hand, is an attempt at considering multiple levels of musically meaningful similarities, in a uniform fashion. 2. RELATED WORK Recent original methods of mapping music into a subjective semantic space for measuring the similarity of songs and artists have been proposed [1]. These methods rely on statistical models and
labeled signals, which do not easily scale down in measuring similarities within songs. Here, we are only concerned with objective acoustic criteria (or dimensions) measurable directly from the signal with no prior knowledge, such as pitch, rhythm, and timbre. The analysis task is challenging for the following reasons: 1. non-orthogonality, or intricate interconnection of the musical dimensions. 2. hierarchical dependency of the various scales of analysis. We believe that a multi-scale and multi-class approach to acoustic similarities is a step forward toward a more generalized model. Hierarchical representations of pitch and rhythm have already been proposed by Lerdahl and Jackendoff in the form of a musical grammar based on Chomskian linguistics [2]. Although a questionable over simplification of music, among other rules their theory includes the metrical structure, as in our representation. Yet, in addition to pitch and rhythm, we introduce the notion of hierarchical timbre structure, a perceptually grounded description of music audio based on the metrical organization of its timbral surface (the perceived spectral shape in time). Global timbre analysis has received much attention in recent years as a means to measure the similarity of songs [1][3][4]. Typically, the estimation is built upon a pattern-recognition architecture. Given a large set of short audio frames, a small set of acoustic features, a statistical model of their distribution, and a distance function, the algorithm aims at capturing the overall timbre distance between songs. It was shown, however, by Aucouturier and Pachet that these generic approaches quickly lead to a “glass ceiling”, at about 65% R-precision [5]. They conclude that substantial improvements would most likely rely on a “deeper understanding of the cognitive processes underlying the perception of complex polyphonic timbres, and the assessment of their similarity.” It is indeed unclear how humans perceive the superposition of sounds, or what “global” means, and how much it is actually more significant than “local” similarities. Comparing most salient segments or patterns in songs may perhaps lead to more meaningful strategies. A similarity analysis of rhythmic patterns was proposed by Paulus and Klapuri [6]. Their method, only tested with drum sounds, consisted of aligning tempo-variant patterns via dynamic time warping (DTW), and comparing their normalized spectral centroid, weighted with the log-energy of the signal. We base our analysis on a series of significant segmentations, hierarchically organized, and naturally derived from perceptual models of listening. It was shown by Grey [7] that three important characteristics of timbre are: attack quality (temporal envelope), spectral flux (evolution of the spectral distribution over time), and brightness (spectral centroid). A fine-grain analysis of the signal is therefore required to capture such level of temporal resolution.
2005 IEEE Workshop on Applications of Signal Processing to Audio and Acoustics
3. AUDITORY SPECTROGRAM The goal of the auditory spectrogram is to convert the time-domain waveform into a reduced, yet perceptually meaningful, time-frequency representation. We seek to remove the information that is the least critical to our hearing sensation while retaining the most important parts, therefore reducing signal complexity without perceptual loss. An MP3 codec is a good example of an application that exploits this principle for compression purposes. Our primary interests however, are segmentation and preserving timbre, therefore the reduction process is being simplified. Our auditory model takes into account the non-linear frequency response of the outer and middle ear, the amplitude compression into decibels, the frequency warping into a Bark scale, as well as frequency and temporal masking [8]. The outcome of this filtering stage approximates a “what-you-see-is-what-you-hear” spectrogram, meaning that the “just visible” in the time-frequency display corresponds to the “just audible” in the underlying sound. Since timbre is best described by the evolution of the spectral envelope over time, reducing the frequency space to only 25 critical bands [9] is a fair approximation (Figure 2, pane 1). A loudness function can be derived directly from this representation by summing energies across frequency bands. Traditional approaches of global timbre analysis as mentioned earlier typically stop here. Then statistical models such as k-mean or GMM are applied. Instead we go a step higher in the hierarchy and compare the similarity of sound segments. 4. SOUND SEGMENTATION Sound segmentation consists of dividing the auditory spectrogram into its smallest relevant fragments, or segments. A segment is considered meaningful if it does not contain any noticeable abrupt changes, whether monophonic, polyphonic or multitimbral. It is defined by its onset and offset boundaries. Typical onsets include loudness, pitch or timbre variations, which translate naturally into spectral variations in the auditory spectrogram. We convert the auditory spectrogram into an event detection function by calculating the first-order difference function of each spectral band, and by summing across channels. Transients are localized by peaks, which we smooth by convolving the function with a 150-ms Hanning window to combine the ones that are perceptually fused together, i.e., less than 50 ms apart. Desired onsets can be found by extracting the local maxima in the resulting function and by searching the closest local minima in the loudness curve, i.e., the quietest and ideal time to cut (Figure 2, pane 2). This atomic level of segmentation describes the smallest rhythmic elements of the music, e.g., individual notes, chords, drum sounds, etc. It therefore makes sense to extract the pitch (or harmonic) content of a sound segment. But since polyphonic pitch tracking is not solved, especially in a mixture of sounds that includes drums, we opt for a simpler, yet relevant, 12-dimensional chroma description as in [10]. We compute the FFT of the whole segment (generally around 80 to 300 ms long), which gives us sufficient frequency resolution. A chroma vector is the result of folding the energy distribution of much of the entire power spectrum (6 octaves ranging from C1=65Hz to B7=7902Hz) into 12 pitch classes. The output of logarithmically spaced Hanning filters, accordingly tuned to the equal temperament chromatic scale, is accumulated and normalized appropriately. An example of segmentsynchronous chromagram is displayed in Figure 2, pane 3.
October 16-19, 2005, New Paltz, NY
25
20 15 10
5 1 0
0.5
1
1.5
2 sec.
0.5
1
1.5
2 sec.
0.5
1
1.5
2 sec.
1
0.8
0.6
0.4
0.2
0
0
B A# A G# G F# F E D# D C#
C
0
Figure 2: Short excerpt of James Brown’s “Sex machine.” Top: 25-band auditory spectrogram. Middle: raw detection function (black), smoothed detection function (dashed blue), onset markers (red). Bottom: segmentsynchronous chroma vectors.
5. DYNAMIC PROGRAMMING Dynamic programming is a method for solving dynamic (i.e., with time structure) optimization problems using recursion. It is typically used for alignment and similarity of biological sequences, such as protein or DNA sequences. First, a distance function determines the similarity of items between sequences (e.g., 0 or 1 if items match or not). Then an edition cost penalizes alignment changes in the sequence (e.g., deletion, insertion, substitution). Finally, the total accumulated cost is a measure of dissimilarity. We seek to measure the timbre similarity of the segments found in section 4. Like in [11] we first build a self-similarity matrix of the timbral surface (of frames) using our auditory spectrogram (Figure 5, top-left). Best results were found using the simple euclidean distance function. This distance matrix can be used to infer the similarities of segments via dynamic programming. It was shown in [7] that for timbre perception, attacks are more important than decays. We dynamically weigh the insertion cost—our time warping mechanism—with a half-raised cosine function as displayed in Figure 3 (right), therefore increasing the cost of inserting new frames at the attack more than at the decay. Two parameters are still chosen by hand (insertion cost, and the weight function value h), which could be optimized automatically. We compute the segment-synchronous self-similarity matrix of timbre as displayed in Figure 5 (top-right). Note that the structure information visible in the frame-based self-similarity matrix remains although we are now looking at a much lower, yet musically valid rate (a ratio of almost 40 to 1). A simple example of decorrelating timbre from pitch content in segments is shown in Figure 4 as well. 6. BEAT ANALYSIS The scale of sound segmentation relates to musical tatum (the smallest time metric) as described in [12], but beat, a perceptually induced periodic pulse, is probably the most well known metrical unit. It defines tempo, a pace reference that is useful for normal-
0.9 0.8 0.7 0.6 0.5 0.4 0.3 0.2
h
0.1 0
0
0.1
0.2
0.3
0.4
0.5
0.6
0.7
0.8
0.9
attack
1
release
Figure 3: Left: chord progression played three times (once per instru-
Brass
Dm7 G7 CM7 C#o Dm7 G7 CM7 C#o Dm7 G7 CM7 C#o Dm7 G7 CM7 C#o Dm7 G7 CM7 C#o Dm7 G7 CM7 C#o
ment) for generating the matrices of Figure 4. Note that chords with similar names are played differently. Right: weight function used for the timbre similarity of segments. A parameter h must be selected. Piano
Guitar
0.9 5
5
10
10
15
15
October 16-19, 2005, New Paltz, NY
1
Dm7 G7 CM7 C#o
Dm7 G7 CM7 C#o
2005 IEEE Workshop on Applications of Signal Processing to Audio and Acoustics
0.8
izing music in time. A beat tracker based on our front-end auditory spectrogram and a bank of resonators inspired by [13] is developed. It assumes no prior knowledge and allows us to reveal the underlying musical metric on which sounds arrange. It is generally found between 2 to 5 sounds per beat. Using the soundsynchronous timbre self-similarity matrix as new distance function, we can repeat the dynamic programming procedure again and infer a beat-synchronous self-similarity matrix of beats. Here, we may weigh on-beat segments more than off -beat segments. Another option consists of computing the similarity of beats directly from the frame-based representation. It makes sense to consider pitch similarity at the beat level as well. We can compute the beatsynchronous self-similarity matrix of pitch in the same way. Note in Figure 5 (bottom-left) that the smaller matrix (i.e., bigger cells) displays perfectly aligned diagonals, which reveal the presence of musical patterns.
0.7 0.6 0.5
0.3 20
0.2
20
0.1 5
10
15
20
5
10
15
20
Figure 4: Test example of decorrelating timbre from pitch content. A typical II-V-I chord progression (as in Figure 3, left) is played successively with piano, brass, and guitar sounds on a MIDI instrument. Left: segmentsynchronous self-similarity matrix of timbre. Right: segment-synchronous self-similarity matrix of pitch. Frames
Segments 20
1000 40 2000
60 80
3000
100 4000
120 140
5000
160 6000
180 200
7000
220 8000
1000
2000
3000
4000
Beats
5000
6000
7000
8000
20
40
60
80
100
120
140
Patterns
160
180
200
220
2 10
4 20
6
30
7. PATTERN RECOGNITION
0.4
8
Beats can often be grouped into patterns, also referred to as meter and indicated by a symbol called time signature in western notation (e.g., 3/4. 4/4, 12/8). A typical method for finding the length of a pattern consists of applying the autocorrelation function of the signal energy (here the loudness curve). This is however a rough approximation based on dynamic variations of amplitude, which does not consider pitch or timbre. Our system computes pattern similarities using the dynamic programming technique recursively and the beat-synchronous self-similarity matrices. Since we first need to determine the length of the pattern, we run parallel tests on a beat basis, measuring the similarity between successive patterns of 2 to 16 beats long, much like our bank of oscillators in the beat tracker. We pick the highest estimation, which gives us the corresponding length. Note that patterns in the pitch dimension, if they exist, can be of different length than those found in the timbre dimension. Another drawback of the autocorrelation method is that it does not return the phase information, i.e., where the pattern begins. This problem of downbeat prediction is addressed in [14] and takes advantage of our representation, together with a training scheme. Finally, we infer the pattern-synchronous self-similarity matrix, again via dynamic programming. Here is a good place to insert more heuristics, such as the weight of strong beats versus weak beats. Our current model does not assume any weighting though. We finally implement pitch similarities based on beat-synchronous chroma vectors, and rhythm similarities using the elaboration distance function proposed in [15], together with our loudness function. Results for an entire song can be found in Figure 6.
10
40
12
8. LARGER SECTIONS
50
14 60
16 10
20
30
40
50
60
2
4
6
8
10
12
14
16
Figure 5: First 47 seconds of Sade’s “Feel no pain” represented hierarchically in the timbre space as self-similarity matrices: top-left: frames; top-right: segments; bottom-left: beats; bottom-right: patterns. Note that each representation is a scaled transformation of the other, yet synchronized to a meaningful musical metric. Only beat and pattern representations are tempo invariant. This excerpt includes 8 bars of instrumental introduction, followed by 8 bars of instrumental plus singing. The 2 sections appear clearly in the pattern representation.
Several recent works have dealt with the question of thumbnailing [16], music summarization [17][11], or chorus detection [18]. These related topics all deal with the problem of extracting large sections in music. As can be seen in Figure 5 (bottom-right), larger musical structures appear in the matrix of pattern self-similarities. An advantage of our system in extracting large structures is its invariance to tempo since the beat tracker acts as a normalizing parameter. A second advantage is that segmentation is actually inherent to the representation: finding section boundaries is less of a concern as we do not require such precision—the pattern level is a
2005 IEEE Workshop on Applications of Signal Processing to Audio and Acoustics
10
10
0.9
20
20
0.8
30
30
0.7
40
40
0.6
50
50
0.5
60
60
0.4
70
70
0.3
80
80
0.2
90
90
100
10
20
30
40
50
60
70
80
90
100 100
0.1
10
20
30
40
50
60
70
80
90
100
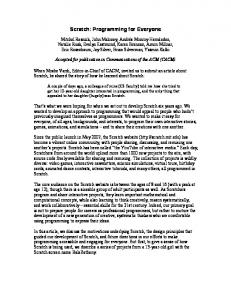
Figure 6: Pitch (left) and rhythm (right) self-similarity matrices of patterns for the entire Sade song “Feel no pain.” The red squares outline the first 16 measures studied in Figure 5. Note that a break section (blue dashed squares) stands out in the rhythm representation, where it’s only the beginning of the last section in the pitch representation.
fair assumption of section boundary in popular music. Finally, previous techniques used for extracting large structures in music like the Gaussian-tapered “checkerboard” kernel in [11] or the pattern matching technique in [16] also apply here, but at a much lower resolution, increasing greatly the computation speed, while preserving the temporal accuracy. In future work, we may consider combining the different class representations (i.e., pitch, rhythm, timbre) into a single “tunable” procedure. 9. CONCLUSION We propose a recursive multi-class (pitch, rhythm, timbre) approach to the analysis of acoustic similarities in popular music. Our representation is hierarchically organized where each level is musically meaningful. Although fairly intensive computationally, our dynamic programming method is time-aware, causal, and flexible: future work may include inserting and optimizing heuristics at various stages of the algorithm. Our representation may be useful for fast content retrieval (e.g., through vertical, rather than horizontal search); improved song similarity architectures that include specific content considerations; and music synthesis, including song summarization, music morphing, and automatic DJ-ing. 10. ACKNOWLEDGMENTS Some of this work was done at Sony CSL, Paris. I would like to thank Francois Pachet for his invitation and for inspiring discussions. Thanks to Jean-Julien Aucouturier for providing the original dynamic programming code. The cute outline panda drawings are from C´esar Coelho. Thanks to Hedlena Bezerra for their computer-generated 3D rendering. Thanks to Brian Whitman and Shelly Levy-Tzedek for useful comments regarding this paper. 11. REFERENCES [1] A. Berenzweig, D. Ellis, B. Logan, and B. Whitman, “A large scale evaluation of acoustic and subjective music similarity measures,” in Proceedings of the 2003 International Symposium on Music Information Retrieval, Baltimore, MD, October 2003. [2] F. Lerdahl and R. Jackendoff, A Generative Theory of Tonal Music. Cambridge, Mass.: MIT Press, 1983.
October 16-19, 2005, New Paltz, NY
[3] J.-J. Autouturier and F. Pachet, “Finding songs that sound the same,” in Proceedings of IEEE Workshop on Model based Processing and Coding of Audio. University of Leuven, Belgium, November 2002, invited Talk. [4] J. Herre, E. Allamanche, and C. Ertel, “How similar do songs sound? towards modeling human perception of musical similarities,” in Proceedings of IEEE Wokshop on Applications of Signal Processing to Audio and Acoustics (WASPAA), Mohonk, NY, October 2003. [5] J.-J. Autouturier and F. Pachet, “Improving timbre similarity: How high is the sky?” Journal of Negative Results in Speech and Audio Sciences, vol. 1, no. 1, 2004. [6] J. Paulus and A. Klapuri, “Measuring the similarity of rythmic patterns,” in Proceedings of the International Symposium on Music Information Retrieval (ISMIR). Paris: IRCAM, 2002, pp. 175–176. [7] J. Grey, “Timbre discrimination in musical patterns,” Journal of the Acoustical Society of America, vol. 64, pp. 467–472, 1978. [8] T. Jehan, “Event-synchronous music analysis/synthesis,” Proceedings of the 7th International Conference on Digital Audio Effects (DAFx-04), October 2004. [9] E. Zwicker and H. Fastl, Psychoacoustics: Facts and Models, 2nd ed. Berlin: Springer Verlag, 1999. [10] M. A. Bartsch and G. H. Wakefield, “To catch a chorus: Using chroma-based representations for audio thumbnailing,” in Proceedings of IEEE Wokshop on Applications of Signal Processing to Audio and Acoustics (WASPAA), Mohonk, NY, October 2001, pp. 15–18. [11] M. Cooper and J. Foote, “Summarizing popular music via structural similarity analysis,” in IEEE Workshop on Applications of Signal Processing to Audio and Acoustics (WASPAA), Mohonk, NY, October 2003. [12] J. Sepp¨anen, “Tatum grid analysis of musical signals,” in IEEE Workshop on Applications of Signal Processing to Audio and Acoustics, Mohonk, NY, October 2001. [13] E. Scheirer, “Tempo and beat analysis of acoustic musical signals,” Journal of the Acoustic Society of America, vol. 103, no. 1, January 1998. [14] T. Jehan, “Downbeat prediction by listening and learning,” in Proceedings of IEEE Wokshop on Applications of Signal Processing to Audio and Acoustics (WASPAA), Mohonk, NY, October 2005, (submitted). [15] M. Parry and I. Essa, “Rhythmic similarity through elaboration,” in Proceedings of the International Symposium on Music Information Retrieval (ISMIR), Baltimore, MD, October 2003. [16] W. Chai and B. Vercoe, “Music thumbnailing via structural analysis,” in Proceedings of ACM Multimedia Conference, November 2003. [17] G. Peeters, A. L. Burthe, and X. Rodet, “Toward automatic music audio summary generation from signal analysis,” in Proceedings of the International Symposium on Music Information Retrieval (ISMIR). Paris: IRCAM, 2002. [18] M. Goto, “Smartmusickiosk: music listening station with chorus-search function,” in Proceedings of the 16th annual ACM symposium on User interface software and technology, November 2003, pp. 31–40.