advance as a calibration step for the spectrometer), we solve for via Supplementary ..... Silicon-on-insulator spectrometers with integrated GaInAsSb.
High-performance and scalable on-chip digital Fourier transform spectroscopy Kita et al.
Supplementary Information Supplementary Note 1: Elastic-D1 Spectral Reconstruction Method Given the measured interferogram 𝐲 (of size 𝑁 × 1) and a calibration matrix 𝐀 of size 𝑁 × 𝐷, we seek to accurately reconstruct the input optical signal 𝒙 that obeys: 𝐲 = 𝐀𝐱
(1)
where 𝐷 ≫ 𝑁, and in our case 𝐷 = 801, 𝑁 = 64. For our 64-channel device, there are two types of signals available to us for testing the quality of optical reconstruction: (1) laser lines that are characterized by sparse spectra, and (2) broadband sources (like spontaneous emission from an EDFA) with a broad spectrum (non-sparse). Since the problem we are solving is underconstrained, there are infinite solutions 𝐱 that solve Supplementary Equation 1. However, we can place constraints on the sparsity and magnitude of the spectrum and prevent over-fitting issues by minimizing the 𝐿1 and 𝐿2 norms of 𝐱1: 2
2
min { ||𝐲 − 𝐀𝐱|| + 𝛼1 ||𝐱||1 + 𝛼2 ||𝐱||2 }
(2)
𝐱
where 𝛼1 and 𝛼2 are the corresponding hyperparameters. For an arbitrary optical input, we find that the “smoothness” of the spectrum is an important characteristic of the spectra and a good regularizer. To induce the appropriate amount of smoothness, characterized by the first-derivative 2 of the spectrum, we used the finite difference matrix 𝐃 to define the following regularizer ||𝐃𝐱||2. We cast our reconstruction problem with 𝐿1 norm, 𝐿2 norm, and the first-derivative smoothness prior as follows: 2
2
2
min { ||𝐲 − 𝐀𝐱|| + 𝛼1 ||𝐱||1 + 𝛼2 ||𝐱||2 + 𝛼3 ||𝐃𝐱||2 }
𝐱,𝐱>0
(3)
2
Using ||𝐌𝐱||2 = 𝐱 𝑻 𝐌𝑻 𝐌𝐱, and the fact that our spectrum is non-negative (and thus ||𝐱||1 = 𝟏𝑇 𝐱), we may rewrite Supplementary Equation 3 as a non-negative quadratic program: min { 𝐱 𝑇 (𝐀𝑇 𝐀 + 𝛼2 𝐈 + 𝛼3 𝐃𝑇 𝐃)𝑥 + (𝛼2 𝟏 − 2𝐀𝑇 𝐲)𝑇 𝐱 }
𝐱,𝐱>0
(4)
The above form is easily computed with standard quadratic program solvers2. With this method of solving for the signal 𝒙, the last step is to determine the suitable hyperparameters 𝛼1 , 𝛼2 , and 𝛼3 that correspond to the correct input. However, since we don’t have access to the true spectrum, we use a standard holdout cross-validation technique, which requires only two successive measurements of the interferogram, characterized by the same input signal with different noise. The cross-validation technique is as follows: with two independent measurements 𝐲𝟏 and 𝐲𝟐 of the same source, and given two measurements of the basis 𝐀 𝟏 and 𝐀 𝟐 (performed only once in advance as a calibration step for the spectrometer), we solve for 𝐱 𝟏 via Supplementary Equation 4 for a suitably large range of hyperparameter values, and arguments 𝐲𝟏 and 𝐀 𝟏 . We then choose the spectrum 𝐱 𝟏 corresponding to the unique set of 𝛼’s that maximize the coefficient of determination 𝑅 2 (see Supplementary Equation 5 below) between the second measurement 𝐲𝟐 and the value 𝐀𝟐𝐱𝟏 : max { 𝑅 2 (𝐲𝟐 , 𝐀 𝟐 𝐱 𝟏 ) } = max { 1 − 𝛼1,2,3
α1,2,3
∑𝑛−1 𝑖=0 (𝑦2,𝑖 −(𝐀 𝟐 𝐱𝟏 )𝑖 ) 2
∑𝑛−1 𝑖=0 (𝑦2,𝑖 −〈𝐲𝟐 〉)
2
}
(5)
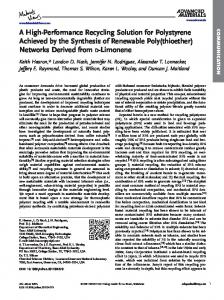
Supplementary Figure 1. Comparison of reconstruction techniques. Images of reconstructed spectra for two different optical inputs: two CW laser lines with 15 nm wavelength detuning (a,c,e) (as depicted in Figure 3 bottom) and a broadband signal generated by EDFA amplified spontaneous emission (b,d,f) (Figure 4c). The reconstruction techniques shown are: pseudoinverse (a,b), ridge regression (c,d), and LASSO (e,f). The R2 scores and associated hyperparameters (which were selected through cross-validation) are shown as insets.
where in the above the subscript 𝑖 specifies the specific interferogram measurement (out of 𝑛 = 64 total measurements) and angled brackets denote the average value (〈𝐲𝟐 〉 = (1/𝑛) ∑𝑛−1 𝑖=0 𝑦𝑖 ). The coefficient of determination value of 1 corresponds to a perfect match between inputs, and a value less than 0 means the measurement (𝐲𝟐 ) is more accurately fit by a straight line than it is fit by the model (𝐀 𝟐 𝐱 𝟏 ). Maximizing the coefficient of determination above guarantees that our computed spectrum 𝐱 𝟏 corresponds to a back-computed interferogram that closely matches a second experimental measurement of the interferogram. This technique allows for the unique determination of a set of hyperparameters that minimize the impact of experimental noise on the spectral reconstruction process. In addition, the hyperparameter search method is trivially parallelizable to systems with multiple processors. The reader should note that any regularizer can be used with elastic-D1 if one can encode this new regularizer with a matrix 𝐑 and substitute 𝐃𝟏 with 𝐑 . Thus, our method suggests that any
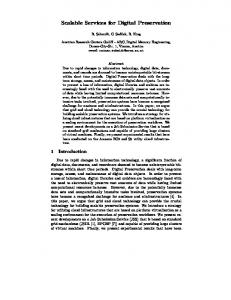
Supplementary Figure 2. Comparison of reconstruction techniques. Images of reconstructed spectra for two different optical inputs: two CW laser lines with 15 nm wavelength detuning (a,c,e) (as depicted in Figure 3 bottom) and a broadband signal generated by EDFA amplified spontaneous emission (b,d,f) (Figure 4c). The reconstruction techniques shown are: BPDN (a,b), RBF Network (c,d), and elastic net (e,f). The R2 scores and associated hyperparameters (which were selected through cross-validation) are shown as insets.
regularizer 𝐑 can be used to encode any combination of new priors that can be expressed as a matrix. In addition we want to point out the trivial extension to include additional regularizer terms 𝐱 𝑇 𝐑𝑇i 𝐑 i 𝐱 to elastic-D1. This can be easily done by defining the optimization problem 2
2
||𝐀𝐱 − 𝐲||2 + 𝛼1 ||𝐱||1 + 𝛼2 ||𝐱||2 + 𝛽1 𝐱 𝑇 𝐑𝑇i 𝐑 𝟏 𝐱 + ⋯ + 𝛽𝑘 𝐱 𝑇 𝐑𝑇𝑘 𝐑 𝒌 𝐱
(6)
with 𝛽𝑖 denoting the 𝑖-th hyperparameter for each of the 𝑘 regularizers encoded by the matrix 𝐑 𝒊 . This can be used to include additional regularizers, and can be solved using hold-out cross validation and with the convex libraries used before. As long as 𝑘 = 𝑂(1), the algorithm will remain polynomial time. In practice, we predict 𝑘 should be at most 2 or 3. If one adds many more regularizers the algorithm runtime becomes exponential in 𝑘. To avoid this one would have to use techniques different from hold-out cross validation.
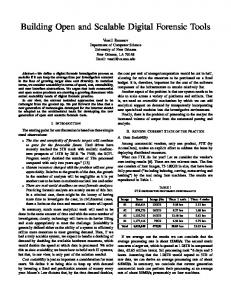
Supplementary Note 2: Insertion loss measurements of the dFT spectrometers In order to estimate the total loss of the 64-channel dFT spectrometer, as well as the switching loss per stage, we measured the optical power before and after a set of reference waveguides, as well as dFT structures with 1, 2, and 3 stages (corresponding to 4-channel, 16-channel, and 64-channel dFT spectrometers), as illustrated in Supplementary Figure 3. We determined the polarization-dependent insertion loss of the photonic components as a function of wavelength by scanning a single frequency tunable laser. We first performed a reference measurement of the grating coupler and fiber losses using a loopback waveguide on the chip (two grating couplers connected only by a straight waveguide). The fiber-to-fiber loopback loss was measured at 6.7 ± 0.7 dB across the 1550 – 1570 nm wavelength range. Next, we measured the insertion loss across the 64 channel dFT spectrometer by sending light into port “64ch_in” and measuring the outputs at both top and bottom tap-ports (labelled “64ch_top” and “64ch_bot” in Supplementary Figure 3c. When the spectrometer is powered on, the top and bottom tap-ports have a relatively flat spectral response (in contrast to the “64ch_out” port, which exhibits the distinct interference fringes). Since the light in the final 2 × 2 MMI is split 50:50 amongst the tap port and the final 2 × 1 combiner, the total optical power that would exit the 2 × 1 combiner is equivalent to the sum of the two tap-ports (neglecting the loss of the 2 × 1 MMI). Summing the two tap-ports and normalizing by the reference waveguide losses, the measured insertion loss across the spectrum was 9.1 ± 1.7 dB. The same chip contained 1- and 2-stage dFT
Supplementary Figure 3. Schematic of dFT spectrometers. Block diagram of the fabricated 1-stage (a), 2-stage (b), and 3-stage (c) dFT spectrometers fabricated all on a single chip. Orange denotes optical paths and passive optical components, while blue denotes active photonic components (heaters and photodetectors), and green denotes electrical wiring (metal traces).
spectrometers (Supplementary Figure 2a and 2b), and the same procedure as above was used to determine their insertion losses. The corresponding loss of the 2-stage dFT spectrometer was 6.8 ± 1.2 dB and the 1-stage dFT spectrometer was 5.5 ± 0.8 dB. The loss per stage was determined via linear regression to be 1.7 dB/stage, with a standard deviation error on this parameter of 0.4 dB (extracted from the covariance). We note that the final 2 × 2 MMI’s on the top and bottom arms incur a 3 dB loss penalty on the total insertion loss of the spectrometer. In future designs, it is possible to place an additional optical switch on both top and bottom arms to guide 100% of the light to the beam-combiner (this switchstate would depend on whether the input of the 2 × 2 MMI comes from the top or bottom port) to solve this issue. Supplementary Note 3: Modulation efficiency estimates for thermo-optic and electro-optic phase shifters For thermo-optic modulators, we assume a constant temperature rise of 60°C in the Si waveguide (with 𝑑𝑛/𝑑𝑇 = 1.8 × 10⁻⁴ K-1) induced by local heating elements and an operating wavelength of 1550 nm. From these figures, a modulation efficiency (induced phase per unit waveguide length) is 433 rad/cm. For electro-optic modulators3, we assume a typical 𝑉𝜋 𝐿𝜋 = 1 V⋅cm and applied voltage of 100 V. From this, the resulting modulation efficiency is 314 rad/cm. To estimate the modulation efficiency of direct waveguide path modulation, we have a group index of ng = 4.25 for the SOI waveguide geometry we employed, which yields a modulation efficiency of 172,281, a factor of 398 and 548 times greater than that of the thermo-optic and electro-optic shifters, respectively. Supplementary Note 4: Temperature dependence of the dFT spectrometer By detuning the thermoelectric heating/cooling element below the dFT chip, we performed a set of measurements and spectral reconstructions of a single-frequency laser at 1560.0nm. Using matrices 𝐴1 and 𝐴2 both measured at T = 25.00 °C and the temperature detuned interferogram measurements 𝑦1 and 𝑦2 (temperatures ranging from 25.00 °C to 23.87 °C), we used the elasticD1 method to reconstruct the spectrum. For sparse (narrowband) inputs, the temperature detuning produced only a shift in the center wavelength of the single frequency laser, and otherwise did not produce significant spectral noise. Using this data, we characterized the first-order temperature sensitivity to be -85.2 ± 1.3 pm/°C, as shown in Supplementary Figure 4.
Supplementary Figure 4. Temperature dependence of narrowband dFT reconstructions. (a) measured detuning of the center wavelength for different temperatures as measured by a thermistor near the photonic chip. Images at bottom show the reconstructed laser line for a number of different temperatures across the full 20 nm band (b) and a zoomed in image is provided to show the change in center wavelength (c).
Supplementary Note 5: Insertion loss estimates from Supplementary Table 1 5-stage dFT: The insertion loss value was estimated from the measured loss per switching stage (1.7 ± 0.4 dB per stage) and the insertion loss of the 64-channel device (9.1 ± 1.7 dB). 32-channel MZI array4 (Velasco, et al.): Insertion loss was estimated from the reported 4 dB/cm propagation loss, average waveguide length of 0.565 cm, and equal power splitting amongst 32 channels. This is a lower bound, as additional losses from power-splitting elements (1 × 2 MMI’s) and waveguides leading up to the spirals are not included.
Spectrometer type 3-stage dFT (this work) 5-stage dFT (projected) 32-channel MZI array with fixed OPL4 32-channel MZI array with fixed OPL5 MZI array with fixed OPL6 Thermo-optic FTIR7 Arrayed waveguide grating8 Arrayed waveguide grating9 Arrayed waveguide grating10 Arrayed waveguide grating12 Planar concave grating9 Random spectrometer11
Spectral channel count
Spectral resolution
Bandwidth
Insertion loss per channel*
Power consumptio n
On-chip detector integration
64
24.6 GHz
2.47 THz
9.1 ± 1.7 dB
99 mW
Y
1024
1.5 GHz
2.47 THz
12.4 ± 2.6 dB
165 mW
Y
32
5.0 GHz
0.094 THz
>17.3 dB
N/A
N
32
2.3 GHz
0.035 THz
> 22.6 dB
N/A
N
42
57.9 GHz
0.54 THz
> 32.9 dB
N/A
N
18†
380 GHz
7 THz
6.7 dB
2.5 W
N
50
25 GHz
1.26 THz
34 dB
N/A
N
6
99.1 GHz
0.801 THz
11.8 dB
N/A
Y
6
202 GHz
1.2 THz
9.8 dB
N/A
Y
8
400 GHz
3.2 THz
10.8 dB
N/A
N
16
397.5 GHz
9.3 THz
18.0 dB
N/A
Y
25
100 GHz
3.28 THz
> 14 dB
N/A
N
Supplementary Table 1. Comparison of on-chip spectrometers. Side-by-side comparison of the demonstrated 64-channel dFT spectrometer along with previously reported MZI array FTIR, thermooptic FTIR, arrayed waveguide grating, and random spectrometers. *Values in the “Insertion loss per channel” column account for the power loss per channel in dispersive spectrometers 8,9,11 when measuring broadband inputs and the loss from power-splitting in MZI array Fourier transform spectrometers4–6,13. †For Fourier transform spectrometers with continuously tunable arms, we define the effective spectral channel count as the bandwidth divided by the minimum spectral resolution. Plusminus symbols denote one standard deviation errors across the entire 1550-1570 nm band.
32-channel MZI array5 (Herrero-Bermello, et al.): Insertion loss was estimated from the reported 4 dB/cm propagation loss, average waveguide length of 1.89 cm, and equal power splitting amongst 32 channels. This is a lower bound, as additional losses from power-splitting elements (1 × 2 MMI’s) and waveguides leading up to the spirals are not included. 42-channel MZI array6 (Nedeljkovic, et al.): Insertion loss was estimated from the reported 8.8 dB/cm propagation loss, approximate waveguide length of 1.9 cm (estimated from reported 0.95 cm2 device footprint), and equal power splitting amongst 42 channels. This is a lower bound, as additional losses from power-splitting elements (1 × 2 MMI’s) and bending losses are not included.
Thermo-optic FTIR7 (Souza, et al.): Insertion loss estimated from the reported 2 dB/cm propagation loss, 30.407 mm arm length of the thermally tuned interferometer, and 0.3 dB loss per y-junction (2 total). 50-channel AWG8 (Cheben, et al.): Insertion loss calculated from the reported 17 dB insertion loss and the power splitting amongst 50 channels. 6-channel AWG9 (Ryckeboer, et al.): Insertion loss calculated from the reported 4 dB insertion loss and the power splitting amongst 6 channels. 6-channel AWG10 (Muneeb, et al.): Insertion loss calculated from the reported average 2.0 dB insertion loss and power splitting amongst 6 channels. 8-channel AWG (Bogaerts, et al.): Insertion loss calculated from averaging the minimum (center channel) insertion loss (1.1 dB) and maximum (outer channel) insertion loss (2.4 dB) and power splitting amongst 8 channels. 16-channel planar concave grating9 (Ryckeboer, et al.): Insertion loss calculated from the average reported 6 dB insertion loss and the power splitting amongst 16 channels. Random spectrometer11 (Redding, et al.): Since no values for the insertion loss were reported, we simply display the loss due to power splitting (14 dB) and note that the true insertion loss is larger than this value. Supplementary References 1. Shalev-Shwartz, S. & Ben-David, S. Understanding Machine Learning: From Theory to Algorithms. (Cambridge University Press, 2014). 2. Andersen, M., Dahl, J. & Vandenberghe, L. CVXOPT: Python Software for Convex Optimization. (2016). 3. Ding, R. et al. Demonstration of a low VπL modulator with GHz bandwidth based on electro-optic polymer-clad silicon slot waveguides. Opt. Express 18, 15618–15623 (2010). 4. Velasco, A. V et al. High-resolution Fourier-transform spectrometer chip with microphotonic silicon spiral waveguides. Opt. Lett. 38, 706–708 (2013). 5. Herrero-Bermello, A. et al. Temperature dependence mitigation in stationary Fouriertransform on-chip spectrometers. Opt. Lett. 42, 2239–2242 (2017). 6. Nedeljkovic, M. et al. Mid-infrared silicon-on-insulator Fourier-transform spectrometer chip. IEEE Photonics Technol. Lett. 28, 528–531 (2016). 7. Souza, M. C. M. M., Grieco, A., Frateschi, N. C. & Fainman, Y. Fourier transform spectrometer on silicon with thermo-optic non-linearity and dispersion correction. Nat. Commun. 9, 1–8 (2018). 8. Cheben, P. et al. A high-resolution silicon-on-insulator arrayed waveguide grating microspectrometer with sub-micrometer aperture waveguides. Opt. Express 15, 2299– 2306 (2007). 9. Ryckeboer, E. et al. Silicon-on-insulator spectrometers with integrated GaInAsSb photodiodes for wide-band spectroscopy from 1510 to 2300 nm. Opt. Express 21, 6101– 6108 (2013). 10. Muneeb, M. et al. III-V-on-silicon integrated micro - spectrometer for the 3 μm wavelength range. Opt. Express 24, 9465–9472 (2016). 11. Redding, B., Liew, S. F., Sarma, R. & Cao, H. Compact spectrometer based on a
12. 13.
disordered photonic chip. Nat. Photonics 7, 746–751 (2013). Bogaerts, W. et al. Silicon-on-insulator spectral filters fabricated with CMOS technology. IEEE J. Sel. Top. Quantum Electron. 16, 33–44 (2010). Podmore, H. et al. Demonstration of a compressive-sensing Fourier-transform on-chip spectrometer. Opt. Lett. 42, 1440–1443 (2017).