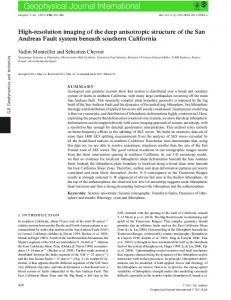
way, the returned signal is a measure of the geometric scat- tering from a target whose acoustic cross section varies pe- riodically. In Fig. 1(a) the high amplitude ...
High-resolution bubble sizing through detection of the subharmonic response with a two-frequency excitation technique Andy D. Phelps and Timothy G. Leighton Institute of Sound and Vibration Research, University of Southampton, Southampton SO17 1BJ, United Kingdom
~Received 28 June 1994; accepted for publication 31 October 1995! Sizing bubbles in fluid using a two-frequency excitation technique is not prone to the same drawbacks of some other sizing methods—it has a global maximum at the bubble resonance frequency and allows good spatial resolution. The bubble is insonated with a high fixed imaging signal and a variable pumping signal tuned to the resonant frequency of the bubble, which are coupled at resonance by the high-amplitude oscillation of the bubble wall, with the formation of sum-and-difference terms. This paper examines both the resonance and off-resonance behavior of such combination frequency signals. A coupling of the subharmonic bubble response with the imaging frequency is shown to be a much more accurate and unambiguous detector of the bubble resonance than couplings involving the fundamental resonance. The characteristics of this subharmonic signal are examined using an automated sizing method, and the dependence of the response on the pumping signal amplitude and the frequency step size between two successive pumping frequencies is examined. The location of a definite subharmonic threshold is reported and quantified both for single bubbles held on a wire and for free rising bubbles moving through the focus of the transducers. This amplitude is found to be orders of magnitude lower than that predicted by traditional volumetric pulsation models, but agrees very closely with the theoretical onset of surface waves. © 1996 Acoustical Society of America. PACS numbers: 43.25.Yw, 43.30.Gv, 43.30.Lz
INTRODUCTION
The appearance of gas bubbles in fluid media is an important phenomenon, and an ability to measure and count them has many practical applications, including studies into decompression sickness,1 cardiac pressure fluctuation measurements2 and minimizing the thermal loading on coolant systems.3 Investigations have also been made into the oceanic bubble population, which has been shown to contribute to the ambient noise4 and sound propagation waveguide characteristics,5,6 and can significantly influence the flux of atmospheric gases into the oceans.7,8 Acoustic techniques are very suitable for bubble sizing:9 there is a large impedance mismatch at the gas–liquid interface and the significant difference in the compressibility of the gas and the liquid means that the bubble can couple strongly with pressure fluctuations. For low-amplitude excitation by a sound field, the bubble wall moves in an approximately linear manner, and the pulsation of the bubble can be modeled as a lightly damped single degree of freedom system. As such it has a well-defined acoustic resonance n r , which can be expressed as
n r5
S
D AH S 1
2 p R 0 Ar
3
3 k P 01
D
J
2s 2s 4h2 2 PV 2 1 P V2 , R0 R0 r R 20
~1!
where R 0 is the equilibrium bubble radius, k is the polytropic index of the bubble gas, P 0 is the hydrostatic pressure, P V is the vapor pressure, r is the density of the fluid medium, s is 1985
J. Acoust. Soc. Am. 99 (4), Pt. 1, April 1996
the surface tension, and h is the shear viscosity coefficient. This result is derived from the Rayleigh–Plesset equation assuming small-amplitude pulsations.9 Thus from a knowledge of the ambient conditions and the polytropic index ~which can itself be theoretically estimated10!, the radius of a bubble can readily be determined from its resonance frequency. Although several different acoustical methods have been proposed to make use of this strong scattering property, including detection of linear backscatter from a bubble at resonance,2 Doppler techniques11 and second harmonic generation,12 all these have proved limited.9,13 The method outlined in this paper utilizes the high-amplitude nonlinear response of bubbles at resonance. An asymmetry is introduced into the motion of a bubble wall at higher amplitude because a pulsating bubble can potentially expand without limit, but only contract to a finite size as its radius tends to zero. Other nonlinearities also appear at these higher amplitudes, for example in the stiffness of the gas. This behavior manifests itself in the form of oscillations whose frequencies are harmonics of the resonant driving sound field. The sizing technique relies on examining the coupling of two sound fields incident on the bubble, introduced by Newhouse and Shankar.13 The bubble is insonated with two frequencies, one a high fixed frequency v i ~called the imaging frequency!, and another lower frequency v p which is tuned to the resonant frequency of the bubble ~called the pump frequency!. Because the imaging frequency is three orders of magnitude higher than the pumping frequency, the bubble pulsation is effectively ‘‘frozen’’ during a single imaging cycle. Therefore when a bubble is insonated in this
0001-4966/96/99(4)/1985/8/$6.00
© 1996 Acoustical Society of America
1985
FIG. 2. The equipment arrangement used in the tests. The three transducers are drawn out of their experimental alignment for clarity.
FIG. 1. Returned signals from a bubble insonated at two frequencies measured with a high-frequency probe—the high-frequency imaging signal was set at 1.1 MHz, and the bubble resonance/pump frequency at 2160 Hz. The data were sampled at 10 MHz on a LeCroy 9314L digital oscilloscope. Plot ~a! shows the sum-and-difference direct coupling by a bubble excited at 25 Pa 0-Pk, whereas plot ~b! shows the emergence of the subharmonic sumand-difference signal from the same bubble driven at 40 Pa 0-Pk. The high carrier frequency plots so densely as to appear black in the figure.
way, the returned signal is a measure of the geometric scattering from a target whose acoustic cross section varies periodically. In Fig. 1~a! the high amplitude nonlinear pulsations of a bubble at resonance couples the two sound fields together, so that the signal returned from the bubble consists of the imaging frequency amplitude modulated by the pump/ resonance frequency. This coupling, which can be detected when the pump frequency is at or close to the bubble resonance, becomes evident through the appearance of sum-anddifference frequencies at v i 1 v p and v i 2 v p in the returned signal. However, if the bubble is driven by a sound field of slightly greater amplitude, other frequencies can be stimulated by the nonlinear motion of the bubble wall at resonance. The most prominent of these frequencies is a subharmonic at v p /2, which manifests itself in the scattered pressure-time history as alternate high and low peaks, corresponding to similar maxima in the scattering cross section of the bubble. This subharmonic emission will likewise undergo sum-and-difference coupling with the imaging frequency,14,15 1986
J. Acoust. Soc. Am., Vol. 99, No. 4, Pt. 1, April 1996
and give rise to signals at v i 6 v p /2. This coupled signal is presented as Fig. 1~b! using the same bubble as the direct coupled example shown in Fig. 1~a!, but driven at higher amplitude. The subharmonic coupling has been shown to be a much more accurate indicator of the bubble resonant frequency,15,16 since it falls off much faster as the bubble is insonated away from resonance than does the fundamental sum-and-difference scattering. This paper presents the work done to date investigating how this method might be employed to accurately size bubbles. The tests can be split into two sections—in the first, stationary bubbles held on a wire are examined, and in the second section free rising bubbles are used to verify these results. For all the tests reported, single size bubbles were used in order to fully characterize the detection mechanism, and investigate the off-resonance behavior of the technique. In addition, the use of single bubbles allows identification of alternative sources of coupling which, if an unknown bubble population were being investigated, might be inadvertently construed in terms of bubble presence: The subharmonic generation mechanism is not prone to the erroneous triggering inherent with other indicators, where a positive signal can be returned even in the absence of a resonant bubble. The text demonstrates the benefit of using this subharmonic signal as the indicator of a bubble presence, and outlines some of the considerations involved with the practical construction of an automated bubble sizer. In addition, through the use of computer simulations and theoretical models, the mechanism by which the subharmonic is produced is examined, and the text presents evidence which suggests that surface waves around the bubble wall are responsible. I. EXPERIMENTAL DETAILS
The experiments were performed in a 1.8-m31.2-m 31.2-m-deep glass reinforced plastic tank, which is filled with tap water to 1-m depth, and is vibration isolated by four 1400 mm3300 mm Tico pads spaced equidistantly along its base. The experimental setup is shown in Fig. 2. A. D. Phelps and T. G. Leighton: Bubble sizing
1986
FIG. 3. Arrangement of the transducers in a rigid cage.
The high-frequency imaging signal is provided by a Therasonic 1030 Ultrasound Generator, as manufactured by Electro-Medical Supplies, providing a continuous tone at approximately 1.1 MHz. The low-frequency projector is a Gearing and Watson UW60 moving coil underwater loudspeaker with an effective frequency range of 1–10 kHz, and the high-frequency receiver is an unfocused Panametrics V302 immersion transducer, which is resonant at 1 MHz and has a half-power bandwidth of 450 kHz. The high-frequency projector and receiver are mounted at right angles to each other to minimise direct transfer of sound from one to the other, and these three transducers are clamped onto a rigid stainless-steel cage to maintain their relative alignment from one test to the next, as illustrated in Fig. 3. The signal to the low-frequency projector is driven by a Bruel & Kjaer type 2713A power amplifier, and the returned signal from the receiver transducer is conditioned by a Diagnostic Sonar 5670 preamplifier. Both projection and detection systems were checked to ensure they introduced no harmonic distortion at the frequency locations of interest. The signal generation and detection is controlled by a specialist MATLAB data acquisition P.C. interface package and software. The purpose of the unit is to generate the specified pumping frequencies, and to simultaneously acquire the returned signal data from the receiver transducer. The MATLAB output signal is passed through a digital to analog converter, and then through a low-pass reconstruction filter to remove any unwanted harmonics. This signal is amplified and broadcast into the tank. The returned signal from the bubble is picked up by the high-frequency receiver and passed through a preamplifier. This signal is heterodyned with a dummy signal from the Therasonic—the result of this procedure is to shift the imaging signal frequency down to dc, and to reproduce the useful sum-and-difference information at a much lower frequency. This allows the use of a smaller sampling rate and reduces the amount of data storage, which slowed previous measurement methods.16 This heterodyned signal is passed through a bandpass filter to prevent aliasing and remove low-frequency signal components caused by water perturbations etc., and is then sampled by the MATLAB acquisition unit. The time history is stored in memory and the next pumping frequency signal generated, and so on. At the end of the data collection these time histories are FFTed for analysis. This allows the bubble’s dependence on two important parameters to be investigated, 1987
J. Acoust. Soc. Am., Vol. 99, No. 4, Pt. 1, April 1996
namely the pumping signal amplitude and the frequency step size between successive projector outputs. Prior to testing, the frequency response of the tank and low-frequency signal generation equipment is measured, and the amplitude of the pump signal automatically corrected to maintain a constant insonation pressure level. In addition, it is possible to include a delay time between the start of the insonation and the data acquisition to allow for any transient components in the bubble response to die away. The whole process of output/delay/input/storage takes around 0.4 s per pump frequency. For all the tests presented in this paper the bubbles were measured at 15 cm below the surface of the water. In the first set of tests a single bubble attached to a thin wire was employed to characterize the system. This wire was mounted horizontally in front of the projector to prevent bubbles being displaced by buoyant forces ~unlike in previous studies,15,16 the wire did not need to be greased to assist attachment!. The wire was fixed to two lengths of rubber tubing, which in turn were fastened to the cage at both sides. After experimentation, the bubbles were detached from the wire into a glass flask, where their axial lengths were measured by a traveling microscope, and corrected to account for changes in hydrostatic pressure. This allows a comparison with the radius estimate obtained by using the experimental value of the acoustic resonance in Eq. ~1!. The bubble is held by buoyancy against the flat upper surface of the flask, where its diameter can be measured from above and from the side. Since the bubble is distorted, an equivalent radius is calculated to represent the radius which the same volume of gas would adopt if spherical, and is given as 31 diameter1 61 depth. This has been shown by earlier workers14 to be a reasonable estimate of the equivalent radius. The second series of tests used moving bubbles which were released from a needle just below the focus of the three transducers. The bubbler consisted of a comparatively large bore size 15 hypodermic needle with the plunger from a Hamilton #701 microsyringe inserted along its length. This was then attached to a compressed air supply with an in-line regulator valve. By controlling the amount of the plunger that was inside the needle, different flow rates and bubble sizes could be obtained. The bubbles produced by this method were sized using a passive technique,17 which measured their characteristic resonant ring upon formation, and this measurement of their acoustic resonance was used to verify the results from the active tests. The bubbles were found to be reproducible in size and formed at a constant flow rate, due to the large pressure drop at the needle tip.18 II. RESULTS
In the preliminary stages of the research before the addition of the heterodyning step in the data acquisition process, tests were performed using high sampling rates and full length FFT frequency analysis in order to ensure that heterodyning itself did not corrupt the data from the bubble. The result of one such run is given in Fig. 4. The data were collected at 3.33 MHz using an automated specialist data acquisition/tone generation board, which took in over 500 000 samples in order to give the necessary frequency A. D. Phelps and T. G. Leighton: Bubble sizing
1987
FIG. 4. Mesh plot of returned signal strength through a bubble’s resonance using the initial full length signal processing method. The bubble was insonated at 95 Pa and the pumping frequency was stepped in 25-Hz intervals.
resolution. Full details and results using this data collection process are published elsewhere.16 The data were taken from a bubble tethered to a wire insonated at 95 Pa, and the pumping frequency was stepped through its resonance in 25-Hz intervals. The plot shows the measured response in a narrow frequency window ~1 132 900 to 1 138 600 Hz! over 20 different pumping frequencies, from 1825 to 2300 Hz. The main ridge, which is constant over the twenty tests, is the imaging signal from the Therasonic frequency generator at 1 134 700 Hz. The Therasonic produces side lobes which are clearly visible either side of its center peak, and these are also evident around the sum-and-difference signals. All these lobes are situated within 400 Hz of the main beam, which is less than a fifth of the bubble resonance, and so can clearly be distinguished from signals related to the bubble presence. To the left of this imaging signal is a broken ridge which is similarly present over all 20 pumping signals—this is the coupled response corresponding to v i 2 v p . Between the two bands is a single peak which occurs at a pumping frequency of 2050 Hz. This is due to the subharmonic emission from the bubble, and is located at v i 2 v p /2. An ultraharmonic signal is also visible over a very narrow pumping frequency span, located at v i 23 v p /2, although it is not as prominent as the subharmonic signal. This allows the resonance frequency of the bubble to be very accurately estimated at 2050625 Hz, which corresponds to a radius of 1.6160.02 mm using Eq. ~1!. The equivalent radius of the bubble, as measured under the traveling microscope after detachment, was 1.6560.05 mm. Having determined the spectral characteristics of the full MHz spectrum, the tests for determining bubble characteristics were performed using the heterodyner. A typical sweep across the resonance of a single tethered bubble is shown in Fig. 5. The plot shows the heterodyned output from the highfrequency receiver between 0 and 3400 Hz for a bubble insonated between 1700 and 2700 Hz in discrete 25-Hz steps. The amplitude of the excitation was 54 Pa, and a delay of 500 cycles between the insonation and data collection was implemented to remove any transient signals. As before, the plot shows the direct coupled v i 6 v p ridge present over the entire 41 pumping tones, which rises up to a maximum at the bubble resonance and then falls 1988
J. Acoust. Soc. Am., Vol. 99, No. 4, Pt. 1, April 1996
FIG. 5. Mesh plot of returned signal strength through a bubble’s resonance. The bubble was insonated at 54 Pa and the pumping frequency was stepped in 25-Hz intervals.
away again. As a result of the heterodyning process, the signal contained above the imaging frequency is overlaid with that below it, so that every peak is a sum of the v i 1 v p and the v i 2 v p signals. Behind this the narrower peak from the v i 6 v p /2 signal is clearly visible, due to the bubble’s subharmonic output coupling with the imaging signal. This is evidently a much more pronounced indicator of the bubble resonance than the peak in the v i 6 v p signal. The important data from this plot can alternately be displayed as a graph of the signal height against pumping frequency, where for each input tone the heights of the power spectrum at the speculative locations of the direct coupled response and its subharmonic are measured. The data presented in Fig. 5 are plotted in this manner, and shown in Fig. 6. This clearly contrasts the accuracy of the two bubble resonance indicators. The subharmonic peak stands around 50 dB above the noise level, and the frequency spread over which the signal is present is approximately 100 Hz, centered around 2475 Hz ~this corresponds to a bubble of radius 1.3460.02 mm, which may be compared with the optical measurement of 1.3160.05 mm!. Similarly, the strength of the direct coupled signal from the bubble at v i 6 v p falls off either side of its resonance but at a far slower rate, such that the actual spread of the signal cannot be determined as it is still at least 20 dB above the noise floor at the extremes of
FIG. 6. Slice through meshplot shown in Fig. 5 at the frequencies coupling the imaging signal to v p and to v p /2. A. D. Phelps and T. G. Leighton: Bubble sizing
1988
FIG. 7. Plot showing the variation in sum-and-difference subharmonic height through resonance as the amplitude of the pumping signal is altered. The frequency step size is 5 Hz, and the lines correspond to pressure amplitudes of 34 Pa ~dotted!, 36 Pa ~large dashes!, 40 Pa ~dash-dot!, 50 Pa ~unbroken! and 70 Pa ~small dashes!.
the plot. The ordinate of the plot shows the signal strength in dB with a common but arbitrary reference value. This is because the level of the signal picked up from the heterodyner is directly proportional to the output level from the imaging projector, and therefore only relative comparisons are important here. Tests on single tethered bubbles were performed to investigate the response of the subharmonic for different amplitudes of excitation. The bubbles were insonated in 5-Hz steps through their resonance at increasing pumping frequency amplitude, and the results of five amplitude levels from one such sweep are given in Fig. 7. The graph shows that when the bubble is insonated at 34 Pa no subharmonic signal exists, but for a marginal increase in pumping amplitude to 36 Pa a strong signal emerges from the noise. As the insonation level is further increased the amplitude of the subharmonic signal also grows, but more significantly the frequency range over which a subharmonic signal is produced also increases. At 70-Pa insonation level, the frequency span for the excited signal is over 120 Hz ~i.e. 5% of the resonant value! and much of the accuracy which benefits this technique is lost. The measured resonance of 2485610 Hz equates to a radius of 1.3360.01 mm, which compares well with the equivalent radius measured optically of 1.3260.05 mm. Tests were performed to investigate the emergence of this subharmonic sum-and-difference signal for various different bubble sizes resonant in the range 2000 to 3200 Hz. The increasing amplitude method described above was employed for 30 different bubbles, and their subharmonic excitation thresholds measured. The apparent location of these thresholds is shown in Fig. 8, along with the least-squares fit line. The scatter of the points around the best fit line results from an inability to perfectly measure and calibrate the pump sound field at the focus of the transducers, and it is this uncertainty that limits the experimental accuracy of the tests. Using the same bubbles, the frequency span over which the subharmonic signal is produced was also examined for 1989
J. Acoust. Soc. Am., Vol. 99, No. 4, Pt. 1, April 1996
FIG. 8. Plot showing the thresholds for sum-and-difference subharmonic excitation for various bubble sizes at 15-cm depth. Each point represents a single measurement, the more significant associated uncertainty being of the order 63 Pa. The graph also shows the line of regression to the data.
each increased pumping signal, and the amplitudes at which this span reached 25, 50, and 100 Hz were noted. Figure 9 again shows the location of the subharmonic v i 6 v p /2 threshold, and additionally shows the 25-, 50-, and 100-Hz span points. For each set of data points their minimum regression lines are also presented. The actual v i 6 v p /2 threshold amplitude appears to steadily increase as the resonant frequency gets larger, and the points lie closely around their corresponding leastsquares fit line. This implies that there is a definite repeatable threshold below which no subharmonic signal exists. However, it is further apparent from Fig. 9 that the amplitude at which the subharmonic signal is produced from a 25-Hz pumping frequency span is almost exactly the same as the v i 6 v p /2 threshold itself, and that therefore in a practical application there must exist a minimum step size for the interrogating pumping signal, and consequently a maximum achievable resolution between two bubbles. It is also worth noting that as the amplitude of the pumping signal is increased, the v i 6 v p /2 signal becomes more unpredictable in its behavior, and so the amplitude values at which the fre-
FIG. 9. Plot showing the thresholds for sum-and-difference subharmonic excitation for various bubble sizes at 15-cm depth ~crosses!, and the amplitude values at which the pumping frequency span capable of producing a v i 6 v p /2 signal passes 25 Hz ~black circles!, 50 Hz ~clear triangles!, and 100 Hz ~gray squares!. The graph also shows the lines of regression to the data. A. D. Phelps and T. G. Leighton: Bubble sizing
1989
FIG. 10. Two tone grey-scale map of returned signal strength through resonance for the moving bubble tests. The bubble was insonated at 270 Pa and the pumping frequency was stepped in 25-Hz intervals.
quency span is 100 Hz do not lie very closely to their minimum regression fit. Having performed these tests using bubbles held on a wire, the technique was verified with free-rising bubbles. Again only using bubbles of one size, the results of one such run are presented in Fig. 10 as a grey scale map. The bubble was swept between 2500 and 3500 Hz in 25-Hz steps, the excitation amplitude was 270 Pa and the delay time to remove any transient response was necessarily set to zero. The results of the moving bubble sweeps are better displayed as a grey-scale plot as the signal content is unclear when shown on a mesh plot. This is because the returned signal has a variable backscattered strength due to the changing position of a bubble in the transducer focus from one pump output to the next, and there is a variable frequency Doppler shift, whose value depends on the relative angle between the bubble motion and the insonation beam. The plot shows a double peaked ridge at the coupled signal locations, which occurs because the dummy signal from the Therasonic with which the heterodyning is performed is no longer the center frequency returned from the receiver hydrophone due to this Doppler shift. Thus, after the signal multiplication, both the v i 1 v p peak and the v i 2 v p peak are evident. The plot, however, shows a clear region where a subharmonic signal is present for pump frequencies between 3050 and 3150 Hz. This is also evident in Fig. 11, which shows a slice through the signal power spectrum at 3150 Hz. This resonance agrees with the natural frequency of 3200 Hz for the bubbles measured upon injection. In addition, tests were also performed on these free rising bubbles to determine the location of their subharmonic sum-and-difference threshold. Due to the variable nature of the returned signal, the methodology for these tests was to insonate a rising bubble stream through their resonance a number of times, and manually alter the amplitude of the sound field depending on whether a subharmonic appeared or not. Using this method, the threshold of subharmonic production from free-rising bubbles of approximately 3000-Hz resonance lies between 120 and 140 Pa. This is below the predicted threshold for rectified diffusion,19,20 thereby ensur1990
J. Acoust. Soc. Am., Vol. 99, No. 4, Pt. 1, April 1996
FIG. 11. Slice through gray-scale plot shown in Fig. 10 at 3150 Hz, showing the direct coupled response and the subharmonic.
ing that measurements on a bubble population do not alter the individual bubble sizes. III. DISCUSSION
It is evident from Figs. 4 and 5 that, whilst both the v i 6 v p and the v i 6 v p /2 signals peak at the bubble resonance, the definition from the subharmonic response is much more accurate. In addition, there is a considerable offresonance contribution from the direct coupling, with the v i 6 v p response produced from a bubble far from its resonance frequency. Previous tests using this technique21,22 have taken the presence of the signal at v i 6 v p to be an indicator of a bubble at resonance, although this is clearly not so. If Figs. 4 and 5, taken for single bubbles, are interpreted in this way, one incorrectly infers the presence of a bubble population having a continuous distribution of sizes, with the most common resonant frequencies being 2050 and 2450 Hz, respectively. Furthermore, earlier tests have shown that the coupling which gives rise to the v i 6 v p signal can be induced through other mechanisms such as the direct action of the low-frequency projector on the receiver transducer, turbulence etc.16 The subharmonic, however, has only been found to couple to the imaging frequency through the action of a bubble, and hence the v i 6 v p /2 signal is an unambiguous indicator of a bubble’s presence. The use of this method for automated bubble sizing and counting presents some interesting questions. The protocol for building an automated sizer for moving bubbles would necessarily have to relate each peak in the response to the presence of a single bubble, as the signal height is dependent on the location of the bubble in the pump field. A practical bubble sizer would therefore insonate a bubble population at a certain frequency and amplitude, distinguish whether the returned signal was due to the presence of a single resonant bubble or not, step to the consecutive pumping frequency, and so on. This step size has to be large enough to ensure that a bubble does not contribute a positive resonant signal to two adjacent pump frequencies, but small enough to enable every bubble to be counted once, and to preserve the frequency resolution which benefits the method. A. D. Phelps and T. G. Leighton: Bubble sizing
1990
It is clear from Figs. 7–9 that a very definite amplitude threshold exists below which no signal at v i 6 v p /2 is present, and within the limits of experimental accuracy its location appears to be repeatable and quantifiable. Thus as the pumping signal step size is decreased and the frequency resolution of the scan improves, the insonation amplitude must also be matched more accurately to the v i 6 v p /2 threshold. Above this threshold the subharmonic signal rapidly spreads out along the frequency axis so that a response is produced by a bubble when the pumping frequency is further and further away from its resonant frequency. This frequency spread is such that even at the threshold, the width of the subharmonic response is 25 Hz. Thus it would be impossible to insonate a bubble population with a step size below 25 Hz and be able to relate each peak to a separately resonant bubble regardless of how precisely the pumping signal amplitude was set. At 3 kHz this represents a radius resolution of approximately 8 mm. It should be noted that, like all acoustic sizing techniques that exploit resonance excitation, it will measure the value of each bubble’s resonance as it exists in the population. Owing to the interaction between multiple bubbles, their resonant frequencies may be less than those which would be measured if they were individually isolated.23 Conversely, there also appears to be a maximum step size with which a bubble population should be interrogated. As the pumping amplitude is increased, the subharmonic excitation frequency span becomes harder to predict, and therefore an automated sizing technique which uses larger frequency steps and an increased pumping amplitude may give ambiguous results, as it will be unclear whether it is actually measuring every bubble or counting the same one twice. The tests on free-rising bubbles were performed to verify the data collected for the tests that involved tethered bubbles. They proved that the technique can be extended to moving bubbles and that the subharmonic emission was not a by-product of the attachment process. The differences in threshold between the two series of tests ~;35 Pa for attached bubbles, and ;120 Pa for free rising bubbles! may be due to several factors. One explanation is that the lower threshold measured with tethered bubbles is more accurate, and the free-rising bubbles were never insonated precisely at their resonance frequency or exactly in the focus of the three transducers. This would yield a higher threshold due to the sharp off-resonance fall off associated with the subharmonic response. Other factors that can contribute to the change are different amounts of impurities in the water affecting the surface tension24 and damping, and the possible effect on the response of the different delay times between insonation and acquisition. One important factor might be the effect of the attachment process itself, and this may be investigated to a certain extent by considering the possible mechanisms for the generation of the subharmonic signal. The possibility that it arises through a subharmonic contribution in the volumetric pulsation of a spherical bubble was examined using simulations to calculate radius-time curves by numerical integration of the Gilmore–Akulichev formulation for bubble dynamics, using a 4th-order Runge–Kutta method.25 The results from 1991
J. Acoust. Soc. Am., Vol. 99, No. 4, Pt. 1, April 1996
such simulations show that the first volumetric bifurcation occurs at 23105-Pa insonation amplitude for a 1-mm bubble ~i.e., one whose resonance frequency is approximately 3 kHz! driven at its linear resonance. This is three orders of magnitude higher than the experimental results. Unless the model is exceptionally unrefined with respect to subharmonic generation ~the Gilmore–Akulichev formulation does not incorporate a complete description of the damping26!, this finding suggests that volumetric pulsations are not the mechanism by which the subharmonics are produced. Workers investigating the emergence of the subharmonic signal27,28 have shown using small perturbation analysis that a response can be readily produced when a bubble is driven at twice its linear resonance. Prosperetti28 calculates that the subharmonic threshold for a 1-mm radius bubble is roughly 40 000 Pa, which is again higher than that measured experimentally. The optical and passive acoustic verification techniques which were performed in parallel with the active acoustic measurements have shown the bubbles to be excited at their fundamental resonance frequency, and so this is clearly not the generation mechanism either. The third possible mechanism investigated considered the possibility that surface waves around the bubble wall are responsible for the subharmonic signal. The earliest report of a subharmonic oscillation was by Faraday29,30 who found waves oscillating at half the driving frequency on the watercovered surface of a vibrating plate, and a paper on the pulsating bubble subharmonic signal14 shows a photograph of a tethered bubble being driven at its resonance frequency, with surface waves clearly visible around the wall. In his review paper, Neppiras20 reports that such ‘surface vibrations are parametrically excited at half the excitation frequency and are strongly coupled to the radial motion’, and gives details on theoretical modeling which can be used to calculate the onset threshold for a plane surface ~which is a valid approximation to a bubble if the mode-order is high!. The pressure amplitude P a of the insonating signal above which these surface waves are excited is
FIG. 12. Plot showing the thresholds for subharmonic excitation for various bubble sizes at 15-cm depth, and their line of regression ~dashed!. The plot additionally shows the surface wave onset threshold ~unbroken! calculated from plane-surface theory. A. D. Phelps and T. G. Leighton: Bubble sizing
1991
P a5
6 h g p 0 d tot R0
A
3
2 , vsr 2
~2!
where d tot is the total nondimensional damping constant. These calculations give an onset threshold value of 38 Pa for a 1-mm radius bubble at resonance. This obviously compares very closely with the experimental data, and it is therefore possible that this is the mechanism by which the subharmonic signal is generated. As a further example, the surface wave onset thresholds for bubbles resonant between 2000 and 3200 Hz were calculated, and the results are shown in Fig. 12 overlaid with the experimentally measured thresholds. The plot shows good agreement between the theory and the experimental data, although there is a slight offset apparent, which may be because of the plane surface approximation in the threshold calculations. IV. CONCLUSIONS
When a bubble is insonated by two sound fields, one a fixed imaging frequency and the other ~the pump signal! able to span a range which includes the resonant frequency of the bubble, the coupling of the signals presents a way of detecting them and accurately finding their resonant frequency. The paper details the results of tests which have been performed by stepping the pump signal in discrete frequency increments through the expected location of the bubble resonance, and gives evidence that detecting the resonant frequency by observing the subharmonic emission at v i 6 v p /2 is a more accurate and unambiguous indicator than the signal at v i 6 v p . The dependence of the response on alterations of the frequency increment step size and on the amplitude of the pump signal has also been examined. It is apparent that the coupled subharmonic signal only exists above a welldefined insonation amplitude threshold. However, for only small increases in amplitude above this threshold the range of pumping frequencies over which a signal is produced also increases rapidly. It appears that there is both a maximum frequency resolution for stepping through a bubble population, and a maximum practical step size where the width of the subharmonic peak becomes unpredictable. The tests performed indicate a threshold for subharmonic excitation three orders of magnitude below those predicted using volumetric pulsation models of a spherical bubble, which suggests that they are probably due to some other phenomenon. Using theory developed for plane surfaces, the onset threshold for surface waves is shown to be very close to the experimentally observed subharmonic thresholds, and it is postulated that these surface waves are the source of the bubble subharmonic response. ACKNOWLEDGMENTS
This work was supported by funding from the Natural Environment Research Council, reference SIDAL 00670. The authors wish to thank Dave Ramble ~who is himself funded by EPSRC! for his assistance in obtaining some of the plots. 1
E. O. Belcher, ‘‘Quantification of bubbles formed in animals and man
1992
J. Acoust. Soc. Am., Vol. 99, No. 4, Pt. 1, April 1996
during decompression,’’ IEEE Trans. Biomed. Eng. 27, 330–338 ~1980!. W. M. Fairbank and M. O. Scully, ‘‘A new non-invasive technique for cardiac pressure measurement: resonant scattering of ultrasound from bubbles,’’ IEEE Trans. Biomed. Eng. 24, 107–110 ~1977!. 3 H. J. M. Hulshof and F. Schurink, ‘‘Continuous ultrasonic waves to detect steam bubbles in water under high pressure,’’ Kema Scientific & Tech. Rep. 3, 61– 69 ~1985!. 4 G. M. Wenz, ‘‘Acoustic ambient noise in the ocean: spectra and sources,’’ J. Acoust. Soc. Am. 34, 1936 –1956 ~1962!. 5 M. J. Buckingham, ‘‘On acoustic transmission in ocean-surface waveguides,’’ Philos. Trans. R. Soc. London 335, 513–555 ~1991!. 6 D. M. Farmer and S. Vagel, ‘‘Waveguide propagation of ambient sound in the ocean-surface bubble layer,’’ J. Acoust. Soc. Am. 86, 1897–1908 ~1989!. 7 D. K. Woolf and S. A. Thorpe, ‘‘Bubbles and the air-sea exchange of gases in near-saturation conditions,’’ J. Marine Res. 49, 435– 466 ~1991!. 8 S. A. Thorpe, ‘‘Bubble clouds and the dynamics of the upper ocean,’’ QJR Meteorol. Soc. 118, 1–22 ~1992!. 9 T. G. Leighton, The Acoustic Bubble ~Academic, London, 1994!. 10 C. Devin, Jr., ‘‘Survey of thermal, radiation, and viscous damping of pulsating air bubbles in water,’’ J. Acoust. Soc. Am. 31, 1654 –1667 ~1959!. 11 R. Y. Nishi, ‘‘Ultrasonic detection of bubbles with Doppler flow transducers,’’ Ultrasonics 10, 173–179 ~1972!. 12 D. L. Miller, ‘‘Ultrasonic detection of resonant cavitation bubbles in a flow tube by their second-harmonic emissions,’’ Ultrasonics 19, 217–224 ~1981!. 13 V. L. Newhouse and P. M. Shankar, ‘‘Bubble sizing using the nonlinear mixing of two frequencies,’’ J. Acoust. Soc. Am. 75, 1473–1477 ~1984!. 14 T. G. Leighton, R. J. Lingard, A. J. Walton, and J. E. Field, ‘‘Acoustic bubble sizing by combination of subharmonic emissions with imaging frequency,’’ Ultrasonics 29, 319–323 ~1991!. 15 A. J. Hardwick, T. G. Leighton, A. J. Walton, and J. E. Field, ‘‘Acoustic bubble sizing through nonlinear combinations involving parametric excitations,’’ in Proceedings of the European Conference on Underwater Acoustics, edited by M. Weydert ~Elsevier Applied Science, Essex, 1992!, pp. 153–156. 16 A. D. Phelps and T. G. Leighton, ‘‘Investigations into the use of two frequency excitation to accurately determine bubble sizes,’’ in Proceedings of the IUTAM Conference on Bubble Dynamics and Interface Phenomena, edited by J. Blake ~Kluwer Academic, Dordrecht, The Netherlands, 1994!, pp. 475– 484. 17 T. G. Leighton, M. F. Schneider, and P. R. White, ‘‘Study of bubble fragmentation using optical and acoustic techniques,’’ in Proceedings of the 3rd Conference on Sea Surface Sound, edited by M. Buckingham and J.R. Potter ~World Scientific, Singapore, 1995!, pp. 414 – 428. 18 R. Clift, J. R. Grace, and M. E. Weber, Bubbles, Drops And Particles ~Academic, New York, 1978!. 19 M. H. Safar, ‘‘Comments on papers concerning rectified diffusion of cavitation bubbles,’’ J. Acoust. Soc. Am. 43, 1188 –1189 ~1968!. 20 E. A. Neppiras, ‘‘Acoustic Cavitation,’’ Phys. Rep. 61, 159–251 ~1980!. 21 J. Y. Chapelon, P. M. Shankar, and V. L. Newhouse, ‘‘Ultrasonic measurement of bubble cloud size profiles,’’ J. Acoust. Soc. Am. 78, 196 –201 ~1985!. 22 D. Koller, Y. Li, P. M. Shankar, and V. L. Newhouse, ‘‘High speed bubble sizing using the double frequency technique for oceanographic applications,’’ IEEE J. Oceanic Eng. 17, 288 –291 ~1992!. 23 M. Strasberg, ‘‘The pulsation frequency of nonspherical gas bubbles in liquids,’’ J. Acoust. Soc. Am. 25, 536 –537 ~1953!. 24 M. L. Exner and W. Hampe, ‘‘Experimental determination of the damping of pulsating air bubbles in water,’’ Acustica 3, 67–72 ~1953!. 25 M. J. Choi, A. J. Coleman, and J. E. Saunders, ‘‘The influence of fluid properties and phase amplitude on bubble dynamics in the field of a shock wave lithotripter,’’ Phys. Med. Biol. 38, 1561–1573 ~1993!. 26 A. Prosperetti, L. A. Crum, and K. E. Commander, ‘‘Nonlinear bubble dynamics,’’ J. Acoust. Soc. Am. 83, 502–513 ~1988!. 27 A. Eller and H. G. Flynn, ‘‘Generation of subharmonics of order one-half by bubbles in a sound field,’’ J. Acoust. Soc. Am. 46, 722–727 ~1969!. 28 A. Prosperetti, ‘‘Application of the subharmonic threshold to the measurement of the damping of oscillating gas bubbles,’’ J. Acoust. Soc. Am. 61, 11–16 ~1977!. 29 M. Faraday, ‘‘On the forms and states assumed by fluids in contact with vibrating elastic surfaces,’’ Philos. Trans. R. Soc. London 121, 319–340 ~1831!. 30 W. Lauterborn and J. Holfuss, ‘‘Acoustic Chaos,’’ Int. J. Bifurcation Chaos 1, 13–26 ~1991!. 2
A. D. Phelps and T. G. Leighton: Bubble sizing
1992