IEEE JOURNAL OF OCEANIC ENGINEERING. VOL. 32, NO. I. JANUARY 2007
133
High-Resolution Mapping of Mines and Ripples at the Martha's Vineyard Coastal Observatory Larry A. Mayer, Richard Raymond, Gerd Glang, Michael D. Richardson, Peter Traykovski, and Arthur C. Trembanis
Abstract—High-resolution multibeam sonar and state-of-theart data processing and visualization techniques have been used to quantify the evolution of seafloor morphology and the degree of burial of instrumented mines and mine-shapes as part of the U.S. Office of Naval Research (ONR, Arlington, VA) mine burial experiment at the Martha's Vineyard Coastal Observatory (MVCO, Edgartown, MA). Four surveys were conducted over two years at the experiment site with a 455-kHz, Reson 8125 dynamically focused multibeam sonar. The region is characterized by shore-perpendicular alternating zones of coarse-grained sand with 5-25-cm-high, wave orbital-scale ripples, and zones of finer grained sands with smaller (2-5-cm-high) anorbital ripples and, on occasion, medium scale 10-20-cm-high, chaotic or hummocky bedforms. The boundaries between the zones appear to respond over periods of days to months to the predominant wave direction and energy. Smoothing and small shifts of the boundaries to the northeast take place during fair-weather wave conditions while erosion (scalloping of the boundary) and shifts to the north-northwest occur during storm conditions. The multibeam sonar was also able to resolve changes in the orientation and height of fields of ripples that were directly related to the differences in the prevailing wave direction and energy. The alignment of the small scale bedforms with the prevailing wave conditions appears to occur rapidly (on the order of hours or days) when the wave conditions exceed the threshold of sediment motion (most of the time for the fine sands) and particularly during moderate storm conditions. During storm events, erosional "windows" to the coarse layer below appear in the fine-grained sands. These
"window" features are oriented parallel to the prevailing wave direction and reveal orbital-scale ripples that are oriented perpendicular to the prevailing wave direction. The resolution of the multibeam sonar combined with 3-D visualization techniques provided realistic looking images of both instrumented and noninstrumented mines and mine-like objects (including bomb, Manta, and Rockan shapes) that were dimensionally correct and enabled unambiguous identification of the mine type. In two of the surveys (October and December 2004), the mines in the fine-grained sands scoured into local pits but were still perfectly visible and identifiable with the multibeam sonar. In the April 2004 survey, the mines were not visible and apparently were completely buried. In the coarse-grained sand zone, the mines were extremely difficult to detect after initial scour burial as the mines bury until they present the same hydrodynamic roughness as the orbital-scale bedforms and thus blend into the ambient ripple field. Given the relatively large, 3-D, spatial coverage of the multibeam sonar along with its ability to measure the depth of the seafloor and the depth and dimensions of the mine, it is possible to measure directly, the burial by depth and burial by surface area of the mines. The 3-D nature of the multibeam sonar data also allows the direct determination of the volume of material removed from a scour pit.
Manuscript received May 31, 2005; revised October 3, 2005; accepted December 19. 2005. The work of L. A. Mayer, R. Raymond, G. Glang, P. Traykovski, and A. C. Trembanis was supported by the U.S. Office of Naval Research (ONR) under the Grants N00014-01-1-0847, N00014-01-10564, and N00014-03-1-0298. The work of M. D. Richardson was supported by the U.S. Office of Naval Research (NRL) under the Core funding. The work of L. A. Mayer, R. Raymond, and G. Gland was also supported by the National Oceanic and Atmospheric Administration (NOAA) under the Grant NA170G2285. Guest Editor: R. H. Wilkens. L. A. Mayer and R. Raymond are with the Center for Coastal and Ocean Mapping/National Oceanic and Atmospheric Administration (NOAA) Joint Hydrographic Center, the University of New Hampshire, Durham, NH 03824 USA (e-mail:
[email protected]). G Glang is with the National Oceanic and Atmospheric Administration (NOAA) Corps, Office of Coast Survey, Silver Spring, MD 20910-3282 USA (e-mail:
[email protected]). M. D. Richardson is with the Marine Geosciences Division, the U.S. Naval Research Laboratory, Stennis Space Center, MS 39529 USA (e-mail: mike.
[email protected]). P. Traykovski is with the Applied Ocean Physics and Engineering Department, Woods Hole Oceanographic Institution, Woods Hole, MA 02543 USA (e-mail:
[email protected]). A. C. Trembanis is with the Department of Geology, University of Delaware, Newark, DE 19716 USA and with the Virginia Institute of Marine Science, Gloucester Point, VA 23062 USA (e-mail:
[email protected]). Color versions of one or more of the figures in this paper are available online at http://ieeexplore.ieee.org. Digital Object Identifier 10.1109/JOE.2007.890953
I. INTRODUCTION
Index Terms—High-resolution seafloor mapping, hummocky bedforms, mine burial and detection, multibeam sonar, rippled scour depressions, sorted bedforms.
IN an effort to better understand the coastal processes responsible for the burial and exposure of small objects on the seafloor, the U.S. Office of Naval Research (ONR, Arlington, VA) sponsored the mine burial program which included a series of field, laboratory, and theoretical efforts [1]. Amongst the field areas chosen for experimental work was the region around the Martha's Vineyard Coastal Observatory (MVCO, Edgartown, MA) operated by the Woods Hole Oceanographic Institution (WHOI, Woods Hole, MA) [2]. A fundamental component of this field work was the deployment of a number of instrumented mines and other sensors capable of monitoring environmental conditions as well as the orientation and extent of burial of the mines [3], [4]. The MVCO area was chosen because it was known to be a dynamic region with sufficient energy to bury mines by scour, a wide range of sediment types, and evidence of bedform migration [5]. Most importantly, the MVCO "node," a submerged structure in the center of the field area, cabled to a shore station, provided a platform upon which to attach instruments for realtime monitoring of environmental conditions (e.g., wave direction, waveheight, wave period, tide, and current direction). The
0364-9059/S25.00 © 2007 IEEE
Form Approved OMB No. 07040188
REPORT DOCUMENTATION PAGE
The public reporting burden for this collection of information is estimated to average 1 hour per response, including the time for reviewing instructions, searching existing data sources, gathering and maintaining the data needed, and completing and reviewing the collection of Information. Send comments regarding this burden estimate or any other aspect of this collection of information, including suggestions for reducing the burden, to Department of Defense, Washington Headquarters Services, Directorate for Information Operations and Reports (0704-0188), 1215 Jefferson Davis Highway, Suite 1204, Arlington, VA 22202-4302. Respondents should be aware that notwithstanding any other provision of law, no person shail be subject to any penalty for failing to comply with a collection of information if it does not display a currently valid OMB control number.
PLEASE DO NOT RETURN YOUR FORM TO THE ABOVE ADDRESS. 1. REPORT DATE (DD-MM-YYYYI
2. REPORT TYPE
19122005
3. DATES COVERED (From - To)
Journal Article
4. TITLE AND SUBTITLE
5a. CONTRACT NUMBER
High-Resolution Mapping of Mines and Ripples at the Martha's Vineyard Coastal Observatory
5b. GRANT NUMBER
5c. PROGRAM ELEMENT NUMBER
6. AUTHOR(S)
5d. PROJECT NUMBER
Larry A. Mayer, Richard Raymond, Gerd Glang, Michael D. Richardson, Peter Traykovski, Arthur C. Trembanis
5e. TASK NUMBER
5f. WORK UNIT NUMBER
8. PERFORMING ORGANIZATION REPORT NUMBER
7. PERFORMING ORGANIZATION NAME(S) AND ADDRESS(ES)
Naval Research Laboratory Marine Geoacoustics Division Stennis Space Center, MS 39529
NRL/JA/7430-05-6
10. SPONSOR/MONITOR'S ACRONYM(S)
9. SPONSORING/MONITORING AGENCY NAME(S) AND ADDRESS(ES)
ONR Office of Naval Research 800 North Quincy Street Arlington VA 22217-5000
11. SPONSOR/MONITOR'S REPORT MIIMAERfGl
12. DISTRIBUTION/AVAILABILITY STATEMENT
20090522132
Approved for public release; distribution is unlimited
13. SUPPLEMENTARY NOTES
IEEE Journal of Oceanic engineering, Vol. 32, No. 1, January 2007 14. ABSTRACT
Abstract—High-resolution multibeam sonar and state-of-theart data processing and visualization techniques have been used to quantify the evolution of seafloor morphology and the degree of burial of instrumented mines and mine-shapes as part of the U.S. Office of Naval Research (ONR, Arlington, VA) mine burial experiment at the Martha's Vineyard Coastal Observatory (MVCO, Edgartown, MA). Four surveys were conducted over two years at the experiment site with a 455-kHz, Reson 8125 dynamically focused multibeam sonar. The region is characterized by shore-perpendicular alternating zones of coarse-grained sand
15. SUBJECT TERMS
High resolution, seafloor mapping, hummocky bedroms, mine burial and detection, multibeam sonar, rippled scour depressions, sorted bedfroms 16. SECURITY CLASSIFICATION OF: b. ABSTRACT c. THIS PAGE a. REPORT
Unclassified
Unclassified
Unclassified
17. LIMITATION OF ABSTRACT
uu
18. NUMBER 19a. NAME OF RESPONSIBLE PERSON OF Michael Richardson PAGES
19b. TELEPHONE NUMBER (Include area code)
17
228-688-4621 Standard Form 298 (Rev. 8/98) Prescribed by ANSI Std. Z39.18
I w
IEEE JOURNAL OF OCEANIC ENGINEERING, VOL. 32. NO. 1. JANUARY 2007
*1
_*»M
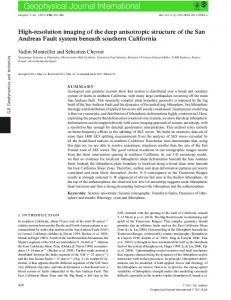
Fig. 1. Three scales of surveys conducted around the MVCO node during the July 2002 reconnaissance survey. A 3 x 5-km2 box with line spacing of 20-40 m, a 1 x 1-km2 box with a line spacing of 12-25 m, and a 100 x 400-m2 box with a line spacing of 4 m. The MVCO node is represented by black star in the middle of the 4-m line spacing box. Depths on the chart are in feet.
node also provided means to connect other instruments (e.g., instrumented mines, sector scanning, and pencil-beam sonars) directly to the shore for real-time, continuous monitoring of mine behavior [3], [6]. In support of these experiments, the MVCO field area was mapped using high-resolution multibeam sonar on four occasions (July 13-18, 2002, October 4-6, 2003, December 4-5, 2003, and April 8-10, 2004). The mapping program had several objectives. Initially, its purpose was to provide a basemap that could be used to determine the optimal locations for the deployment of seafioor instruments and mines. The first pre-mine-deployment survey (in July of 2002) covered an area of 3 x 5 km2 centered around the MVCO node at various scales of mapping resolution (Fig. 1). This survey was designed to provide the overall geospatial context for the experiment. Subsequent surveys (October 2003, December 2003, and April 2004) focused on a smaller area (approximately 1 x 1 km2) again centered around the MVCO node (Fig. 1). These subsequent surveys provided snapshots of changes in the local morphology over the course of the experiment.
While mapping the regional context and local morphology around the MVCO site was a task that we were confident we could complete, we also established several objectives which would severely push the limits of current-day mapping capabilities. To better understand the nature of sediment dynamics in the study area, we hoped that we could also resolve ripple-scale features and their distribution over the region. In the same context, we also hoped that we could provide independent verification of the burial estimates made by the instrumented mines by mapping the mines and their extent of burial (or unburial) at the times of our surveys. Both of these objectives (mapping ripples and mine burial) required the collection of sonar data with subdecimeter resolution (both vertical and horizontal) and positioning at the decimeter level. While these levels of resolution are theoretically possible, to achieve them required careful data collection and processing so as to reduce instrumental and integration artifacts that could easily mask the scales of features we were trying to map.
MAYER el at.: HIGH-RESOLUTION MAPPING OF MINES AND RIPPLES AT THE MVCO
II.
METHODS
A. Sonar To meet the stringent resolution requirements demanded by the survey objectives, an extremely high-resolution multibeam sonar was required. All sonars have fundamental constraints and tradeoffs with respect to frequency of operation, resolution (lateral and vertical), and range of transmission. Increased temporal (vertical) resolution is typically achieved by increasing the frequency of operation (usually providing broader bandwidth), but at the price of greater attenuation and thus shorter propagation ranges. Lateral resolution is determined by the beamwidth, which will be a function of the operating frequency of the sonar as well as the length of the transducer array (the longer the transducer the narrower the beam). Thus, the key to achieving high lateral resolution at a given frequency is increased array length. Increased array length also increases the range at which the contributions of the different emitting points on the transducer face are out of phase with each other (the near-field). Interference of the emitted waves in the near-field makes it difficult to work in this region and, thus, most sonars limit their working range to beyond the near-field where the wavefront approaches a plane and interactions are linear (the far-field). The requirement to work in the far-field limits the lateral resolution achievable by a multibeam sonar. New signal processing capabilities, however, have recently enabled manufacturers to dynamically focus beams in the near-field. This dynamic focusing compensates for the curvature of wavefront in the near-field and allows the sonar to achieve the beamwidth predicted by the array length. Thus, for the Martha's Vineyard mine burial mapping program, we selected the dynamically focused Reson 8125 multibeam sonar. The Reson 8125 operates at 455 kHz, forming 240, 0.5° (across-track) beams over a swath of 120°. The along-track beamwidth is 1°. The manufacturer's claim for vertical resolution for this sonar is 6 mm (determined by the pulse-length); field results indicate achievable vertical resolution on the order of approximately 1 cm. The dynamic focusing allows maintenance of the 0.5° (across-track) beamwidth even at short range which is essential because of the high attenuation at 455 kHz. With a 0.5° beamwidth, the across-track lateral resolution of the sonar (near-nadir) is approximately 10 cm in the 12-m water depth of the MVCO site. B. Positional Control In the absence of vessel motion, refraction, or other degrading factors, it may be possible to achieve the resolution cited previously for a single swath of multibeam sonar data. However, when multiple overlapping swaths of data are collected (necessary to provide 100% coverage of the seafioor) positional uncertainty will limit the horizontal resolution achievable. Because the objectives of the survey were to obtain the highest resolution possible as well as to establish a baseline for repeat surveys, great care was taken to minimize positioning uncertainty. Positioning for the survey was undertaken using both inertially aided real-time differential global positioning system (DGPS) and postprocessed kinematic GPS. Real-time positioning and vessel motion were tracked using a POS-MV
135
v.3 (Applanix Corp., Richmond Hill, ON, Canada) inertial motion sensor with two Novatel OEM-3 GPS (Novatel, Calgary, AB, Canada) receiver cards. Kinematic positioning information was collected by two Ashtech Z-12 receivers and one Trimble MS750 receiver on the survey vessel, as well as two Ashtech Z-12 receivers and one Trimble MS750 receiver located at control points on Martha's Vineyard. All kinematic GPS data were logged with GRIM and processed with DYNAPOS software from the XYZs of GPS, Inc., Dickerson, MD. Shore station data were converted to RINEX format and uploaded to the National Oceanic and Atmospheric Administration (NOAA, Washington, DC), online positioning user system (OPUS1) to establish the precise position of the base stations. The positional uncertainty associated with the kinematically postprocessed data was on the order of 10-20 cm. In addition to the DGPS and kinematic GPS, positional control for repeat surveys also was achieved through the emplacement by divers of 5 "fiducial" markers. These markers were 20-cm octahedral-shaped retroreflectors mounted on 2-m-long pipes and jetted into the seafioor by divers. The retroreflectors stood about 1 m above the seafioor and were designed to be clearly identifiable sonar targets that could be used to register repeat surveys. Comparisons of the fiducials between surveys indicated a positional uncertainty that was on the order of less than 1 m. Comparisons of absolute depth measurements made between surveys were limited by the determination of tide resulting in a between-survey vertical accuracy of approximately 5 cm. C. Surveys Four multibeam sonar surveys were conducted at the MVCO mine burial site between July 2002 and April 2004. The first survey (July 13-18, 2002) was conducted using the SAIC, San Diego, CA, vessel Ocean Explorer, a 60-ft vessel outfitted with a hull-mounted Reson 8125, an Applanix POS-MV attitude sensor and positioning system, and a Brooke Ocean Technology, Dartmouth, NS, Canada, moving vessel profiler (MVP)-30. Before the survey, the sonar system was carefully surveyed in to ensure precise alignment and then calibrated using standard "patch test" procedures [7]. As discussed earlier, this initial survey took place before the initiation of the ONR mine burial experiment and was designed to provide a regional context for the selection of deployment sites for the mines and the instruments. To provide the regional context, an approximately 3 x 5-km2 area surrounding the MVCO node was surveyed, but at differing levels of resolution. In a small 100 x 400-m2 region directly surrounding the MVCO node, we conducted a super high-resolution (4-m line spacing) survey. Over the 1 x 1-km2 area beyond the super high-resolution survey box, we conducted a slightly lower resolution survey (12-25-m spacing, depending on water depth) and, finally, a lower resolution survey (25^0-m line spacing, depending on water depth) in a 3 x 5-km2 region surrounding the 1 x 1-km2 box (Fig. 1). Water depths in the large survey area ranged from 6.9 to 18.5 m. The nominal survey speed was 5 kn with the sonar ping rate set to at least 11 Hz. The high-repetition rate combined with 'http://www.ngs.noaa.gov/OPUS/
IEEE JOURNAL OF OCEANIC ENGINEERING, VOL. 32, NO. 1, JANUARY 2007
136
relatively slow survey speed assured that there would be significant overlap of pings in the along-track direction; the 120° swath width (resulting in coverage of 3.5 times water depth) assured that there was significant overlap in the across-track direction. Sound-speed profiles were collected once per hour using the MVP-30; a Seabird conductivity-temperature-depth (CTD) probe was used at the beginning and end of each day to check the calibration of the MVP-30. Tide control for this survey had to be established from the NOAA tide station at Newport, RI (station number 8452660) with zoning from the NOAA Center for Operational Oceanographic Products and Services (CO-OPS) as the tide instrument at the MVCO site had been removed for maintenance during our survey. After the deployment of the instrumented mines and minelike devices (September 29 and October 1, 2003) [3], [6], three subsequent multibeam sonar surveys were conducted using the SAIC-contracted Loughrea Surveyor (October 2003, December 2003, and April 2004). The Loughrea Surveyor is a 10-m-long rigid hull inflatable boat (RHIB) designed specifically for surveying. As with the Ocean Explorer, a Reson 8125 multibeam sonar was hull-mounted on the Loughrea Surveyor, surveyed in, and calibrated with standard patch-test procedures [7]. The Loughrea Surveyor was also outfitted with multiple GPS antennas (for kinematic GPS positioning) but did not carry an MVP-30. Sound-speed data was provided by a Seabird CTD deployed at least once every 3 h or more often if the data indicated a sound-speed problem. The three post-mine-deployment surveys focused on a 0.8 x 1.5-km2 box centered around the MVCO node with water depths ranging from 9 to 13 m. This area included all mine-deployment locations and covered seafloor of various types (see Section III-A). Line spacing for each of these surveys was 10 m. Given that the Reson 8125 multibeam sonar has an opening angle of 120° (a swath width of approximately 3.5 times the water depth) there was significant overlap in the across-track direction providing the ability to give the higher quality, near-nadir beams, higher weight during the gridding process. As with the Ocean Explorer, surveys with the Loughrea Surveyor were conducted at 5 kn using ping rates of at least 11 Hz which assured significant ping-to-ping overlap in the along-track direction. Meteorological conditions (including wind speed and direction) in the survey area were monitored continuously throughout the deployment of the instrumented mines and each of the postmine-deployment multibeam sonar surveys by an instrumented tower located on the beach and operated by the MVCO. Significant waveheights were calculated from pressure spectra measured by a Nortek vector acoustic Doppler velocimeter (ADV. Nortek, Rud, Norway) located on the MVCO node [6]. Tide and current information for the three post-mine-deployment surveys were from direct measurement at the MVCO node and downloaded from the WHOI MVCO website.2 D. Data Processing Multibeam sonar data were acquired onboard the survey vessels using SAIC's ISS-2000 data acquisition system. Despite the tremendous data rates (more than 1 GB of data per 1 h), 2
http://www.whoi.edu/mvco/data/oceandata.html
preliminary quality control and cleaning were performed onboard. Data were recorded in generic sensor format (GSF) and postprocessed using CARIS HIPS (CARIS, Fredericton, NB, Canada) and Interactive Visualization Systems (IVS, Fredericton, NB, Canada) Fledermaus software packages. Postprocessing included editing and cleaning and resolving position, tide, sound speed, and vessel attitude problems. Once cleaned, the data were gridded using a weighted mean gridding filter. The very high lateral resolution of the multibeam sonar justified gridding with a pixel resolution of 10-15 cm, however, this level of resolution was only used to examine relatively small areas of the seafloor because the production of a 10-cm grid for the entire survey area would generate file sizes in the excess of 25 GB. Gridded data sets were rendered into 3-D images and interactively explored using the IVS Fledermaus software. The grid resolution used for each of the images displayed is reported in Figs. 2,3,6, and 7. All depths reported are referenced to mean low lower water (MLLW). For the October 2003 survey, positioning data were postprocessed by Applanix for kinematic corrections. This processing involved producing a navigation solution in single frequency carrier phase mode without fixing integer ambiguities. Estimated uncertainty for this navigation is on the order of 10-20 cm. III. RESULTS AND DISCUSSION The objectives of the mapping program involved two scales of mapping. At the local-regional scale, the objectives were to provide basemaps that could be used to determine the optimal locations for the deployment of seafloor instruments and mines and, then, to provide snapshots of changes in morphology over the course of the experiment. At the finest resolution scale, the objectives were to determine if ripple-scale features could be mapped and if the degree of burial of mine-like objects could be determined. A detailed description of the morphology of the MVCO survey area, speculations on the origin and evolution of this morphology based on the integration of numerous sensors (multibeam sonar, sidescan, sonar, subbottom profiling), and direct sampling are presented in [5]. Here, we briefly discuss changes in the bathymetry between July 2002 and April 2004 but focus most of our analysis on the high-resolution aspects of the mapping. A. Regional Setting and Changes in Overall Morphology The seafloor near the MVCO is dominated by a series of shore-perpendicular features of alternating coarse (median diameter typically > 400 p,m) and fine (median diameter typically < 225 ^m) sand that are tens to hundreds of meters wide and extend up to several kilometers offshore perpendicular to the shoreline (Fig. 2). They have been referred to as either "ripplescour depressions" [8] or "sorted bedforms" [5], [9] and have complex, geometric, bathymetric, and grain-size relationships. In general, the features are asymmetric with the coarsest grain size and deepest bathymetry on the western side of the coarsegrained zones and the transition from coarse to fine-grained sediment typically marked by a bathymetric step of 30-50 cm (Figs. 2 and 3). High-resolution subbottom profiling and coring [5] indicate that in between the coarse-grained zones, the finegrained sediment is a 15-50-cm-thick layer that overlies the
MAYER el at.: HIGH-RESOLUTION MAPPING OF MINES AND RIPPLES AT THE MVCO
July 2002
December 2003
i
N
137
October 2003
April 2004
Fig. 2. Overview of bathymetry of 0.8 x 1.5-km2 area around the MVCO node from Reson 8125 multibeam sonar showing shore-perpendicular "rippled scour depressions" or "sorted bedforms" at four points in time from July 2002 to April 2004. Bathymetry is gridded at 50-cm intervals. Depth range in this area is from 8.5 (red) to 13.5 m (dark green). Star marks location of MVCO node in 12 m of water. "C" indicates coarse-grained zone; "F' denotes fine-grained zone. The color map and resolution are the same in all images thus differences in depths and apparent sharpness of features are real. Ellipses show area of "horn-shaped" bathymetric feature discussed in text. The roughness of the boundary is greatest in October with marked smoothing observed in the subsequent December survey. This may be additional evidence for rapid response of the system (i.e., days) because the October survey was conducted one day after a large storm and the December survey was conducted four days after a large storm event.
Fig. 3. Detailed bathymetry (15-cm grid) near MVCO node during July 2002 survey. Node and fiducial are located in fine-grained sediment zone. Note chaotic medium scale bedforms developed particularly well north of the MVCO node site and the bathymetric step (about 40 cm down) into the coarse-grained zone characterized by small, orbital-scale ripples. The profile in the lower image corresponds to the white line in the upper image. The east-west asymmetry of the scour pit around the node (deeper on the eastern side) is opposite in sense to that of the RSDs (which are deeper on the western side).
nx
coarse sand and is not present in the coarse-grained zones. The boundaries between the coarse-grained and fine-grained zones are easily discernable as contrasts in sonar backscatter with high backscatter often corresponding to the larger scale ripples associated with the coarsest grained sediments [5]. The MVCO instrumented node was located in the middle of an approximately 140-m-wide fine-grained sediment zone between two coarse-grained zones of equivalent width (Figs. 2 and 3). As observed by towed sidescan sonar, rotary sidescan, and the multibeam sonar, the coarse-grained zones are characterized by small (5-25-cm amplitude, 50-125-cm wavelength) orbitalscale bedforms (i.e., ripples that have wavelengths that scale directly with the wave orbital diameter) while the fine-grained zones often show very small scale (2-5-cm amplitude, 15-cm wavelength) anorbital ripples (ripples whose wavelengths depend only on grain size) [10], [6]. During the July survey, the fine-grained zones also showed medium scale (8-15-cm amplitude, 3-10-m wavelength) bedforms with a chaotic, hummocky arrangement (Fig. 3). While much more chaotic in appearance than the smaller scale ripples, these medium scale bedforms are generally asymmetric (steeper side facing east) and aligned with their crests perpendicular to the shore and, thus, may be related to shore-parallel currents; they were not seen during any of the other surveys. With the exception of the transient nature of the medium scale bedforms in the fine-grained zones, the general characteristics of the regional morphology described previously remained relatively constant over the period from July 2002 to April 2004. In the 1.5 x 0.8-km2 area displayed in Fig. 2, seven coarse-grained zones are separated by fine-grained regions. This basic structure remains relatively constant at the snapshots in time recorded by the multibeam sonar from July 2002 to April 2004 with changes only in the details of the boundaries between the coarse and fine zones and small changes in their width. There are much smoother boundaries in July and April than in October or December and the October boundary, immediately following a storm, is rougher than the December boundary several days after a storm. While there can be little doubt that the changes that take place are complex and may vary in detail over the study area [5], a general idea of the nature of the temporal change in these boundaries may be gained from tracing the movement of a clearly defined morphological feature. To explore the nature of the movement of the coarse-grained/ fine-grained zone boundary we focus on a readily identifiable feature—a "horn shaped" westward extension of the fine-grained zone into the coarse-grained zone located approximately 200 m northwest of the MVCO node (Figs. 2 and 4). In July 2002, the boundary between the coarse and fine-grained zones near the "horn" is rather smooth but, in October 2003, the boundary is complexly scalloped and has shifted approximately 20 m to the northeast (bearing 020°; Figs. 4 and 5). Fig. 4 also reveals that, in the October snapshot, small windows of coarse-grain sediment appear within the fine-grained zone and the width of the zone decreases. These areas of localized removal of the fine-grained sediment will be discussed in more detail in Section III-B. Between the October and the December snapshots the boundary has moved approximately 30 m to the northwest (bearing 345°; Figs. 4 and 5) and the boundary has
IEEE JOURNAL OF OCEANIC ENGINEERING. VOL. 32, NO. 1. JANUARY 2(107
become much smoother, though still more complex than in July. By April 2004, the boundary has shifted approximately 15 m to the northeast (bearing 020°; Figs. 4 and 5) and is even smoother than it was in July. The relative movement of the boundary coincides with the predominant wave direction during the same interval. The change between July and October reflects the dominant fair-weather wave direction [from the southwest (SW)] [3], [4], [6], the change between October and December reflects the dominant storm wave direction [from the south (S) to south-southeast (S-SE)] [3], [4], [6] and the change between December and April again matches the fair-weather wave direction (from the SW). The eastern boundary of the coarse-grain to fine-grain transition appears to remain fairly constant in position with the exception of the October snapshot. Given the general north-south (N-S) orientation of the boundaries, changes in the position of boundaries in response to onshore wave conditions are difficult to discern and, thus, we have focused on an east-west (E-W)-oriented section of the boundary. It is clear however, that during the October survey, the eastern boundary shifted about 20 m to the west, became significantly more complex (less smooth), and the zone became narrower than any time before. We attribute this to the removal of fine-grained sediment in response to storm wave conditions, the same conditions that are responsible for the erosional "windows" revealing coarse-grain sediment in many areas of fine-grained sediment. While we discuss changes in the position of the fine-grained/ coarse-grained boundary between discrete snapshots in time, this does not imply that there has been a continuous shift in the position of the boundary over the time interval between these snapshots. Indeed, we will present evidence below that the change of orientation of smaller scale features (ripples and erosional patches) is very rapid (hours to days). If this were the case for the zonal boundaries, then the October survey (which was only one day after a severe storm—see Fig. 8) should show a shift to the north-northwest (N-NW). Instead, it shows a shift more representative of the fair-weather waves that dominate the pre-October period. Thus, while the general position of the coarse- and fine-grained zones remains relatively constant over long periods of time (at least 1.5 years in our case) the boundaries between the zones appear to respond over periods of days to months to the predominant wave direction and energy with smoothing and small shifts to the northeast during fair-weather wave conditions and greater complexity and roughness, erosion, and shifts to the N-NW during storm conditions. B. Ripple-Scale Resolution The dynamically focused Reson 8125 multibeam sonar combined with advanced processing and visualization techniques proved to be an excellent tool for mapping ripples. When single, gridded lines are displayed (eliminating any positional uncertainty between lines), ripples with amplitudes as small as 2 cm were easily discerned (Fig. 6). These small orbital-scale [4] ripples were restricted to the coarse-grained zones. During the July 2003, December 2003, and April 2004 surveys, the orbital-scale ripples heights were typically 8-12 cm with wavelengths of approximately 65-75 cm while, during the October survey, the
MAYER el at.: HIGH-RESOLUTION MAPPING OF MINES AND RIPPLES AT THE MVCO
139
July 2002
Oct. 2003
Dec. 2003
April 2004
Fig. 4 Position of "horn"—westward protrusion of fine-grained sediment zone into coarse-grained zone and the eastern boundary of the fine-grained coarsegrained boundary at four points in time between July 2002 and April 2004. Resolution of each image is identical, therefore, changes in apparent roughness (or sharpness) of image are real. Scalloping superimposed on images are small scale (1-2 cm) heave artifacts.
ripples showed amplitudes of 15-20 cm and wavelengths of approximately 1 m (Figs. 6 and 7). The height-to-wavelength ratio of these ripples is consistent with both theoretical and empirical predictions for orbital-scale ripples [10]. Most significantly, the orientation of the ripples changes from approximately east-southeast (E-SE, 110°)-west-north west (W-NW, 290°) during July, December, and April to approximately east-northeast (E-NE, 80°)-west-south west (W-SW, 260°) during October (Figs. 6 and 7). As mentioned earlier, the fine-grained zones showed medium scale (3-10-m wavelength, 8-15-cm amplitude), chaotic hummocky bedforms only during the July survey, though very high-resolution rotary fan beam
(2.5 and 1.3 MHz) and pencil-beam (975 kHz) sonars revealed very small scale (15-cm wavelength) anorbital ripples in the fine-grain sands [3], [4]. The multibeam sonar cannot resolve these very small anorbital ripples because their lateral extent is much lower than that of the orbital-scale ripples or medium scale bedforms; the lateral resolution of the multibeam sonar is at best 10 cm at nadir degrading towards the outer beams. The change in orientation of the ripples is once again directly related to the differences in the prevailing wave direction. During the July, December, and April surveys, the ripple crests are oriented orthogonal to the prevailing fair-weather wave direction and during the October survey the ripple crests are ori-
IEEE JOURNAL OF OCEANIC ENGINEERING. VOL. 32. NO. I, JANUARY 2007
14(1
July 02 •» Oct. 03 -» Dec. 03 •»
Oct. 03 Dec. 03 April 04
020 deg 345 deg 020 deg
57 m
Predominant wove direction: From 5W - fair weather From S-SSE - during storms
April 2004 July 2002
v
Dec. 2003
Oct. 2003
Fig. 5. Changes in position of "the horn" at the western boundary between fine-grained and coarse-grained zones between the four surveys conducted between July 2002 and April 2004. Pink arrows represent change vector. The E-W-oriented "horn" appears to change with the prevailing wave direction while the N-S-oriented sectors of both boundaries vary in a less systematic manner though there is a general trend of the fine-grained zone becoming narrower during the stormier periods.
ented orthogonal to the prevailing storm wave direction. These observations are consistent with the direct observation of environmental conditions from sensors at the MVCO node which show that oceanographic forcing is dominated by waves from southerly directions with waveheights typically largest from October to March [3], [4]. The largest storms observed during the experiment had significant waveheights of 3-4 m (at the node site in 12 m of water) with near-bed orbital velocities of having peak values of 150-180 cm/s and root-mean-square (rms) velocities of 50-70 cm/s [3], [4]. Associated with the change in orientation of the ripples in October is a marked change in the position of the bathymetric step associated with the transition between the fine-grained and coarse-grained sediment (about 20 m to the west). The location of this boundary returned to near its original position for the December and April surveys although a vestige of the old boundary can still be seen in the bathymetry (Fig. 7). The alignment of the small scale bedforms with the prevailing wave conditions appears to occur rapidly (on the order of hours or days) when the wave conditions exceed the threshold of sediment motion (most of the time) [3] and particularly during moderate storm conditions. Direct evidence for this is provided from
the results of rotary sidescan sonar observations [3], [4], and indirect evidence is provided from our multibeam sonar observations. The response of small scale bedforms and larger features to the prevailing wave conditions is clearly indicated in the erosional "window" seen behind the MVCO instrumented tower (Figs. 7 and 8). The "window" represents a small area where the surficial sediments of the fine-grained zone were removed in the wake of the tower, exposing the coarse-grained sediments below. The implication is that turbulence shed by the tower has created a small zone in which the threshold for motion for the fine-grained sediment is exceeded. The exposed coarse-grained sediments have been molded into orbital-scale ripples with the same orientation as those in the coarse-grained zone to either side of the tower [ripple scour depressions (RSDs)]. In the October survey (the first time these "windows" appear), the window is oriented parallel to, and the bedforms transverse to, the prevailing storm wave direction (from the S-SSE; Figs. 7 and 8). Measurements made at the MVCO node [3], [4], [6], indicate that there was a storm with peak orbital velocities of 80-90 cm/s one day before the survey (Fig. 8). The December survey also shows a less well-defined coarse-grain window shoreward of the tower, however, in this case, the ori-
MAYER etui.: HIGH-RESOLUTION MAPPING OF MINES AND RIPPLES AT THE MVCO
141
October 2003
December 2003
Fig. 6. Details of multibeam sonar data from coarse-grain ripple field in (a) October 2003 and (b) December 2003. Data gridded at 10 cm and displayed as average height in gridded bin. Profile below each sonar image is region under white line. Scale lines in October profile are 5 cm apart; scale lines in December profile are 1 cm apart. Average ripple height in gridded October profile is 10-15 cm with an average wavelength of approximately 1 m; average ripple height in gridded December profile is 3 cm with and average wavelength of approximately 65-70 cm. The process of gridding results in an average bin depth that is less than the actual depth of many of the ripple crests. When the individual soundings are examined before averaging, the typical ripple heights during December were 8-12 cm and the typical ripple heights during October were 15-20 cm. The height-to-wavelength ratio of these ripples is consistent with both theoretical and empirical predictions for orbital-scale ripples [10].
entation of the window is coincident with the predominant fairwave conditions (from the SW); orbital ripples are present but much smaller and less clearly defined (Fig. 8). The December survey also shows a "vestigial" window north of the tower oriented nearly N-S. Unlike the October survey which took place one day after a significant storm event, the December survey was conducted on December 4 (Julian day 338), four days after a storm event that had peak orbital velocities of 95 cm/s (Julian day 334; Fig. 8). It is possible that the "vestigial" window
is indicative of a window that formed in response to an earlier storm. As orbital velocities decreased and the wave direction turned to and remained S-SW for some time, a new window formed oriented parallel to the new incoming wave direction. As wave velocities continued to decrease (they were on the order of 10 cm/s by the time of the December survey), fine-grained sediment once again began to accumulate north of the tower and both "windows" began to fill. In April, when peak orbital velocities were on the order of 20 cm/s and never exceeded
142
IEEE JOURNAL OF OCEANIC ENGINEERING. VOL. 32. NO. 1. JANUARY 2007
Fig. 7. Ultrahigh-resolution (10-cm grid) swaths across the fine-grained to coarse-grained zone transition. The MVCO node is the elevated object on the western (fine-grained zone) side of line. The change in orientation and amplitude of the ripples in the coarse-grained sediment is apparent in the October survey. The October survey also shows a shift in the eastern boundary of the fine-grained sediment zone of approximately 20 m toward the west. The December and April surveys show vestiges of the old boundary but the bathymetric step associated with the transition has clearly returned to near its July 2002 location. Two instrumented mines (AIM-3 and AIM-4) [6] are visible approximately 10 and 20 m to the southeast of the node. These mines were deployed a few days before the October 2003 survey (i.e., they were not present during the July 2002 survey) and were completely buried during the April 2004 survey.
40 cm/s, there is no evidence of the formation of erosional windows. If this interpretation is correct, it indicates the rapid (on the order of hours to days) response of both the "windows" and the orbital-scale ripples to changes in the predominant wave conditions. C. Direct Mapping and Identification of Mines As described in Traykovski et al. [4], [6], during the mine burial experiment, ten instrumented and six passive, noninstrumented, mines were deployed in both the fine- and coarse-grained sand zones surrounding the MVCO tower. Six of the instrumented mines were the Forschungsanstalt der Bundeswehr fur Wasserschall und Geophysik (FWG, Kiel, Germany) optical mines designed to measure heading, pitch, roll, and the percent of surface area buried [3]. The four other instrumented mines were NRL/Omni Technology-built (Stennis Space Center, MS) acoustically instrumented mines (AIMs) designed to measure the geometry of the scour pit along with heading, pitch, roll, and changes in mine elevation relative to a pressure sensor on the MVCO tower [11]. The noninstrumented passive mines were of various common mine shapes. The mines were deployed between September 29 and October 1, 2003 and the first postdeployment multibeam survey was conducted five days later on October 6. The survey could not be conducted
immediately after the deployment because of storm conditions in the area between October 2-5 (Fig. 8). Our ability to map, identify, and quantify the extent of burial of the mines deployed in the MVCO area exceeded our expectations. As described earlier, there was a storm immediately after the deployment of the mines in late September/early October (Fig. 8). In the fine-grained sands, this storm resulted in the development of scour pits around the mines and the reorientation of the mines within a day of their deployment [6]. The location, orientation, extent of burial, and type of each mine deployed in the fine-sand area is easily discernable in the multibeam sonar data (Figs. 9 and 10). Fig. 9 shows a broad-perspective plan view of a 3-D visualization of six mines (three FWG optical mines and three noninstrumented mine shapes) deployed in the fine-grained sand to the west of the MVCO tower. Even from this perspective, the presence of each of the mines is clearly evident. Several N-S-oriented erosional "windows" revealing coarse-grained sand with orbital-scale ripples can also be seen. These windows are similar to the one north of the MVCO tower indicating that small regions of local erosion can occur without the presence of a flow obstruction such as the MVCO tower. The erosional "bursts" that cause these windows may be indicative of the processes responsible for the initiation and maintenance of the RSDs. Just as the MVCO tower acts as a potential initiator of RSDs so can other man-made objects such as wrecks [ 12] or
MAYER el al.\ HIGH-RESOLUTION MAPPING OF MINES AND RIPPLES AT THE MVCO
'i* xirt ma»ac* a: outfit*
• 4 - - - i* m m
143
V » m v a a w«r
V
Fig. 8. Evolution of erosional "windows" in the wake of the MVCO tower and their relationship to wave conditions. The October survey on October 6, 2003 (Julian day 279) took place one day after a storm with peak orbital velocities of 80-90 cm/s. A well-formed window can be seen oriented parallel to the prevailing storm-wave conditions with orbital-scale ripples oriented transverse to the wave direction. The December 2003 survey was conducted four days after a storm with peak orbital velocities of 95 cm/s. At the time of the survey, there was a poorly defined window oriented parallel to the dominant fair-weather wave direction (from SW) with small transverse orbital-scale ripples. An N-S-oriented "vestigial" window can also be seen in the December 2003 survey, probably a response to an earlier storm. No indication of erosion is seen in the April survey.
natural objects like rocks [13]. Similarly, the presence of mines can have the same effect. A closer examination of the multibeam sonar data at each mine site reveals the remarkable detail that can be extracted (Fig. 10). For example, data from the area of the optical mine [Fig. 10(a)] shows the partially buried mine of proper dimensions (1.5 m long with 0.53-m diameter) in a scour pit. Even the taper on one side and the three rings of the optical sensors are evident. The partially buried MK82 tapered bomb [Fig. 10(b)] also shows its proper length (1.55 m) and the taper to one side; the diameter of the mine determined by the multibeam sonar (40 cm) is slightly larger than its actual diameter (27 cm) most likely due to the influence of neighboring cells on a small target during the gridding process. The Manta mine shape [Fig. 10(c)] shows very little evidence of scour around it; the multibeam sonar data clearly reveals the characteristic truncated cone shape of the Manta (even the lip at the base of the cone is visible) with the proper dimensions for the mine (1.06 m, including the base). The height measurement from the multibeam data is in close agreement with the 43-cm height reported for the Manta indicating little if any burial. The Rockan mine shape [Fig. 10(d)] shows a small amount of scour around it; the sonar data reveals the complex shape of the Rockan with dimensions that are
close to the actual dimensions of the Rockan (1.02 m long with 0.81 m). The maximum sonar measured height of the Rockan shape is approximately 25 cm, slightly less than the 38 cm reported for the Rockan, indicating that either the sonar missed the shoalest point on the mine or the mine is somewhat buried. In contrast to the ease of detection and identification of the mines in the fine-grained sands, the mines deployed in the coarse-grained sands were very difficult to detect during the October survey as their profiles were very similar to that of the orbital-scale ripples (Fig. 11). This observation is in complete agreement with the rotary sonar and modeling results of others that have shown that in the coarse-grained sands where large wave orbital-scale ripples are present, the mines bury by scour until they present roughly the same hydrodynamic roughness as the orbital-scale bedforms (10-15 cm) [6], [14]. D. Direct Measurement of Mine Burial The detail and coverage provided by the multibeam sonar along with the ability to render and visualize the sonar results in 3-D offer several approaches to measuring the degree of burial of the mines at the snapshots in time represented by the multibeam surveys. Trembanis et al. [ 14] have discussed various metrics associated with mine burial including the burial depth
144
IEEE JOURNAL OF OCEANIC ENGINEERING, VOL. 32. NO. 1. JANUARY 2007
Fig. 9. Plan view of the 3-D rendering of six deployed mines in fine-grained sand area to the west of the MVCO tower. Note the erosional "windows" revealing coarse-grained sand with orbital-scale ripples.
(C)
ul)
Fig. 10. Closeup 3-D views of multibeam sonar bathymetry over the (a) FWG optical mine, (b) tapered bomb, (c) inert Manta mine, and (d) inert Swedish Rockan mine.
MAYER etal.: HIGH-RESOLUTION MAPPING OF MINES AND RIPPLES AT THE MVCO
145
Fig. 11. Two NRL AIM mines in coarse-grained sediment zone.
Fig. 12. Estimating mine burial by measuring cross section on a 3-D surface. In the example from the October 2003 survey over AIM-4, in the finer grained sediment zone, the depth of the ambient seafloor is measured at 11.75 m and the depth of the top of the mine is measured to be 11.84 m (i.e., the mine is .09 m below the ambient seafloor). Given a mine diameter of 0.53 m, this results in a maximum scour depth of 0.62 m and a burial by depth (as defined by Trembanis et al. [14]) of 116.98%. In the example below, from the December survey over AIM-4, the depth of the ambient seafloor is 11.93 m and the depth of the top of the mine is 11.98 m (i.e., the mine is now 0.05 m below the ambient seafloor). Given a mine diameter of 0.53 m, the scour depth is 0.58 m and the burial by depth is 109%. Red areas show approximate shape and dimension of AIM mine.
below the ambient seafloor and the surface area buried (as percentages) [14]. Given the relatively large, 3-D, spatial coverage of the multibeam sonar, the depth of the "ambient seafloor" can be determined quantitatively through either a statistical examination of the seafloor surrounding the mine or through the construction of a profile (or several profiles) across the seafloor surrounding the mine site. Similarly, the depth of the scour pit
and/or the top of the mine can be measured directly through profiling across the scour pit or the mine (Fig. 12). In those situations where we know the dimensions of the mine we are mapping, a detailed multibeam sonar survey can provide a direct estimate of both the depth of burial below the ambient seafloor and the burial by surface area (to the limits of accuracy of the sonar system).
146
Using one of the AIM mines (AIM-4) deployed in the finer grained sand zone, as an example, the October multibeam sonar survey (one day after a storm event; Fig. 8) reveals the mine scoured deeply into a pit with the top of the mine 9 cm below the ambient seafloor depth (defined as 116% burial by depth using the definition of Trembanis [14]). As noted by Traykovski etal. [6], the mine has oriented itself in the scour pit with its long axis nearly perpendicular to the predominant incoming wave direction. The state of mine burial captured by the multibeam sonar in October is consistent with that revealed by the two-axes pencil-beam sonar [6] although the pencil-beam sonar produces a height estimate for the mine that is closer to 20 cm above the ambient seafloor level rather than the 9 cm below the ambient seafloor determined by the multibeam sonar. This discrepancy is because the sonar beam pattern has not been removed from the pencil-beam sonar record [6]. The burial by depth estimate for AIM-4 derived from the multibeam sonar is also in reasonable agreement with burial estimate made from the acoustic sensors on the mine but is significantly larger than the burial estimate predicted by a wave-induced scour model [14]. In comparison, the December survey of AIM-4 shows a less well-defined scour pit with some indication of infilling around the mine (Fig. 12). The top of the mine is now 5 cm below the ambient seafloor resulting in a burial of 109% by depth [14]. The December survey took place four days after a major storm event (Fig. 8) and the results of the multibeam sonar survey are consistent with the relatively rapid recovery and infilling processes observed by the rotary sonar [6]. As discussed in [6], the infilling process is a result of both an available pool of mobile sediment and the changes in the hydrodynamics (orbital wave velocities and tidally generated currents). The estimates of burial from the December multibeam sonar survey are also in good agreement with the measurements made by the AIM mines and with the wave-induced scour model [14]. In contrast to October and December, the April survey, which followed a long period of moderate wave conditions (Fig. 8), showed the mines to be completely buried (i.e., there was no indication of the mines in the multibeam sonar bathymetry). This result is also consistent with those from the rotary sonars and the sensors associated with the mines, the wave-induced scour model, and diver observations (there were no indications of the mines on the seafloor). The 3-D nature of the multibeam sonar data also allows the direct determination of the volume of the scour pit around a mine. This is demonstrated in Fig. 13, where a plane is fit to the ambient seafloor surface and, then, a difference surface is calculated between the plane and the region of the scour and mine. Using this technique, direct estimates of the volume of the scour pit can be produced. Finally, the 3-D nature of the multibeam sonar data allows for the direct visualization of the state of mine burial at the snapshot in time during which the survey takes place. In Fig. 14, a 3-D rendering of a mine is superimposed in the multibeam sonar data revealing an intuitive-looking depiction of the state of burial of the mine at the time of the survey. In this case, the view is from below the seafloor but with interactive 3-D exploration tools; the position of the mine relative to the seafloor can be viewed from any perspective. If a multibeam sonar were used to collected closely spaced, repeat surveys over the seafloor during a burial event (perhaps with an AUV), this
IEEE JOURNAL OF OCEANIC ENGINEERING, VOL. 32. NO. 1. JANUARY 2007
technique could be used to produce a realistic "movie" of the actual burial process, though the conditions associated with a burial event may make this approach challenging. IV.
SUMMARY AND CONCLUSION
High-resolution multibeam sonar in combination with stateof-the-art data processing and visualization techniques have been used to set the regional context and quantify the evolution of seafloor morphology and the extent-of-burial of instrumented mines and mine-shapes as part of the ONR mine burial experiment off Martha's Vineyard, MA. The area selected for the experiment was the site of the MVCO, where an instrumented tower deployed in 12 m of water provided real-time in situ environmental data as well as the ability to hard-wire mines and other instruments to shore-based facilities. Four surveys were conducted at the mine burial experiment site with a 455-kHz, Reson 8125 dynamically focused multibeam sonar over the course of two years. The initial survey (July 2002) was designed to provide a regional context for the experiment and to aid investigators in the selection of the appropriate sites for mine deployment. This survey was conducted at three scales of resolution with 25^0-m line spacing over a 3 x 5-km2 area around the MVCO node, 12-m line spacing over an area of approximately 1 x 1-km2 around the MVCO site, and finally, 4-m line spacing in a 100 x 400-m2 box immediately surrounding the MVCO node. All subsequent surveys (October 2003, December 2003, and April 2004) focused on an approximately 0.8 x 1.5-km2 box around the MVCO node and were conducted at 10-m line spacing. The multibeam sonar survey was ideal for regional reconnaissance as it provided a detailed picture of the distribution of changes in depth, sediment type (through its indication of surficial morphology), and bedforms in the area. The region is characterized by shore-perpendicular, alternating zones of coarse-grained sand with 5-25-cm high, shore-parallel, wave orbital-scale ripples (these large, shore-parallel features have been called RSDs [8] or "sorted bedforms" [5]), and zones of finer grained sands with smaller (2-5-cm high) anorbital ripples (not resolved by the multibeam sonar) and, on occasion, medium scale 10-20-cm chaotic, hummocky bedforms. Geophysical evidence and cores suggest that the finer grained sands are overlying coarser grained sands [5]. Based on these and other regional mapping results, ten instrumented and six passive, noninstrumented mines were deployed in both the fineand coarse-grained sand zones surrounding the MVCO tower. The repeat multibeam sonar surveys provided a detailed record of changes in the regional morphology over the time period of the experiment. With the exception of the transient nature of the medium scale bedforms in the fine-grained zones, the general characteristics of the regional morphology described previously remained relatively constant over the period from July 2002 to April 2004 (e.g., the basic structure of alternating shore-perpendicular zones of fine- and coarse-grained sands). There are, however, changes in the nature of the boundaries of these zones. The boundaries between the zones appear to respond over periods of days to months to the predominant wave direction and energy. Smoothing and small shifts of the boundaries to the NE take place during fair-weather wave
MAYER el at.: HIGH-RESOLUTION MAPPING OF MINES AND RIPPLES AT THE MVCO
147
Fig. 13. Determination of volume of scoured material by calculating the surface difference between a plane fit to the ambient seafloor depth and the surface defined by the scour pit and the mine. In this example (from AIM-4 in October 2003), the volume of material removed from the scour pit is 4.6 m3.
conditions while erosion (scalloping of the boundary) and shifts to the N-NW occur during storm conditions. The multibeam sonar was also able to resolve changes in the orientation of individual orbital ripples through the course of the repeat surveys. The change in orientation of the ripples were related directly to the differences in the prevailing wave direction. During the July, December, and April surveys, the ripple crests were oriented orthogonal to the prevailing fair-weather wave direction and during the October survey the ripple crests were oriented orthogonal to the prevailing storm wave direction. The alignment of the small scale bedforms with the prevailing wave conditions appears to occur rapidly (on the order of hours or days) when the wave conditions exceed the threshold of sediment motion (most of the time for the fine sands) and particu-
larly during moderate storm conditions. During storm events, erosional "windows" appeared in the fine-grained sands that were oriented parallel to the prevailing wave direction and revealed orbital-scale ripples that were oriented perpendicular to the prevailing wave direction. One of these erosional "windows" formed downstream from the MVCO tower and was probably the result of turbulent eddies shed by the tower but others were found in regions where there was no obstruction to the flow indicating that bursts of turbulence may be an initiating factor in forming of the RSDs. The multibeam sonar was also able to clearly locate and even identify individual mines and their state of burial in the finegrained sediment zones. The resolution of the multibeam sonar combined with 3-D visualization techniques provided realistic
I4S
IEEE JOURNAL OF OCEANIC ENGINEERING. VOL. 32. NO. 1, JANUARY 2007
Fig. 14. The 3-D rendering of mine shape in multibeam data set viewed from below the seafloor.
looking images of both the instrumented mines and mine shapes (including a Manta and Rockan shape) that were dimensionally correct and enabled unambiguous identification of the mine type. In two of the surveys (October and December 2004), the mines in the fine-grained sands scoured into a scour pit but were still perfectly visible and identifiable. These mines may not have been visible on standard, towed sidescan sonars as they were in scour pits below the ambient seafloor level. In the April 2004 survey, the mines were completely buried. In the coarse-grained sand zone, however, the mines were extremely difficult to detect once there had been scour in the region. This is because, in the coarse-grained sands where large wave orbital-scale ripples are present, the mines bury by scour until they present roughly the same hydrodynamic roughness as the orbital-scale bedforms (10-15 cm) [6], [14]. The result is striking and somewhat counterintuitive in that it demonstrates that the mines are more difficult to find in coarse, rippled sand zones, than they are in fine sand zones, even though they are less buried (in terms of depth below the ambient seabed) in the coarse sand. The detail and coverage provided by the multibeam sonar along with the ability to render and visualize the sonar results in 3-D offer several approaches to measure the degree of burial of the mines at the snapshots in time represented by the multibeam surveys. Given the relatively large, 3-D, spatial coverage of the multibeam sonar, the depth of the "ambient seafloor" can be determined quantitatively through a statistical examination of the seafloor surrounding the mine or through the construction of a profile (or several profiles) across the seafloor surrounding the mine site. Similarly, the depth of the scour pit and/or the top of the mine can be measured directly through profiling across the scour pit or the mine. With an a priori knowledge of the dimensions of the mine, both the depth of burial below the ambient seafloor and the burial by surface area covered can be determined. In the absence of a priori knowledge of the dimensions of the mine, the multibeam sonar can also provide an estimate (limited in accuracy by the resolution of the multibeam sonar
and the gridding process) of the dimensions of the mine. The 3-D nature of the multibeam sonar data also allows the direct determination of the volume of material removed from a scour pit around a mine through the calculation of a difference surface between the plane and the region of the scour and mine. Finally, the 3-D nature of the multibeam sonar data allows for the direct visualization of the state of mine burial at the snapshot in time during which the survey takes place. High-resolution multibeam sonar surveys combined with state-of-the-art 3-D visualization techniques have proven to be very useful tools for the exploration of regional morphology and the evolution of the seafloor in response to wave-induced sediment transport. This combination has also allowed for the direct detection and identification of a variety of mine types as well as the quantitative evaluation of their state of burial. With respect to understanding mine burial, the technique provides validation of data collected from instrumented mines and offers one of the only ways to collect remotely quantitative information about the state of burial at the time of the survey. When combined with other comprehensive field studies and modeling efforts, the multibeam sonar provides a unique perspective on the nature of the seafloor surrounding the mine deployment site and new insights into the mine burial process. ACKNOWLEDGMENT
The authors would like to thank the managers responsible for this program: R. H. Wilkens, D. Lavoie, T. Drake, and B. Almquist. They would also like to thank the captains and S AIC staff aboard the vessels Ocean Explorer and Loughrea Surveyor for their tremendous efforts to provide excellent services in very difficult weather conditions; M. McElroy for providing great assistance and support for the authors' work at the MVCO; R. Boyd of the University of Newcastle for his valuable guidance and insight; and B. Schwab and R. Thieler of the United States Geological Survey (USGS) Woods Hole for many useful discussions.
MAYER et at.: HIGH-RESOLUTION MAPPING OF MINES AND RIPPLES AT THE MVCO
REFERENCES [1] R. H. Wilkens and M. D. Richardson, "Mine burial prediction: A short history and introduction," IEEEJ. Ocean. Eng., vol. 32, no. 1, pp. 3-9, Jan. 2007. [2] T. C. Austin, J. B. Edson, W. R. McGilUs, C. von Alt, M. J. Purcell, R. Petitt, M. K. McElroy, J. Ware, and R. Stokey, "The Martha's Vineyard Coastal Observatory: A long term facility for monitoring air-sea processes," in Proc. MTS/1EEE OCEANS, Sep. 2000, pp. 1937-1941. [3] M. D. Richardson and P. Traykovski, "Real-time observations of mine burial at the Martha's Vineyard Coastal Observatory," in Proc. 5th Int. Symp. Technol. Mine Problem, Monterey, CA, May 22-25, 2002, CD-ROM. [4] P. Traykovski, M. D. Richardson, J. A. Goff, L. A. Mayer, R. Wilkens, and B. Gotowoka, "Mine burial experiments at the Martha's Vineyard Coastal Observatory," in Proc. 6th Int. Symp. Technol. Mine Problem, Monterey, CA, 2004, pp. 9-13. [5] J. A. Goff, L. A. Mayer, P. Traykovski, I. Buynevich, R. Wilkens, R. Raymond, G. Glang, R. L. Evans, H. Olson, and C. Jenkins, "Detailed investigation of sorted bedforms. or rippled scour depressions, within the Martha's Vineyard Coastal Observatory, Massachusetts," Continental Shelf Res., vol. 25, pp. 461^84, 2005. [6] P. Traykovski, M. D. Richardson, L. A. Mayer, and J. D. Irish, "Mine burial experiments at the Martha's Vineyard Coastal Observatory," IEEEJ. Ocean. Eng., vol. 32, no. 1, pp. 150-166, Jan. 2007. [7] G. E. Wheaton, "PATCH TEST. A system check for multibeam survey systems," in Proc. Hydrographic Conf., Baltimore, MD, Apr. 12-15, 1998, pp. 85-90. [8] D. Cacchione, W. D. Grant, and G. B. Tate, "Rippled scour depressions on the inner continental shelf of central California," /, Sedimentary Petrol., vol. 54, pp. 1280-1291, 1984. [9] A. B. Murray and E. R. Thieler, "A new hypothesis for the formation of large-scale inner-shelf sediment sorting and 'rippled scour depressions'," Continental Shelf Res., vol. 24, pp. 295-315, 2004. [10] P. Trakovski, A. E. Hay, J. D. Irish, and J. F. Lynch, "Geometry, migration and evolution of wave orbital ripples at LEO-15," J. Geophys. Res., vol. 104, no. Cl, pp. 1505-1524, 1999. [11] J. Bradley, S. Griffin, M. Thiele, Jr., M. D. Richardson, and P. D. Thorne, "An acoustic-instrumented mine for studying subsequent burial," IEEEJ. Ocean. Eng., vol. 32, no. 1, pp. 64-77, Jan. 2007. [12] A. C. Trembanis and J. E. McNinch, "Predicting scour and maximum settling depths of shipwrecks: A numeric simulation of the fate of queen Anne's revenge." in Proc. Coastal Sediments, Clearwater Beach, FL, 2003, CD-ROM. [13] T. Hume, A. C. Trembanis, S. Stephens, A. Hill, and R. Liefting, "Spatially variable, temporally stable, sedimentary facies on an energetic inner shelf," in Proc. Coastal Sediments, Clearwater Beach, FL, 2003, CD-ROM. [14] A. C. Trembanis, C. T. Frederichs, M. D. Richardson, P. Traykovski, P. A. Howd, P. A. Elmore, and T. F. Wever, "Predicting seabed burial of cylinders by wave-induced scour: Application to the sandy inner shelf off Florida and Massachusetts," IEEE J. Ocean. Eng., vol. 32, no. 1, pp. 167-183, Jan. 2007.
Larry A. Mayer received the B.Sc. degree in geology from the University of Rhode Island, Kingston, in 1973 and the Ph.D. degree in marine geophysics from the Scripps Institution of Oceanography, the University of California at San Diego, La Jolla, in 1979. Currently, he is a Professor of Earth Science and Ocean Engineering at the University of New Hampshire (UNH), Durham. NH, and is the Director of the Center for Coastal and Ocean Mapping and CoDirector of the National Oceanic and Atmospheric Administration (NOAAVUNH Joint Hydrographic Center. His main research interests are in seafloor mapping technologies, seafloor characterization, and applications of advanced visualization techniques to ocean mapping problems. Dr. Mayer is a member of the American Geophysical Union.
Richard Raymond received the B.S. degree from the University of Massachusetts Lowell, Lowell, in 1977 and the M.B.A. degree from the Worcester Polytechnic Institute, Worcester, MA, in 1984. From 2001 to 2004, he was enrolled in the M.Sc. program in ocean mapping at the University of New Hampshire (UNH), Durham, NH.
14')
Gerd Glang received the B.E. degree in electrical engineering from the State University of New York Maritime College, Throgs Neck, NY, in 1984. He joined the National Oceanic and Atmospheric Administration (NOAA) Commissioned Corps in 1989, where he is now a Commander of the Commissioned Corps. He has served aboard three of NOAA's hydrographic survey ships and in various ashore assignments supporting NOAA's nautical charting program. Currently, he is the Chief of the Hydrographic Systems and Technology Programs. NOAA Office of Coast Survey, Silver Spring, MD. His research interests are in the application of kinematic GPS for subdecimeter 3-D positioning in hydrographic surveying.
Michael D. Richardson received the B.S. degree in oceanography from the University of Washington, Seattle, in 1967, the M.S. degree in marine science from the College of Williams and Mary. Williamsburg, VA, in 1971, and the Ph.D. degree in oceanography from the Oregon State University, Corvallis, in 1976. He began working at the U.S. Naval Ocean Research and Development Activity, now part of the U.S. Naval Research Laboratory (NRL), Stennis Space Center, MS, in 1977. Except for a five-year assignment as a Principle Scientist at NATO's SACLANTCEN, La Spezia, Italy (1985-1989), he has worked at NRL as a Research Scientist and is currently the Head of the Seafioor Sciences Branch in the Marine Geosciences Division. His research interests include the effects of biological and physical processes on sediment structure, behavior, and physical properties near the sediment-water interface in both shallow-water coastal regions and in the deep sea. His current research is linked to high-frequency acoustic scattering from and propagation within the seafloor and prediction of mine burial. Dr. Richardson is a member of the Acoustical Society of America, the American Geophysical Union, the European Geophysical Society, and Sigma Xi.
^^^ 4p |^k w l^ „» 1
Peter Traykovski received the BSE. degree in mechanical engineering from Duke University, Durham, NC, in 1988 and the M.S./Engineers degree and Ph.D. degree in applied ocean sciences and engineering from the Massachusetts Institute of Technology/Woods Hole Oceanographic Institution Joint Program, Woods Hole, MA, in 1994 and 1998, respectively. Currently, he is an Associate Scientist at the Applied Ocean Physics and Engineering Department, the Woods Hole Oceanographic Institution. His main research interests are sediment transport dynamics on the continental shelf and in estuaries and developing instrumentation to measure these processes. Dr. Traykovski is a member of the American Geophysical Union.
Arthur C. Trembanis received the B.S. degree in geology and oceanography from Duke University, Durham, NC. in 1998 and the Ph.D. degree in marine science from the College of William and Mary, Virginia Institute of Marine Science, Gloucester Point, VA, in 2004. He completed a Fulbright Fellowship at Sydney University, Sydney, Australia, in 1999. He worked as a Lead Software Developer and Staff Geophysicist in the autonomous underwater vehicle (AUV) industry with Sias Patterson Inc., Gloucester Point, VA, before conducting a joint WHOI-USGS postdoctoral fellowship at the Woods Hole Oceanographic Institution. Currently, he is an Assistant Professor in the Department of Geology, the University of Delaware, Newark, and Founding Director of the Coastal Sediments, Hydrodynamics, and Engineering Laboratory (CSHEL) there. He has extensive experience in conducting and analyzing complex field studies from sites around the world. His research interests are in the measuring and modeling of coastal morphodynamics particularly beach erosion, beach nourishment, bedform behavior, and scour processes associated with seafloor objects including shipwrecks and mines.