RESEARCH ARTICLE
How does intrauterine crowding affect locomotor performance in newborn pigs? A study of force generating capacity and muscle composition of the hind limb Charlotte Vanden Hole ID1, Silke Cleuren ID1, Chris Van Ginneken1*, Sara Prims1, Miriam Ayuso1, Steven Van Cruchten1, Peter Aerts2,3
a1111111111 a1111111111 a1111111111 a1111111111 a1111111111
1 Laboratory of Applied Veterinary Morphology, Department of Veterinary Sciences, Faculty of Biomedical, Pharmaceutical and Veterinary Sciences, University of Antwerp, Wilrijk, Belgium, 2 Laboratory of Functional Morphology, Department of Biology, Faculty of Sciences, University of Antwerp, Wilrijk, Belgium, 3 Department of Movement and Sports Sciences, Faculty of Medicine and Health Sciences, Ghent University, Ghent, Belgium *
[email protected]
Abstract OPEN ACCESS Citation: Vanden Hole C, Cleuren S, Van Ginneken C, Prims S, Ayuso M, Van Cruchten S, et al. (2018) How does intrauterine crowding affect locomotor performance in newborn pigs? A study of force generating capacity and muscle composition of the hind limb. PLoS ONE 13(12): e0209233. https:// doi.org/10.1371/journal.pone.0209233 Editor: Antonio Gonzalez-Bulnes, INIA, SPAIN Received: August 28, 2018 Accepted: November 30, 2018 Published: December 14, 2018 Copyright: © 2018 Vanden Hole et al. This is an open access article distributed under the terms of the Creative Commons Attribution License, which permits unrestricted use, distribution, and reproduction in any medium, provided the original author and source are credited. Data Availability Statement: All relevant data are within the paper and its Supporting Information files. Funding: This work was supported by a special research fund of the Universiteit Antwerpen (grant number GOA-33927) to Peter Aerts and Chris Van Ginneken.
Intrauterine crowding (IUC) considerably influences postnatal traits in a polytocous species such as the pig. Previously, our group described how IUC affects locomotion during the piglet’s first days of life (until 96 h after birth). We noted a reduced motor performance in piglets with a low birth weight and low vitality (L piglets), compared to piglets with a normal birth weight and normal vitality (N piglets), indicating L piglets are unable to produce enough force. Our current study investigates whether this observed force deficit in L piglets is caused by a reduced force generating capacity in the muscles and/or a lower percentage of type II (fast-contracting) fibers. Volume and fiber length of the main extensor muscles of the hind limb were used to estimate the physiological cross-sectional area (PSCA) and hence calculate the maximal isometric force generating capacity (Fiso-max) of the hind limb. To check for developmental differences between the muscles of L and N piglets, Fiso-max was normalized to body weight (BW), thus yielding a dimensionless variable F’iso-max. To check for differences in muscle composition, m. vastus lateralis was stained immunohistochemically in order to determine the percentage of type II fibers through image analysis. Our results indicate that L piglets have a reduced absolute force generating capacity due to a lesser muscle mass, compared to N piglets. However, when normalized to BW L piglets actually show a larger force generating capacity, suggesting their muscles are more voluminous, given their body mass, than those of N piglets. However, no differences between L and N piglets were detected with regard to muscle composition of the m. vastus lateralis. Based on our data, we can say that neither normalized force generating capacity, nor muscle composition (of the m. vastus lateralis) can explain the observed force deficit in L piglets and as such the effect of IUC on locomotor performance.
Competing interests: The authors have declared that no competing interests exist.
PLOS ONE | https://doi.org/10.1371/journal.pone.0209233 December 14, 2018
1 / 18
Force generating capacity and muscle composition of the piglet hind limb
Introduction Polytocous species, such as the domestic pig (Sus scrofa domesticus), conceive large numbers of offspring. However, limited uterine space and placental area (and as such blood flow to the fetus) causes intra-uterine competition amongst the piglets. This (at least partially) explains why increased crowding in the uterus leads to (more) small piglets at birth [1, 2]. Although the wild boar (Sus scrofa [3]) is also a polycotous species, intrauterine crowding (IUC) and its effect are exacerbated in modern breeding sows that are genetically selected for producing extremely large litters (>14) [4]. As a consequence, heterogeneity in the offspring’s birth weight and an increased number of small piglets are observed [5]. Research already showed that IUC greatly influences postnatal traits in pigs [6–12]. Recently, our group described how IUC affects locomotion during the piglet’s first days of life [13]. In this study, spatio-temporal gait variables were compared between piglets with a normal birth weight and normal vitality (N piglets) and piglets with a low birth weight and low vitality (L piglets). Among other findings, we observed a reduced motor performance (measured by speed and its components stride length and stride frequency) in L piglets. To increase its performance, an L piglet would have to move its limbs more rapidly and reduce the time that its feet are in contact with the ground. However, to do this, the piglet’s muscles need to generate greater forces and contract more rapidly [14]. The observed inability to increase performance in L piglets suggests they are unable to produce enough force (thus showing a force deficit) and/or increase muscle contraction velocity. To unravel the underlying mechanisms through which IUC and its associated birth weight variability affect locomotion, the development of the musculoskeletal system and its control system as well as the energy available for locomotion, should be carefully studied. Some reports on the m. semitendinosus, already show that IUC results in smaller muscle cross-sectional areas and a lower number of myofibers [9, 12]. Nevertheless, the description of the musculoskeletal system in view of IUC and motor performance is far from complete. This study aims at helping to close the abovementioned gap by investigating whether the force deficit in L piglets is caused by a lower force generating capacity. To this end, muscle volume and fiber length are combined to estimate the physiological cross-sectional area (PCSA) and hence the maximal isometric force generation capacity. Given their lower body mass (BM), it would make sense that L piglets are more slender (i.e. less muscular) than N piglets. However, they might also be overall smaller (i.e. have shorter legs) than N piglets. Therefore, hind limb length is considered in addition to BM and body mass index (BMI). We propose that a developmental delay of the motor performance of L piglets is linked to a lower relative (to size) force generating capacity for L piglets when compared to N piglets. However, it is important to keep in mind that muscle architecture and force transmission are complex and cannot be described using gross dissection alone [15]. The observed force deficit in L piglets might as well be caused by a different fiber composition of the muscle, compared to N piglets. To that end we investigate the composition of the m. quadriceps femoris (m. vastus lateralis) by immunohistochemical fiber typing. Studies on humans [16– 18] and rats [19–21] have clearly described a relation between maximum force produced by a fiber and its type, with type II fibers being able to produce more force than type I. As both main types of muscle fibers (type I and II; for a review on fiber types see [22]) have their specific properties (i.e. slow-twitch oxidative and fast-twitch, respectively) and their abundance is largely (though not entirely) determined in utero (for a review see [11]), we expect the composition of the muscle to be different in L and N piglets. As such, we believe a lower percentage of type II (fast contracting) fibers in L piglets to be the cause of the observed force deficit.
PLOS ONE | https://doi.org/10.1371/journal.pone.0209233 December 14, 2018
2 / 18
Force generating capacity and muscle composition of the piglet hind limb
By investigating both force generating capacity and muscle composition, this study may help to explain the earlier observed differences in locomotion between L and N piglets, more specifically the apparent force deficit in L piglets. As such, this paper addresses the following questions: • Do L piglets have shorter legs than N piglets? In other words, are L piglets only more slender (lower BM and BMI) or are they overall smaller (lower BM, BMI and shorter limb lengths)? To answer this question the BM, BMI and the skeletal hind limb length (SHLL) were measured. We hypothesize that L piglets have a lower BM and BMI and a shorter SHLL than N piglets (both at birth and during early development), indicating they are not only more slender (as indicated by the BM and BMI), but are also overall smaller (i.e. have shorter legs, indicated by the SHLL). • Is there a difference in absolute force generating capacity between L and N piglets? We hypothesize a smaller PCSA for L piglets (because of their smaller size) leading to a reduced absolute force generating capacity both at birth and during early development. To this end, we calculated the maximal isometric force generating capacity (Fiso-max) of the hind limb. • Is there a difference in normalized (or relative) force generating capacity between L and N piglets? We hypothesize a smaller PCSA relative to body weight (BW = BM x g; g = 9.81 ms-2), indicating a developmental retardation of L piglets’ muscles, both at birth and during early development. Accordingly, the maximal isometric force generating capacity of the hind limb is normalized to BW, thus yielding a dimensionless variable indicating normalized force generating capacity (F’iso-max) of the hind limb. • Is there a difference in muscle composition between L and N piglets? We hypothesize a lower percentage of fast contracting (type II) fibers in the muscles of L piglets. To this end, we calculated the ratio of type II muscle fiber to total muscle fiber (Ftype II/ Ftotal), the ratio of type II muscle fiber to total muscle tissue (Ftype II/ Ttotal) and the ratio of total other tissue to total muscle tissue (Tother/Ttotal) in m. vastus lateralis.
Material and methods Selection Institutional and national guidelines for the care and use of animals were followed and all experimental procedures involving animals were approved by the Ethical Committee of Animal Experimentation, University of Antwerp, Belgium (approval number 2015–26). Thirty-two piglets (Topigs x German Piètrain) were selected from 10 litters in a local farm in October 2016. The mean number of piglets born per litter was 18.2 (± 4.2) (mean ± SD, here and throughout). Between 2 and 6 healthy piglets were selected per litter, in sex-matched (both piglets being male and both piglets being female) pairs of L and N piglets (for an overview of the selected piglets see Table 1). Selected piglets were ear-notched upon selection and remained with the sow for the entire studied period. Because of large between-litter variation in BM at birth and to be able to refer to our study on spatio-temporal gait variables, the same selection procedure was followed as in [13]. All piglets from the abovementioned 10 litters were weighed immediately after birth to calculate the mean BM at birth per litter. In addition, a vitality score was given to each piglet, based on respiration (0–2, no to regular respiration) and locomotion (0–2, no movement to taking a few steps). Piglets scoring 1 or 2 (out of 4) were considered to be low in vitality, while piglets that scored 3 or 4 were considered to have a normal vitality.
PLOS ONE | https://doi.org/10.1371/journal.pone.0209233 December 14, 2018
3 / 18
Force generating capacity and muscle composition of the piglet hind limb
Table 1. Selected piglets, including category (N or L piglet), age (0, 4, 8 and 96 h) and sex. Age
N piglets
L piglets
Total
Male
Female
Male
Female
0
2
3
1
3
9
4
2
2
2
2
8 8
8
2
2
2
2
96
2
2
1
2
7
Total
8
9
6
9
32
https://doi.org/10.1371/journal.pone.0209233.t001
Combining BM and vitality at birth allowed us to classify piglets into L (n = 15) and N piglets (n = 17). The latter piglets had both a normal vitality and a BM at birth within the limits of the mean BM at birth of the litter at birth ± 1 SD. L piglets, on the other hand, had a BM at birth that was lower than the mean BM of the litter– 1 SD, combined with a low vitality score. The mean BM at birth of the L piglets was 0.79 kg (± 0.26), compared to 1.37 kg (± 0.29) for N piglets. This study focused on 4 time points in early development: 0, 4, 8 and 96 h after birth. In our earlier studies [13, 23], we found 0, 4 and 8 h after birth to be important in the locomotor development of the young piglet. Within 4 h after birth all spatio-temporal gait variables seemed to reach stable (i.e. mature) values, while the variability of the gait pattern (indicated by left-right symmetry) led to a stable gait pattern within 8 h after birth [13, 23]. Consistent with these former studies, 96 h after birth was chosen as a reference age (control). Though still being within the time frame of early development, at this age piglets seem to show an adult gait pattern with minimal variation. In addition, this is a particularly relevant age in early development, with mortality rates being highest during the first 3 days of life [7, 24]. For each developmental stage we aimed at including 8 piglets with an equal distribution of L piglets/N piglets and females/males. However, one male L piglet that was assigned to the 96 h group died before reaching this age. In addition, our selection procedure posed some challenges with regard to the 0 h group. For one euthanized N piglet at 0 h, there was no L piglet littermate within the litter. Thus another couple was selected, leading to 5 N piglets and 4 L piglets of which 3 males and 6 females, being included in the 0 h group.
Sampling The selected piglets were deeply anesthetized with a combination of Zoletil 100 (Tiletamine 50 mg/ml, Zolazepam 50 mg/ml) and Sedaxyl (Xylazine hydrochloride 20 mg/ml), in a dosage of 0.22 ml/kg BM (administered intramuscularly). Euthanasia of the anesthetized animals took place by transecting the jugular veins and carotid arteries. Immediately after euthanasia, the hind quarter was dissected behind the floating ribs. An important reason to choose the hind limb is that the pelvic anatomy of cursorial quadrupeds appears to be specialized to provide force and to achieve a high power output, creating the (main) horizontal (acceleratory) impulses necessary for forward movement (e.g. [25–27]). In addition, most studies regarding muscle composition (see Introduction) studied the hind limb, which facilitates comparison. All right legs were frozen at -18˚C awaiting dissection. The left hind limb was used for taking tissue samples. For fiber typing, a tissue sample was taken from the proximal part of the m. vastus lateralis (the lateral part of m. quadriceps femoris) of the left hind limb and fixated for 24 h in 4% paraformaldehyde solution (in 0.01 M phosphate-buffered saline solution (PBS), pH = 7.4) at room temperature (± 21˚C). After fixation, tissue samples were rinsed with PBS and further processed for paraffin embedding. The m. vastus lateralis is a parallel-fibered
PLOS ONE | https://doi.org/10.1371/journal.pone.0209233 December 14, 2018
4 / 18
Force generating capacity and muscle composition of the piglet hind limb
muscle that originates laterally, proximally on the femur, converges with the other muscular parts of the m. quadriceps femoris and inserts indirectly via the patella tendon onto the proximal tibia. This muscle was chosen because it is a major extensor of the knee. In addition, its lateral position allowed for a quick and accurate sampling.
Muscle dissection We chose to focus on the most important extensors of the hind limb, because they generate the necessary force for support against gravity as well as for propulsion [27]: the hamstrings (m. semitendinosus, m. semimembranosus and m. biceps femoris), mm. glutei (consisting of the m. gluteus superficialis, medius, accessorius and profundus), m. quadriceps femoris (consisting of m. rectus femoris, m. vastus lateralis, m. vastus intermedius and m. vastus medialis), and m. gastrocnemius. The hamstrings and mm. glutei are the main extensors of the hip, while the m. quadriceps femoris is the main extensor of the knee and the m. gastrocnemius of the tarsal joint. After careful consideration, the extensors of the digits (m. extensor digitorum longus, m. extensor digitorum brevis and m. extensor digitorum lateralis) were not included in the force calculations. Their size did not allow for an accurate macroscopic measurement (cf. [28]) of the fiber length, so including them would have introduced a larger error. Additionally, because of their small size, their contribution to the total force generating capacity of the hind limb would have been minimal, compared to the other extensors. Before dissection, right hind limbs (in a sealed plastic bag) were defrosted in water of ± 38˚C. After removal, the abovementioned muscles were temporarily stored in PBS. Each muscle (or muscle bundle, if relevant) and the remaining hind limb skeletal structure were weighted individually (Sartorius BP 210 S, d = 0.1 mg).
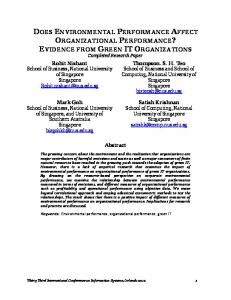
Fiber length The abovementioned muscles (or muscle bundles) were cut along the line of the tendon to reveal the orientation of the fascicles [29]. To enhance visualization of the individual fibers, sodium hypochlorite (NaClO) was applied to the surface of the muscle, hence removing the connective tissue between muscle fibers [30]. To improve the contrast between the fascicles and the connective tissue, the muscles were stained with Lugol’s solution (iodine 1.0 gm, potassium iodide 2.0 gm, distilled water 100 ml) [30, 31]. Afterwards, muscles were photographed with a Nikon D7000 (AF Tamron 90 mm 1:2.8 macro lens, diameter of 55 mm, Tokyo, Japan). From these photographs, the fascicle length was determined with ImageJ (Rasband, W.S., ImageJ, U.S. National Institutes of Health, Bethesda, M.D. USA) (Figs 1 and 2). Five different fascicle lengths were measured per muscle (bundle) at randomly distributed positions. From these 5 measurements, the mean fiber length per muscle (bundle) was calculated. In addition, the appendicular skeleton of the hind limb (after complete dissection) was photographed (C-8080 Wide Zoom Olympus camera, Olympus Corporation, Tokyo, Japan). The length of the femur, tibia, tarsals/metatarsals and phalanges were measured from these photographs using ImageJ (Fig 3) and summed to get the SHLL. Easily distinguishable landmarks were chosen to measure the lengths of the individual bones (Table 2). We preferred to use distances between specific anatomical landmarks representative for the overall length of the bones, rather than the proximal and distal most ends of the bones (more configuration dependent). From the BM and the SHLL, the BMI was calculated. The formula for BMI was adapted from Baxter et al. [32], including the SHLL instead of crown-rump length. BMI ¼ BM:SHLL
PLOS ONE | https://doi.org/10.1371/journal.pone.0209233 December 14, 2018
2
5 / 18
Force generating capacity and muscle composition of the piglet hind limb
Fig 1. Fascicle length of a parallel-fibered muscle. A. M. semitendinosus. B. Fascicle length. C. Scale (in cm). Category = L piglet, Age = 96 h, Sex = female. https://doi.org/10.1371/journal.pone.0209233.g001
Force calculations Fiso-max was estimated for each muscle by multiplying the PCSA with the maximum isometric stress of a muscle (σ = 0.3 MPa) [27, 33, 34]. Fiso
max
¼ s: PCSA
The PCSA of a muscle is obtained by dividing muscle volume (V) by mean fiber length (l). Muscle volume is calculated by dividing muscle mass (m) by mammalian skeletal muscle density (ρ = 1.06 x 10³ kg m-3, see Me´ndez and Keys [35]). We assumed muscle density to be the same for L and N piglets, since these groups show no difference in the amount of intramuscular fat, thus leading to the same muscle to fat ratio within a muscle [36, 37]. V ¼ m:r
1
PCSA ¼ V:l
1
Fig 2. Fascicle length of a pennate-fibered muscle. A. M. gluteus superficialis. B. Fascicle length. C. Scale (in cm). Category = L piglet, Age = 96 h, Sex = female. https://doi.org/10.1371/journal.pone.0209233.g002
PLOS ONE | https://doi.org/10.1371/journal.pone.0209233 December 14, 2018
6 / 18
Force generating capacity and muscle composition of the piglet hind limb
Fig 3. Skeletal hind limb length (SHLL). A. Femur. B. Tibia/fibula C. Tarsals/metatarsals D. Phalanges. E. Scale. Category = L piglet, Age = 96 h, Sex = female. https://doi.org/10.1371/journal.pone.0209233.g003
Fiso-max was normalized according to body weight (BW = BM x g; g = 9.81 ms-2) at time of euthanasia leading to F’iso-max. F0iso
max
¼ Fiso
max
: ðBM:gÞ
1
Fiso-max and F’iso-max were calculated per muscle and summed to get an approximation of the total Fiso-max and F’iso-max of the hind limb.
Immunohistochemistry The muscle tissue was immunohistochemically stained for type II muscle fibers with a rabbit polyclonal anti-MYH1 antibody (Proteintech, Rosemont, IL, USA). Ten 4 μm cross-sections per muscle sample were made and mounted onto a microscopic slide using STA-ON 1% adhesive (Leica Biosystems, Wetzlar, Germany). The slides were put in xylol to dissolve the remaining paraffin and the tissue was rehydrated, using a graded alcohol series. Antigen retrieval was performed by incubating the slides for 5 min in hot (below boiling point) sodium citrate buffer (10 mM sodium citrate, 0.05% Tween 20, pH = 6). Crosssections were rinsed in distilled water and tris buffered saline (TBS, pH = 7.4) consecutively and then exposed to 3% hydrogen peroxide (H2O2 (Thermo Fisher Scientific, Geel, Belgium), in TBS) for 30 min at room temperature. To block non-specific binding, 10% normal goat Table 2. Landmarks used for determination of bone lengths. Bone
Proximal landmark
Distal landmark
Femur
Most proximal end of trochanter major
Intersection of condylus lateralis and proximal end of patella
Tibia/fibula
Most proximal end of condylus lateralis
Most distal point of the malleolus lateralis
Tarsals/ metatarsals
Tuber calcanei
Most distal end of os metatarsale IV
Phalanges
Most proximal end of proximal phalanx
Most distal end of distal phalanx
https://doi.org/10.1371/journal.pone.0209233.t002
PLOS ONE | https://doi.org/10.1371/journal.pone.0209233 December 14, 2018
7 / 18
Force generating capacity and muscle composition of the piglet hind limb
serum (in TBS containing 0.3% Triton X (TX; Sigma-Aldrich, St. Louis, MO, USA) and 1% bovine serum albumin (BSA, Sigma-Aldrich, St. Louis, MO, USA)) was applied to the slides for 30 min at room temperature. The primary antibody was applied overnight (in TBS containing 0.3% TX and 1% BSA) at 4˚C. After washing in TBS (2 times for 5 min), sections were incubated for 1 h with a biotinylated secondary antibody (a biotinylated goat anti-rabbit antibody, Dako/Agilent, Santa Clara, CA, USA) in a 1/200 dilution (in TBS containing 0.3 TX and 1% BSA) at room temperature. After another washing in TBS (2 times for 5 min), the slides were exposed to a Streptavidine/Horseradish Peroxidase-complex (Dako/Agilent, Santa Clara, CA, USA) in a 1/200 dilution (in TBS containing 0.3 TX and 1% BSA) for 30 min at room temperature. After washing in TBS, the positive reaction was visualized using diaminobenzidine (DAB, Sigma-Aldrich, St. Louis, MO, USA) and the sections were counterstained with hematoxylin (Klinipath, Leuven, Belgium). Afterwards, slides were dehydrated through a graded alcohol series, immersed in xylol and mounted.
Image analysis Images were analyzed under a light microscope (Model BX 51, Olympus, Tokyo, Japan) combined with a digital color camera (Model PM-C35, Olympus, Tokyo, Japan) and a motorized stage (Model Cs152DP/A, Prior, UK). With Visiopharm software (Visiopharm, Lund, Sweden) each histological preparation was first scanned in full at a total magnification of 40X, in order to delineate the region of interest. This was done to make sure only m. vastus lateralis was included in the analysis. In each section four random fields were analyzed at a 100X total magnification, leading to a total of 40 analyzed fields per muscle per pig. A preliminary analysis showed that the coefficient of error (CE) of the estimated volume densities was sufficiently low (< 0.05; [38]) when analyzing this amount of fields of view per muscle per pig. The volume densities of the type II fibers as well as unstained non-muscle fiber tissue in the samples were estimated using a grid overlay on a series of blinded, immunohistochemically stained sections and subsequently counting the number of grid points (Q) within the phase of interest (Q(Y), see further) and the number of grid points falling on the reference area (Q(ref)). The following equation yields the volume density expressed as a percentage [39]: VvðY; ref Þ ¼
QðYÞ 100% QðrefÞ
In this study, the number of grid points falling on type II fibers (Ftype II, stained), all muscle fibers (Ftotal, stained + not-stained muscle fibers) as well as unstained, non-muscle fiber tissue (Tother, such as connective tissue, fat, nerves and capillaries) were counted. Although there was no difference in color between the non-stained muscle fibers and Tother, it was easy to distinguish them from each other because of their typical histologic structure and morphology. For the purpose of this study we did not further differentiate the other tissue (into connective tissue, fat tissue, nerves and blood vessels). We will refer to the total muscle tissue as Ttotal (Ftotal + Tother). From these data, three ratio’s were calculated: Ftype II/ Ftotal; Ftype II/ Ttotal and Tother /Ttotal.
Statistics Linear mixed models were fitted to evaluate the effect of age (0, 4, 8 and 96 h) and birth weight category (L or N piglet) on each of the outcome variables. Sex was added as a covariate. As such, the starting model included age, birth weight category, sex and the interaction between age and birth weight category as fixed effects. Interactions between age and sex or sex and birth weight category and the interaction between age, birth weight category and sex were not included, because this would have made the starting model too complex for the number of
PLOS ONE | https://doi.org/10.1371/journal.pone.0209233 December 14, 2018
8 / 18
Force generating capacity and muscle composition of the piglet hind limb
observations. To account for the dependence between littermates, sow was added as a random factor. This starting model was simplified using stepwise backwards modelling, during which all non-significant effects were removed from the starting model. To meet normality and/or homoscedasticity assumptions F’iso-max was log transformed, while all other outcome variables required no transformations. Effects were considered statistically significant if p � 0.05. Models were fitted using JMP Pro 13 (SAS Institute Inc., Cary, NC, USA). Post-hoc analysis with Tukey’s correction was used to compare different age groups. All values are indicated as mean ± SD.
Results The following sections highlight only the significant results of this study. Calculations per individual muscle for Fiso-max and F’iso-max can be found in S1 Table. For more detailed information on means (± SD) across the different groups, we refer to S2 Table.
Morphometrics Overall, the BM of L piglets was lower than the BM of N piglets (0.87 kg (± 0.37) vs 1.52 kg (± 0.46), p < 0.0001; Fig 4A). For both groups, the BM at 96 h was higher than the BM at 0, 4 and 8 h (p < 0.0001; Fig 4B). For L piglets, BM increased from 0.65 kg (± 0.28) at 0 h to 1.44 kg (± 0.21) at 96 h. N piglets had a BM of 1.23 kg (± 0.36) at birth that increased to 2.16 kg (± 0.38) by the age of 96 h. BM did not differ significantly between sexes (Fig 4C). Across all time points, the SHLL was shorter in L piglets (0.16 m (± 0.03)), compared to N piglets (0.20 m (± 0.02) (p < 0.0001; Fig 4D). At 96 h, the SHLL was longer than at 0, 4 and 8 h of age (0.21 m (± 0.03) vs 0.17 m (± 0.03), 0.18 m (± 0.03) and 0.19 m (± 0.02), respectively) (p < 0.0001 (0 h), p = 0.0004 (4 h) and p = 0.0006 (8 h); Fig 4E). L piglets showed an increase in SHLL from 0.15 m (± 0.03) to 0.20 m (± 0.02) between 0 and 96 h, respectively. For N piglets
Fig 4. Morphometrics. A-C. Body mass (BM, n = 32). D-F. Skeletal hind limb length (SHLL, n = 32). G-I. Body mass index (BMI, n = 32). All values are mean ± SD. Significant differences (linear mixed models, p � 0.05) are indicated by different letters. https://doi.org/10.1371/journal.pone.0209233.g004
PLOS ONE | https://doi.org/10.1371/journal.pone.0209233 December 14, 2018
9 / 18
Force generating capacity and muscle composition of the piglet hind limb
this amounted to an increase from 0.19 m (± 0.02) to 0.23 m (± 0.02). The SHLL was longer for females compared to males across all ages (0.19 m (± 0.03) vs 0.18 m (± 0.03), respectively, p = 0.0031; Fig 4F). Similar to the BM and the SHLL, L piglets have a lower BMI than N piglets (30.53 kg m-2 (± 5.28) vs 35.80 kg m-2(± 5.62), p < 0.0001; Fig 4G). The BMI was higher at 96 h (40.19 kg m-2 (± 5.44)), compared to 0, 4 and 8 h (30.53 kg m-2 (± 5.24), 31.14 kg m-2 (± 3.06) and 32.67 kg m-2 (± 5.48), respectively) (p < 0.0001 (0, 4 h) and p = 0.0001 (8 h); Fig 4H). In addition, males had a higher BMI, compared to females (34.99 kg m-2 (± 6.22) vs 32.04 kg m-2 (± 5.65), p = 0.0048); Fig 4I).
Absolute force generating capacity (Fiso-max) L piglets had a lower Fiso-max than N piglets (p < 0.0001), with L piglets having an Fiso-max of 356.37 N (± 128.56), while we noted an Fiso-max of 559.59 N (± 122.29) for N piglets (Fig 5A). Piglets that were 96 h old showed an Fiso-max that was larger than that of piglets at 0, 4 and 8 h of age (610.59 N (± 125.48) vs 408.42 N (± 152.92), 384.84 N (± 146.20) and 478.73 N (± 140.65), respectively) (p < 0.0001 (0, 4 h) and p = 0.0038 (8 h); Fig 5B). In L piglets the Fiso-max increased from 294.88 N (± 104.32) to 537.05 N (± 42.60) between 0 and 96 h, while for N piglets it increased from 499.25 N (± 124.11) to 665.74 N (± 144.3). In addition, females showed a higher Fiso-max (481.23 N (± 174.09)) than males (442.611 N (± 144.84)) (p = 0.020; Fig 5C).
Normalized force generating capacity (F’iso-max) With a value of 43.41 (± 9.62) compared to 38.61 (± 5.94), L piglets had a higher F’iso-max than N piglets (p = 0.0107; Fig 5D). At 96 h, F’iso-max was smaller than at 0 and 8 h (34.29 (± 4.31) vs 44.64 (± 5.44) and 44.02 (± 12.39), respectively) (p = 0.0026 (0 h) and p = 0.0075 (8 h); Fig 5E).
Fig 5. Force generating capacity. A-C. Absolute force generating capacity (Fiso-max, n = 32). D-F. Normalized force generating capacity (F’iso-max, n = 32). All values are mean ± SD. Significant differences (linear mixed models, p � 0.05) are indicated by different letters. https://doi.org/10.1371/journal.pone.0209233.g005
PLOS ONE | https://doi.org/10.1371/journal.pone.0209233 December 14, 2018
10 / 18
Force generating capacity and muscle composition of the piglet hind limb
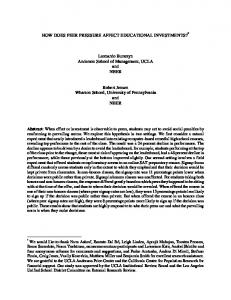
Fig 6. Type II staining of m. quadriceps femoris. A. Type II fiber (stained). B. Type I fiber (not stained). C. Connective tissue. Category = L piglet, Age = 0 h, Sex = female. https://doi.org/10.1371/journal.pone.0209233.g006
In addition, F’iso-max was higher for females than for males (41.69 (± 9.62) vs 39.79 (± 5.84), p = 0.0053; Fig 5F).
Muscle composition The large abundance of type II fibers (stained brown) can be clearly seen in Fig 6. Of the total muscle tissue, 95.58% (± 1.55) consisted of muscle fibers (Ftotal/Ttotal). Furthermore, Ftype II/ Ftotal; Ftype II/ Ttotal and Tother/Ttotal did not differ significantly with category, age or sex. The mean value for Ftype II/ Ftotal was 90.13% (± 1.69), while Ftype II/ Ttotal was 86.13% (± 2.31). Ratio’s for all piglets separately, including the CE, can be found in S3 Table.
Discussion Do L piglets have shorter legs than N piglets? Our results show that a lower BM and BMI are associated with a shorter SHLL, thereby confirming our hypothesis. This indicates that L piglets are not only more slender, but also overall smaller (and as such have shorter legs) than N piglets. This shorter SHLL is consistent with our previous data, where stride and step length of L piglets was shorter than that of N piglets [13]. When combining this, we can safely say that shorter legs in L piglets lead to shorter steps.
Is there a difference in absolute force generating capacity (Fiso-max) between L and N piglets? The difference in size between L and N piglets reduces the Fiso-max in L piglets, both at birth and during early development, thus confirming our hypothesis. In other words, because of their decreased muscle mass, L piglets have a smaller PCSA and hence a reduced Fiso-max. In the light of the two aspects of locomotion, maintaining posture and forward propulsion, these findings make sense. A higher force generating capacity allows N piglets to prevent joint collapse under the increased gravitational load due to a higher BM, thus being able to maintain posture. However, the fact that a lower BM is associated with a lower muscle mass and hence a reduced absolute force generating capacity does not tell us much about muscle development. To check whether the decreased muscularity of L piglets is still sufficient given their lower BM
PLOS ONE | https://doi.org/10.1371/journal.pone.0209233 December 14, 2018
11 / 18
Force generating capacity and muscle composition of the piglet hind limb
to achieve a certain level of performance, we have to look at the relative or normalized force generating capacity.
Is there a difference in normalized force generating capacity (F’iso-max) between L and N piglets? Unexpectedly, F’iso-max is higher for L than N piglets, thereby rejecting our original hypothesis that L piglets have lesser developed muscles than N piglets. In other words, L piglets have a larger normalized force generating capacity, indicating that the growth of their muscles (given their BW) is not lagging behind. On the contrary, relative to their BM, L piglets have a larger PCSA. This is in accordance with results by Wank et al. [40] indicating that the hind limb plantar flexors of newborn IUGR piglets exhibit a higher specific force (force normalized for muscle mass of the plantar flexor group) than those of N piglets. A study by Bauer et al. [41] also stated that IUGR piglets experience an accelerated muscle development (hemodynamics and contractile function). Alternatively, this observed difference might have been caused by a non-linear relationship between Fiso-max and BM. If an increase in BM is not accompanied by a directly proportional increase in Fiso-max (in other words, if Fiso-max would increase more slowly, compared to BM), then piglets with a low BM would show a relatively higher FGC, compared to animals with a higher BM. This would explain why L piglets have a higher F’iso-max, compared to N piglets and why young piglets (0–8 h) have a higher F’iso-max, compared to 96 h piglets. However, a regression showed a linear relationship between BM and Fiso-max (R2 = 0.85, p < 0.0001), so in all likelihood we can dismiss this theory and state that L piglets do in fact have more voluminous muscles (given their BM) than N piglets. However, this higher F’iso-max for L piglets raises some questions. If L piglets indeed show an accelerated muscle development, it appears as though they do not exploit their full potential. As such, we must look for other factors explaining the observed force deficit in L piglets, such as the composition of the muscles.
Is there a difference in muscle composition between L and N piglets? No differences between groups could be discovered, thereby rejecting our hypothesis that L and N piglets have a different muscle composition. So far, several studies have reported differences between the muscles of L and N piglets with regard to fiber composition. For example, studies by Wank et al. [40] and Bauer et al. [42] revealed an increased proportion of type I fibers in the hind limb plantar flexors and m. gastrocnemius in 1-day-old IUGR piglets compared to N piglets. On the other hand, looking at m. semitendinosus, Rehfeldt and Kuhn [6] observed no differences in the percentages of fiber types between L and N piglets. Similarly, Gondret et al. [43] found the relative proportions of type I and II fibers in m. semitendinosus and m. rhomboideus to be independent of birth weight. As such, at this point, it is hard to say whether there is an unambiguous link between IUC (and the associated differences in BM) and the fiber composition of pig muscles. Given the great structural and functional diversity in muscles, different results might be obtained for other muscles. In addition, differences might be more subtle than what we investigated. In our study we only distinguished between type I and II fiber. However, in pigs type II fibers actually comprise three subtypes, type IIa, IIb and IIx [44], though not all subtypes are expressed in each muscle [45]. Type IIa is considered to have oxidative glycolytic properties, type IIb is considered glycolytic [46], while the somewhat later discovered type IIx has properties intermediate between those of IIa and IIb [47]. Considering that these subtypes have a different ATPase activity and
PLOS ONE | https://doi.org/10.1371/journal.pone.0209233 December 14, 2018
12 / 18
Force generating capacity and muscle composition of the piglet hind limb
contraction speed, having a different composition with regard to these three subtypes might have an effect on force production [20, 48]. Furthermore, it might also be possible that the myofibrillar structure of the fibers of L piglets is not as mature as in N piglets. This is not visible in an enzymatic study such as ours, but can be investigated in the future by means of ultrastructural methods.
Other possible explanations for the observed force deficit in L piglets We proposed that the observed force deficit in L piglets was attributed to a lesser growth and maturation of the musculoskeletal system and/or different fiber composition of the muscles. However, our results indicate that L piglets have shorter legs, but that their muscles can generate relatively larger forces than those of N piglets. In addition, we see no difference in the fiber composition of m. vastus lateralis. As such, we must look to other factors that might explain the observed force deficit for L piglets. One option is that L and N piglets differ in the development of the control (neural) system, such as the degree of myelination. It is a known fact that changes in force are mediated by the manner in which the nervous system recruits motor units within a muscle [14]. Alternatively, we might consider that, though the muscles of L piglets might be sufficiently developed, L piglets might lack the energy required to fully exploit the capacity of their muscles. As mentioned in the introduction of this paper, an increase in performance requires an animal’s muscles to generate larger forces and contract more rapidly. However, this requires a increased energy supply [14]. To understand this, one must consider the energy balance of a newborn piglet. Being devoid of brown fat [36, 49–51] piglets are largely dependent on (a limited amount of) glycogen pools in the muscles and the liver for initial energy provision [36, 51, 52] and on a rapid ingestion of colostrum [53]. As such, a different glycogen concentration in the muscles and liver might be an explanation for the observed force difference between L and N piglets. So far, no differences between L and N piglets have been detected with regard to glycogen concentration [36, 52], though our preliminary results (data not shown) do indicate that there is a difference. However, even when accounting for a possible equal glycogen concentration in L and N piglets, it is possible that, because of their size difference, L and N piglets have to allocate their available energy in a different manner. A newborn pig relies mainly on shivering thermogenesis to maintain a stable body temperature. As small animals are more prone to heat loss, due to their larger surface to mass ratio, L piglets might be forced to allocate more of their available energy towards maintaining homeothermy than N piglets, leaving less energy available for locomotion. This theory is supported by findings from Baxter et al. [54], who state that low weight piglets have a lower average rectal temperature during the first day after birth and by the statement by Herpin et al. [55] that a higher birth weight has a positive effect on thermoregulation. After this initial period, energy levels are replenished with fatty acids and lactose from milk [49, 56, 57]. However, due to extensive teat competition in large litters [4, 58], the intake of milk is reduced in L piglets and as such the amount of dietary energy for locomotion in the L piglets is less [59].
On the effect of sex Unexpectedly, we came across differences in both morphometrics and force generating capacity (both absolute and relative) between sexes. In spite of not having a different BM, females had a higher SHLL than males. This implies a different body build, with females having longer hind limbs than males. In addition, females exhibit a higher Fiso-max, indicating they have more muscular hind limbs. Even when normalized to body weight, F’iso-max, is higher for females than males, indicating that males have less voluminous muscles, given their BM. From our
PLOS ONE | https://doi.org/10.1371/journal.pone.0209233 December 14, 2018
13 / 18
Force generating capacity and muscle composition of the piglet hind limb
earlier study, we see that this is not reflected in their gait pattern [23]. It might, however, be reflected in a larger male mortality rate [60]. If males possess smaller muscles than females, this could imply a smaller absolute amount of glycogen (relative to their BM, which is not lower), thereby increasing the need to suckle and thus to spend more time in the vicinity of the sow and are hence more prone to crushing by the sow. This need is even more amplified because males have more trouble maintaining homeothermy and as such need to allocate more of the available energy towards countering hypothermia [60]. In addition, if males have a lesser force generating capacity than females, chances are they will often lose the competition for a functional teat, thereby again, having to spend more time around the udder. Combined with being less able to rapidly move away, their risk to be crushed by the sow further increases. Alternatively, if these differences in body build persist later during ontogeny and remain independent from locomotor performance, they most likely represent a sexual dimorphism related to the pelvic differences in function of child bearing. As stated by Glucksmann [61] in their review on sexual dimorphisms in mammals, the female pelvic region is often enlarged for the purpose of child bearing and for the accommodation of the genital tract (which in males is partially located on the exterior of the body). This broader pelvis can in turn affect the hip joint and the skeleton. It is not hard to imagine that as a ‘by-product’ of this sexual dimorphism, the muscles in the pelvic area of females might be more developed than those in males.
Conclusions Our previous study showed a reduced motor performance in L piglets, indicating that they experience a force deficit. We tried to explain this force deficit by investigating the force generating capacity of the hind limb and the composition of m. quadriceps femoris. Our results show that L piglets have a lower absolute force generating capacity due to a lesser muscle mass. However, L piglets do show a larger normalized force generating capacity, suggesting they actually have more voluminous muscles, given their BM, than N piglets. In addition, no differences in muscle fiber composition of the m. vastus lateralis were detected between L and N piglets, thereby indicating that the observed force deficit cannot be explained by a difference in type II fiber percentage. Ultrastructual, neural and energetic studies will be key to further unravel the effect of IUC on locomotory performance in piglets.
Supporting information S1 Table. Calculations Fiso-max and F’iso-max per individual muscle. (PDF) S2 Table. Means (± SD) by category, sex and age. (PDF) S3 Table. Ftype II/ Ftotal; Ftype II/ Ttotal, Tother /Ttotal and CE per piglet. (PDF)
Acknowledgments The authors thank Jan Collogne, Jan Van Steelandt and Annelies Ooms from AVEVE (Neerhespen) for providing the piglets and accommodation during the experiments. The authors are also grateful to Gunther Vrolix, Denise Vogel and Marleen Cools for helping with the experiments.
PLOS ONE | https://doi.org/10.1371/journal.pone.0209233 December 14, 2018
14 / 18
Force generating capacity and muscle composition of the piglet hind limb
Author Contributions Conceptualization: Peter Aerts. Data curation: Charlotte Vanden Hole. Formal analysis: Charlotte Vanden Hole. Funding acquisition: Chris Van Ginneken, Peter Aerts. Investigation: Charlotte Vanden Hole, Silke Cleuren, Miriam Ayuso. Methodology: Charlotte Vanden Hole, Silke Cleuren, Chris Van Ginneken, Peter Aerts. Project administration: Chris Van Ginneken, Peter Aerts. Resources: Chris Van Ginneken. Supervision: Chris Van Ginneken, Peter Aerts. Visualization: Charlotte Vanden Hole. Writing – original draft: Charlotte Vanden Hole. Writing – review & editing: Charlotte Vanden Hole, Silke Cleuren, Chris Van Ginneken, Sara Prims, Miriam Ayuso, Steven Van Cruchten, Peter Aerts.
References 1.
Perry J, Rowell J. Variations in foetal weight and vascular supply along the uterine horn of the pig. Journal of reproduction and fertility. 1969; 19(3):527–34. PMID: 5809469
2.
Dziuk P. Effect of migration, distribution and spacing of pig embryos on pregnancy and fetal survival. Journal of reproduction and fertility Supplement. 1985; 33:57–63. PMID: 3910827
3.
Fraser D. Behavioural perspectives on piglet survival. Journal of reproduction and fertility Supplement. 1990; 40:355–70. PMID: 2192051
4.
Rutherford KM, Baxter EM, Ask B, Berg P, D’Eath RB, Jarvis S, et al. The ethical and welfare implications of large litter size in the domestic pig: challenges and solutions. Danish Centre for Bioethics and Risk Assessment (CeBRA), 2011.
5.
Wise T, Roberts A, Christenson R. Relationships of light and heavy fetuses to uterine position, placental weight, gestational age, and fetal cholesterol concentrations. Journal of animal science. 1997; 75 (8):2197–207. PMID: 9263069
6.
Rehfeldt C, Kuhn G. Consequences of birth weight for postnatal growth performance and carcass quality in pigs as related to myogenesis. Journal of animal science. 2006; 84(13_suppl):E113–E23.
7.
Quiniou N, Dagorn J, Gaudre´ D. Variation of piglets’ birth weight and consequences on subsequent performance. Livestock Production Science. 2002; 78(1):63–70.
8.
Be´rard J, Kreuzer M, Bee G. Effect of litter size and birth weight on growth, carcass and pork quality, and their relationship to postmortem proteolysis. Journal of Animal Science. 2008; 86(9):2357–68. https://doi.org/10.2527/jas.2008-0893 PMID: 18469061
9.
Alvarenga A, Chiarini-Garcia H, Cardeal P, Moreira L, Foxcroft G, Fontes D, et al. Intra-uterine growth retardation affects birthweight and postnatal development in pigs, impairing muscle accretion, duodenal mucosa morphology and carcass traits. Reproduction, Fertility and Development. 2013; 25(2):387–95.
10.
Bauer R, Walter B, Hoppe A, Gaser E, Lampe V, Kauf E, et al. Body weight distribution and organ size in newborn swine (sus scrofa domestica)—a study describing an animal model for asymmetrical intrauterine growth retardation. Experimental and Toxicologic Pathology. 1998; 50(1):59–65. https://doi.org/ 10.1016/S0940-2993(98)80071-7 PMID: 9570503
11.
Maltin CA, Delday MI, Sinclair KD, Steven J, Sneddon AA. Impact of manipulations of myogenesis in utero on the performance of adult skeletal muscle. Reproduction. 2001; 122(3):359–74. PMID: 11597302
12.
Be´rard J, Pardo C, Be´thaz S, Kreuzer M, Bee G. Intrauterine crowding decreases average birth weight and affects muscle fiber hyperplasia in piglets. Journal of animal science. 2010; 88(10):3242–50. https://doi.org/10.2527/jas.2010-2867 PMID: 20562364
PLOS ONE | https://doi.org/10.1371/journal.pone.0209233 December 14, 2018
15 / 18
Force generating capacity and muscle composition of the piglet hind limb
13.
Vanden Hole C, Aerts P, Prims S, Ayuso M, Van Cruchten S, Van Ginneken C. Does intrauterine crowding affect locomotor development? A comparative study of motor performance, neuromotor maturation and gait variability among piglets that differ in birth weight and vitality. PloS one. 2018; 13(4):e0195961. https://doi.org/10.1371/journal.pone.0195961 PMID: 29689084
14.
Biewener AA. Animal locomotion: Oxford University Press; 2003.
15.
Swanstrom MD, Zarucco L, Stover SM, Hubbard M, Hawkins DA, Driessen B, et al. Passive and active mechanical properties of the superficial and deep digital flexor muscles in the forelimbs of anesthetized Thoroughbred horses. Journal of biomechanics. 2005; 38(3):579–86. https://doi.org/10.1016/j. jbiomech.2004.03.030 PMID: 15652557
16.
Bottinelli R, Canepari M, Pellegrino M, Reggiani C. Force-velocity properties of human skeletal muscle fibres: myosin heavy chain isoform and temperature dependence. The Journal of physiology. 1996; 495 (2):573–86.
17.
Larsson L, Moss R. Maximum velocity of shortening in relation to myosin isoform composition in single fibres from human skeletal muscles. The Journal of physiology. 1993; 472(1):595–614.
18.
Widrick JJ, Trappe SW, Blaser CA, Costill DL, Fitts RH. Isometric force and maximal shortening velocity of single muscle fibers from elite master runners. American Journal of Physiology-Cell Physiology. 1996; 271(2):C666–C75.
19.
Bottinelli R, Canepari M, Reggiani C, Stienen G. Myofibrillar ATPase activity during isometric contraction and isomyosin composition in rat single skinned muscle fibres. The Journal of Physiology. 1994; 481(3):663–75.
20.
Eddinger TJ, Moss RL. Mechanical properties of skinned single fibers of identified types from rat diaphragm. American Journal of Physiology-Cell Physiology. 1987; 253(2):C210–C8.
21.
Geiger PC, Cody MJ, Macken RL, Sieck GC. Maximum specific force depends on myosin heavy chain content in rat diaphragm muscle fibers. Journal of applied physiology. 2000; 89(2):695–703. https://doi. org/10.1152/jappl.2000.89.2.695 PMID: 10926656
22.
Schiaffino S, Reggiani C. Fiber types in mammalian skeletal muscles. Physiological reviews. 2011; 91 (4):1447–531. https://doi.org/10.1152/physrev.00031.2010 PMID: 22013216
23.
Vanden Hole C, Goyens J, Prims S, Fransen E, Hernando MA, Van Cruchten S, et al. How innate is locomotion in precocial animals? A study on the early development of spatio-temporal gait variables and gait symmetry in piglets. Journal of Experimental Biology. 2017; 220(15):2706–16.
24.
Tuchscherer M, Puppe B, Tuchscherer A, Tiemann U. Early identification of neonates at risk: traits of newborn piglets with respect to survival. Theriogenology. 2000; 54(3):371–88. https://doi.org/10.1016/ S0093-691X(00)00355-1 PMID: 11051321
25.
Merkens H, Schamhardt H, OSCH GJ, Bogert Avd. Ground reaction force patterns of Dutch Warmblood horses at normal trot. Equine veterinary journal. 1993; 25(2):134–7. PMID: 8467772
26.
Payne R, Hutchinson J, Robilliard J, Smith N, Wilson A. Functional specialisation of pelvic limb anatomy in horses (Equus caballus). Journal of Anatomy. 2005; 206(6):557–74. https://doi.org/10.1111/j.14697580.2005.00420.x PMID: 15960766
27.
Williams S, Wilson A, Rhodes L, Andrews J, Payne R. Functional anatomy and muscle moment arms of the pelvic limb of an elite sprinting athlete: the racing greyhound (Canis familiaris). Journal of anatomy. 2008; 213(4):361–72. https://doi.org/10.1111/j.1469-7580.2008.00961.x PMID: 18657259
28.
Payne R, Crompton R, Isler K, Savage R, Vereecke E, Gu¨nther M, et al. Morphological analysis of the hindlimb in apes and humans. II. Moment arms. Journal of anatomy. 2006; 208(6):725–42. https://doi. org/10.1111/j.1469-7580.2006.00564.x PMID: 16761974
29.
Payne RC, Crompton RH, Isler K, Savage R, Vereecke EE, Gu¨nther MM, et al. Morphological analysis of the hindlimb in apes and humans. I. Muscle architecture. Journal of anatomy. 2006; 208(6):709–24. PMID: 16761973
30.
Loeb GE, Gans C. Electromyography for experimentalists: University of Chicago Press; 1986.
31.
Bock WJ. A staining method of gross dissection of vertebrate muscles. Anat Anz Bd. 1972; 130:222–7.
32.
Baxter E, Jarvis S, D’eath R, Ross D, Robson S, Farish M, et al. Investigating the behavioural and physiological indicators of neonatal survival in pigs. Theriogenology. 2008; 69(6):773–83. https://doi.org/10. 1016/j.theriogenology.2007.12.007 PMID: 18242685
33.
Wells J. Comparison of mechanical properties between slow and fast mammalian muscles. The Journal of Physiology. 1965; 178(2):252–69.
34.
Medler S. Comparative trends in shortening velocity and force production in skeletal muscles. American Journal of Physiology-Regulatory, Integrative and Comparative Physiology. 2002; 283(2):R368–R78. https://doi.org/10.1152/ajpregu.00689.2001 PMID: 12121850
35.
Me´ndez J, Keys A. Density and composition of mammalian muscle. Metabolism. 1960; 9:184–8.
PLOS ONE | https://doi.org/10.1371/journal.pone.0209233 December 14, 2018
16 / 18
Force generating capacity and muscle composition of the piglet hind limb
36.
De Vos M, Huygelen V, Hesta M, Willemen SA, Fransen E, Casteleyn C, et al. Birthweight has no influence on chemical body composition and muscle energy stores in suckling piglets. Animal Production Science. 2016; 56(5):844–9.
37.
Beaulieu A, Aalhus J, Williams N, Patience J. Impact of piglet birth weight, birth order, and litter size on subsequent growth performance, carcass quality, muscle composition, and eating quality of pork. Journal of animal science. 2010; 88(8):2767–78. https://doi.org/10.2527/jas.2009-2222 PMID: 20418451
38.
Gundersen H, Jensen E. The efficiency of systematic sampling in stereology and its prediction. Journal of microscopy. 1987; 147(3):229–63.
39.
Howard V, Reed M. Unbiased stereology: three-dimensional measurement in microscopy: Garland Science; 2004.
40.
Wank V, Bauer R, Walter B, Kluge H, Fischer MS, Blickhan R, et al. Accelerated contractile function and improved fatigue resistance of calf muscles in newborn piglets with IUGR. American Journal of Physiology-Regulatory, Integrative and Comparative Physiology. 2000; 278(2):R304–R10. https://doi. org/10.1152/ajpregu.2000.278.2.R304 PMID: 10666129
41.
Bauer R, Wank V, Walter B, Blickhan R, Zwiener U. Reduced muscle vascular resistance in intrauterine growth restricted newborn piglets. Experimental and Toxicologic Pathology. 2000; 52(3):271–6. https:// doi.org/10.1016/S0940-2993(00)80045-7 PMID: 10930129
42.
Bauer R, Gedrange T, Bauer K, Walter B. Intrauterine growth restriction induces increased capillary density and accelerated type I fiber maturation in newborn pig skeletal muscles. Journal of perinatal medicine. 2006; 34(3):235–42. https://doi.org/10.1515/JPM.2006.042 PMID: 16602845
43.
Gondret F, Lefaucheur L, Juin H, Louveau I, Lebret B. Low birth weight is associated with enlarged muscle fiber area and impaired meat tenderness of the longissimus muscle in pigs. Journal of Animal Science. 2006; 84(1):93–103. PMID: 16361495
44.
Lefaucheur L, Hoffman R, Gerrard D, Okamura C, Rubinstein N, Kelly A. Evidence for three adult fast myosin heavy chain isoforms in type II skeletal muscle fibers in pigs. Journal of animal science. 1998; 76(6):1584–93. PMID: 9655578
45.
Lefaucheur L, Ecolan P, Plantard L, Gueguen N. New insights into muscle fiber types in the pig. Journal of Histochemistry & Cytochemistry. 2002; 50(5):719–30.
46.
Peter JB, Barnard RJ, Edgerton VR, Gillespie CA, Stempel KE. Metabolic profiles of three fiber types of skeletal muscle in guinea pigs and rabbits. Biochemistry. 1972; 11(14):2627–33. PMID: 4261555
47.
Larsson L, Edstrom L, Lindegren B, Gorza L, Schiaffino S. MHC composition and enzyme-histochemical and physiological properties of a novel fast-twitch motor unit type. American Journal of PhysiologyCell Physiology. 1991; 261(1):C93–C101.
48.
Sieck GC, Han Y-S, Prakash Y, Jones KA. Cross-bridge cycling kinetics, actomyosin ATPase activity and myosin heavy chain isoforms in skeletal and smooth respiratory muscles1. Comparative Biochemistry and Physiology Part B: Biochemistry and Molecular Biology. 1998; 119(3):435–50.
49.
Le Dividich J, Mormede P, Catheline M, Caritez J. Body composition and cold resistance of the neonatal pig from European (Large White) and Chinese (Meishan) breeds. Neonatology. 1991; 59(5):268–77.
50.
Lin X, Azain M, Odle J. Lipids and lipid utilization in swine. Sustainable Swine Nutrition. 2013:59–79.
51.
Herpin P, Le Dividich J, Amaral N. Effect of selection for lean tissue growth on body composition and physiological state of the pig at birth. Journal of Animal Science. 1993; 71(10):2645–53. PMID: 8226364
52.
Theil P, Cordero G, Henckel P, Puggaard L, Oksbjerg N, Sørensen M. Effects of gestation and transition diets, piglet birth weight, and fasting time on depletion of glycogen pools in liver and 3 muscles of newborn piglets. Journal of animal science. 2011; 89(6):1805–16. https://doi.org/10.2527/jas.2010-2856 PMID: 21278105
53.
Mount LE. The climatic physiology of the pig. The climatic physiology of the pig. 1968;( 18).
54.
Baxter E, Lawrence A, Edwards S. Alternative farrowing systems: design criteria for farrowing systems based on the biological needs of sows and piglets. animal. 2011; 5(04):580–600.
55.
Herpin P, Hulin J, Le Dividich J, Fillaut M. Effect of oxygen inhalation at birth on the reduction of early postnatal mortality in pigs. Journal of animal science. 2001; 79(1):5–10. PMID: 11204714
56.
Anderson R, Wahlstrom R. Effects of energy intake and dichlorvos during gestation on reproductive performance of gilts and some chemical characteristics of the offspring. Journal of animal science. 1970; 31(5):907–16. PMID: 5481266
57.
Mersmann H. Metabolic Patterns in the Neonatal Swine1. Journal of animal science. 1974; 38(5):1022– 30. PMID: 4596886
58.
Andersen IL, Nævdal E, Bøe KE. Maternal investment, sibling competition, and offspring survival with increasing litter size and parity in pigs (Sus scrofa). Behavioral ecology and sociobiology. 2011; 65 (6):1159–67. https://doi.org/10.1007/s00265-010-1128-4 PMID: 21743767
PLOS ONE | https://doi.org/10.1371/journal.pone.0209233 December 14, 2018
17 / 18
Force generating capacity and muscle composition of the piglet hind limb
59.
De Vos M, Huygelen V, Willemen S, Fransen E, Casteleyn C, Van Cruchten S, et al. Artificial rearing of piglets: Effects on small intestinal morphology and digestion capacity. Livestock Science. 2014; 159:165–73.
60.
Baxter E, Lawrence A, Edwards S. Alternative farrowing accommodation: welfare and economic aspects of existing farrowing and lactation systems for pigs. Animal. 2012; 6(01):96–117.
61.
Glucksmann A. Sexual dimorphism in mammals. Biological Reviews. 1974; 49(4):423–75. PMID: 4616731
PLOS ONE | https://doi.org/10.1371/journal.pone.0209233 December 14, 2018
18 / 18