May 20, 2017 - A study in the district of West Bengal also clarified that although cropping ..... Groundwater in Murshidabad District of West Bengal, India.
FOOD POLICY ANALYSIS
How small is better? Small farms in Indian Agriculture Nayan Kumar Soren 20/05/2017
Instructor: Prof. M H Suryanarayana
Abstract This paper aims at exploring a basic question that how small farms are important in farm systems and food grains production. To explain this question we have showed that small farms have higher crop intensity than larger farms and inverse relationship between average farm size and cropping intensity also support this claim. Small farms have higher crop intensity since they try to grow more crops to obtain full benefit from available land. Evidence from Indian states suggests that they cultivate approximately half of the area of the farms used to cultivate food grains. Small farms occupy more than half of the agricultural land in the states of India where food grains yield is high which implies that small farms play an important role in determining food grains yield. In a nutshell, our motive is to show how small farms are better in land use efficiency and how they are important for food production. JEL Classification: Q15, Q12 Keywords: Small farms, Food grains, Crop Intensity, land use
1
1. Introduction Agriculture sector plays a greater role in the development of a country which is mainly an agrarian economy. India is a country where large number of population relies on agriculture for their livelihoods. Development of agriculture sector is considered as pre requisite for economic prosperity as discussed by Rostow in the stages of economic growth. Farmers who are the main agents of agricultural development always have different size of land ownership. There is an old debate on “small is beautiful or big is better” where smaller farms have advantage of better productivity while larger farms have advantage of resource availability. Better productivity of small farms has been clarified by inverse relationship between farm size and productivity in a bunch of literature in agricultural economics. Various studies are done to estimate the number of small farms which shows that small farms has dominated the world agriculture in terms of landholdings as well as production. Key actors of green revolution are struggling today because of various exogenous shocks supermarket culture and global trade. Evolution of market structure especially after globalization and climate change has made farming a risky business. Debate on the role of family farmers in agriculture was slowing down until SOFA1, (2014) outlined comprehensive assessment of family farms around the world and showed that why family farms are still important. Various studies on distribution of small farms suggest that small family farmers are the main actors in the global agriculture system. When agriculture farm is considered economies of scale don’t work like manufacturing sector firms. They are an important agent for boosting agriculture production due to their higher crop intensity. Small farms are also crucial for food production because they use more land than larger farm size for food production. The objective of this paper is to carry out preliminary assessment to show the importance of small farms in terms of land use efficiency for crop production and how they are important for food production. Towards this objective this paper has been divided into four main sections. Section 1 clarifies the subject matter and objectives of the paper. Section 2 provides review of literature related to small farms. Section 3 data used in the analysis and brief description of data. Section 4 is devoted to results and discussion on how small farms are better in terms of crop intensity and relationship between farm size and crop intensity. It also shows how small farms are important for food production across states and finally section 5 summarizes all the discussions and findings.
1
State of the Farming and Agriculture http://www.fao.org/3/a-i4040e.pdf
2
2. Literature Review Productive efficiency of smaller farms than larger farms has been studied intensively in the literature of agriculture economics. Debate on efficiency of small farms is still going on to explore the fact that small farms are still relevant or not. On efficiency of small farms Small farms obviously have greater advantage of abundant labor availability due to limited availability of land. Usually small farms employ family labor where self-motivation results in greater productive efficiency of labor. Therefore, small farms tend to use labor more intensively to get more production from the same amount of land. They cultivate the same land twice or thrice using more inputs per unit of land due to which small farms have higher crop intensity than large farms. (Dyer, 2014 Chand et al. 2011 Shah, 2008, Dev 2012) In many studies it has been proved that crop intensity varies inversely with size. As farm size decreases crop intensity increases which imply that small farms are using the land more intensively and getting more production by cultivating more. Higher crop intensity shows that small farms are not far behind than the large farms despite of greater technological advantage of larger farms (Chadha & Sharma, 1982 Narain & Roy,1980) Higher crop intensity is also considerd as one of the major determinants of agricultural prductivity since small farms obtain more output due to higher crop intensity. (Chand et al. 2011) Higher crop intensity of small farms always keep them ahead of large farms. Here, the question is obvious that what are the factors which drives the crop intensity. Availability of water for agriculture is very important either through rainfall or different irrigation techniques. Since rainfall is a natural phenomenon and is not uniform across regions, cropping two or three times in the absence of rainfall is not possible. (Sampath, 1992) Irrigation has been considered as the most important factor of determining crop intensity (Narain & Roy,1980 Chand et al. 2011) but sometimes irrigation may not be relevant as Dyer (2014) didn’t find it significant in case of Egypt but in case of India it was significant. A study in the district of West Bengal also clarified that although cropping intensity and irrigation intensity are correlated but crop intensity also depends upon other factors. (Haque, 2015) Other factors may have some influence but higher crop intensity is definitely a result of greater incentive for small farms. For instance, crop yield under the influence of natural factors of land and population pressure in Assam was found as an important determinant of crop intensity. (Singh & Sharma, 2010) To some extent it can be said that in higher crop yield area we should be able to observe small farms since they have higher crop intensity. Newell et al.(1997) concluded that usually farms tend to be small in fertile regions while farms are usually tend to be large in less fertile regions. Vijay (2016) also supported the stated argument that favourable soil supports the economic structure dominated by small and marginal farms. 3
Small farms are crucial for food production In agriculture, land use only specifies how land is being utilised the for production of crops. In terms of land use and productivity small farms are efficient but what they produce is also important. Crop pattern shows crop producing behavior of farms and it differs with farm size (Rahman, 2008) as small farms tend to plant food crops in place of commercial crops while medium and large farmers diversify their crops and allocate their farms for different crops. (Kadapatti and Bagalkoti, 2012) Similarly, Dev (2012) found that small and marginal farms tend to grow high value crops as well as crops with quick return possibilities (i.e. fruits) A study carried out in El Salvador shows that 80 percent of farmers are smallholders but they account for 70 of total food grain production. (Patricia et al. 2015) Small farms are also known as predominant form of food producing group in the world and they cultivate major crops in the small parts of land.2 (FAO, 2014) Small farm holders use roughly 30% area of total cultivable land but they produce more than half of the calories produced worldwide and half of the global production of major crops. (Samberg et al, 2016) 3. Data Used Present discussions centering around small and marginal farms primarily are based on secondary data obtained from Agriculture Census of India, 2010-11 and some supplementary data sources like Agriculture Statistics at a glance. Agriculture census is conducted in India in every five years. It provides data of average farm size; total farm holdings segregated by size group (definitional, i.e. marginal) and size class (i.e. 0.5-1 ha) from tehsil level to country level. For analytical purpose state wise data of cropping pattern, gross cropped area tenancy and land use data has been used for all social groups. For simplicity of analysis only individual operational holding is taken. Throughout the analysis small farms refers to traditional classification of small farms (below 2 ha. Size) in the Indian context. 4. Results and Discussion Crop Intensity There are multiple ways of increasing agricultural production. Either we can increase the land under cultivation or we can cultivate in the same land two or three times. Due to limited supply of land, using same land more than once is considered as best solution to get more output from the same land. The no. of times we are growing crops in the same land during an agricultural year is defined as cropping intensity. Crop intensity is calculated by the given formula: CI = 2
http://www.fao.org/docrep/019/mj760e/mj760e.pdf
4
Net area sown has been defined as the area sown more than once during an agricultural year but considered only once. Gross cropped area has been defined as the area effectively cultivated during an agricultural year. (For example: if a farmer has only 3 Acres of land but he uses 3 acres first time and 2 acres second time then gross cropped area will be 5 acres) Table 1: Crop intensity of different farm size group (in %) Year
Marginal
Small
Semi-Medium
Medium
Large
All Group
1995-96
141
129
126
126
121
129
2000-01
139
126
123
123
119
126
2005-06
142
131
128
130
126
132
2010-11
140
135
136
139
137
137
Change
-1
6
10
13
16
8
Source: Own Calculations from Agriculture Census Table 2: Crop intensity under Irrigated Land (%) Year
Marginal
Small
Semi-Medium
Medium
Large
All Group
1995-96
67
51
48
47
40
51
2000-01
71
51
48
48
42
52
2005-06
79
62
59
60
53
63
2010-11
71
58
60
63
56
62
Change
4
7
12
16
16
11
Source: Own Calculations from Agriculture Census In the table 1 crop intensity of different farm size group during four different agricultural years has been shown. It is observed clearly that smaller the farm sizes higher the crop intensity. Over the years crop intensity of marginal farms are stagnant but in other farm size groups, crop intensity has been increased. During 1995-96 to 2010-11 crop intensity of marginal farms remained stable and crop intensity is larger in larger size groups. In irrigated land, trend is almost similar as earlier where crop intensity is increasing with smaller farm size. In unirrigated land no farm has clear advantage and crop intensity of all farm size groups has decreased and in marginal farm size group decrease in crop intensity is highest. Overall, crop intensity of marginal and small farms is better than higher farm size group which is also true for irrigated land. In unirrigated land, smaller farm size group has less crop intensity than larger farm size. Here, irrigation factor plays a greater role in determining crop intensity of different farm size groups. But important point to note is that crop intensity in unirrigated land has decreased for all farms. 5
Table 3: Crop intensity under Unirrigated Land (%) Year Marginal Small Semi-Medium
Medium
Large
All Group
1995-96
67
51
48
47
40
51
2000-01
71
51
48
48
42
52
2005-06
79
62
59
60
53
63
2010-11
71
58
60
63
56
62
Change
4
7
12
16
16
11
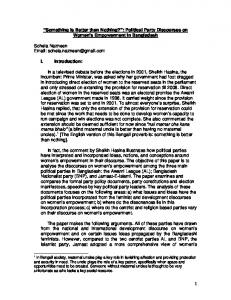
Source: Own Calculations from Agriculture Census Crop intensity and farm size Above discussion clarifies that smaller farm has higher crop intensity except in the case of unirrigated land. To confirm the idea that farm size vary inversely with crop intensity, data for average farm size and crop intensity for different states of year 2010-11 has been taken to calculate the correlation coefficient. (Figure 1) Figure 1 Correlation between Crop Intensity and Farm size 7
r = -0.70056
Avg. farm Size (in Ha)
6 5 4 3 2 1 0 100.00 -1
120.00
140.00
160.00
180.00
200.00
220.00
Crop Intensity (in %)
Source: Own calculations from Agriculture Census 2010-11 Correlation coefficient for crop intensity and farm size is -0.7 which means that there is moderately strong negative association between these two variables. It also implies the fact that states where farm size average is less are better in terms of crop intensity. Value of correlation 6
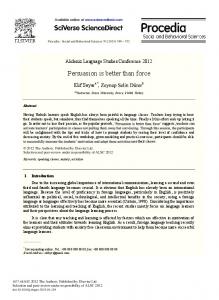
indicates that there is moderately strong association between the two variables crop intensity and average farm size. Small farms and food grains production Crop behavior varies with farm size and small and large farms tend to plant the crop to draw greater benefit. Small farms plant the crop as per household needs and large farms basically produce for income. Evidences suggest that small farms play greater role in food production. Here, we have taken evidence from some Indian states where it can be observed that in 18 states out of 35 states, small farms cultivate food grains in more than 50 percent of the land out of total land cultivated by all farm size groups for food grains. (Figure 2) Figure 2: Percentage of area farmed by small farms of total farming area by all farm size (Total Food grains)
% of farmed area
Below 40 40-50 50-60 60-70 70-80 More than 80 0
2
4 6 Number of states
8
10
12
Source: Own calculations from Agriculture Census 2010-11 If we include those states where more than 40 percent of area is being cultivated by small farms then we get 6 more states in the tally. It is important to note that in the states where less than 40 of area are being cultivated by small farms, small farms make small share of land in those states. (See appendix: Table 1) Similarly these states consist of small percentage share of small farms. In those states where small farms have a greater share of land holdings food grains are grown mainly by smallholders. How these small farms are distributed? We have already showed that small farms are important for food grain production and they use large share of area under food grains production in all size groups. Due to their productive efficiency, they contribute more to food production. In the four graphs, distribution of farms has been shown in the different states grouped on the basis of foodgrains yield. Here we don’t intend to prove the inverse relationship between farm size and agriculture productivity, but we are showing that what is the importance of small farms in foodgrains production. 7
Figure 3: States with foodgrains yield (From high to low quartile) States with Foodgrains yield (Q1) 60
Holding
Area
States with Foodgrains yield (Q2) 60
50
50
40
40
% 30
% 30
Holding
Area
20
20
10
10
0
0
Farm Size Class (Ha)
Farm size class (Ha)
States with Foodgrains yield (Q3) 40
Holding
Area
35
`
States with Foodgrains yield (Q4) 30
Holding
Area
25
30
20
25
% 15
% 20 15
10
10 5
5 0
0
Farm Size Class (Ha)
Farm Size Class (Ha)
Source: Own calculations from Agriculture Census 2010-11 Data of number of farm holdings and area occupied in the different farm size class has been taken from all Indian States except Telangana. States were ranked on the basis of their average foodgrains yield during the period 2010-11 and 2014-15.3 Further, these states has been divided into four quartiles Q1, Q2, Q3 and Q4 from higher to lower foodgrains yield. (See appendix: Table 1) Distribution of farm holdings and area occupied in the different farm size class has been shown in the four graphs. Starting from the states with high foodgrains yield change in distribution of farm holdings and area occupied can be observed. Each bar in the graph shows cumulative percentage share of farm class size. 3
Agriculture Statistics at a glance (Appendix Table 2)
8
Large number of farm holdings lie in marginal and small size class with negligible holdings in the upper size class. In all the graphs it is clear that marginal farm holdings are decreasing as we move towards states with low foodgrins yield. Farms with class size 2 hectare and below occupies largest share of holdings as well as largest share of area in first two categories of states. Large number of farm holdings lie in marginal and small size class with negligible holdings in the upper size class and they have made up share of more than 75 percent in all the categories. It is important to note that area occupied by small farms is decreasing as we move towards group of states with low foodgrains yield whereas area occupied by large firms is increasing. Land holding of small farms are more or less same in all categories but with lower foodgrains yield group marginal farm holdings with size class 0.5 and less are declining. In Q3 and Q4, it can be seen that small farms occupy less than fifty percent of land which implies that marginal farms are less likely to survive in the region with low yield potential. In the states with low food grains yield area occupied by large farms is increasing. Distribution of farms vary with high yield region to low yield region. Regions with high foodgrains yield seems as obvious hotspots of marginal and small farms as we see that food grains are mostly produced by small farms and are more efficient in productivity. Another way to interpret distribution of farms is where small and marginal farms occupy highest area yield of food grains are higher. In the states with lower foodgrains yield, holdings and area occupied by small and marginal farm has less cumulative share as compared to states with high foodgrains yield. 5. Conclusion Small farms always have advantage of being small and they try to obtain better output from the same land either through increasing number of crops in land or increasing any other inputs. In all conditions, small farms are better in crop intensity than other farms. Still small farms are better in terms of crop intensity but crop intensity of marginal farms is stagnant and crop intensity of other farm size group is increasing. With larger farm size, crop intensity is increasing more which implies that perhaps small farms are not able to increase gross cropped area now due to lack of access to modern inputs. Negative correlation also verifies the fact that there is an inverse relationship between small farm size and crop intensity. Small farms are also very crucial to produce food grains and evidence from Indian states indicates that they still are an important part of our food system. Small farms are considered as vital part of food production since they use large portion of land for food grains production. They also occupy larger share of area where food grains yield is high and occupy lesser area in the states where food grains yield is low. Since small farms have maximum share of land under food grains production conclusion can be derived that they play greater role in determining food grains yield.
9
REFERENCES 1. Chadha, G. K., & Sharma, R. K. (1982). Farm Size, Irrigation and Intensity of Land use in Indian Agriculture. Artha Vijnana, 24(1), 15-28. 2. Chand, R., Prasanna, L. P., & Singh, A. (2011). Farm Size and Productivity: Understanding the Strengths of Smallholders and Improving Their Livelihoods. Economic and Political Weekly, 5-11. 3. Dev, M. (2012, June). Small Farmers in India: Challenges and Opportunities. Retrieved March 20, 2017, from IGIDR Working Paper: http://www.igidr.ac.in/pdf/publication/WP-2012-014.pdf 4. Dyer, G. (2014). A closer look at the inverse relationship in the context of Agrarian Transition: Evidence from fieldwork in rural Egypt. In G. Dyer, Class, State and Agricultural Productivity in Egypt: Study of the Inverse Relationship between Farm Size and Land Productivity (pp. 113-132). London: Frank Cass. 5. Greig, L. (2009). An Analysis of the Key Factors Influencing Farmer’s Choice of Crop, Kibamba Ward, Tanzania. Journal of Agricultural Economics,60(3), 699-715. 6. Haque, S. (2015). Impact of Irrigation on Cropping Intensity andPotentiality of Groundwater in Murshidabad District of West Bengal, India. International Journal of Ecosystem, 5(3A), 55-64. 7. Jehangir, W. A., Qureshi, A. S., & Ali, N. (2002). Conjunctive Water Management in the Rechna Doab: An Overview of Resources and issues. (Vol.48) Lahore: International Water Management Issues. 8. Kadapatti, R., & Bagalkoti, S. (2012). Farm Size and Cropping Pattern: A Case Study of Dharwad District in Karnataka State. International Journal of Science and Research , 2147-2152. 9. Narain, D., & Roy, S. (1980). Impact of Irrigation and Labor availability on Multiple Cropping: A case study of India. (Vol. 20) Washington: IFPRI. 10. Newell, A., Pandya, K., & Symons, J. (1997). Farm Size and the Intensity of Land Use in Gujarat. Oxford Economic Papers, 49(2), 307-315. 11. Rahman, S. (2008). Determinants of Crop Choices by Bangladeshi Farmers: A Bivariate Probit Analysis. Asian Journal of Agriculture and Development, 5(1), 29-41. 12. Samberg, L., Gerber, J., Ramankutty, N., Herrero, M., & West, P. (2016). Subnational distribution of average farm size and smallholdercontributions to global food production. Environmental Research Letters, 11(12). 10
13. Sampath, R. K. (1992). Farm Size and land use intensity in Indian Agriculture. Oxford Economic Papers. 44(3), 494-501. 14. Shah, M. (2008). Cropping intensity and farm size: A case study of Chashma Right Bank Canal. Journal of Managerial Sciences, 105-110. 15. Singh, R., Kumar, A., Singh , K., & Kumar, A. (2014, August 15). Agricultural production performance on small farm holdings: some empirical evidences from Bihar, India. Retrieved April 10, 2017, from Munich Personal RePEc Archive: https://mpra.ub.uni-muenchen.de/59680/1/MPRA_paper_59680.pdf 16. Singh, S., & Sharma, B. (2010). Determinants of crop intensity in the Assam Plains. The Geographer, 58-72. 17. Vijay, D. (2016). Small Farms in a Fertile Tract. Economic & Political Weekly, 51(5) 8087.
11
APPENDIX Table 1 Percentage of area farmed by small farms of total farming area by all farm size (Total Food grains) State % of holdings % of area farmed A & N ISLANDS 34.68 19.26 ANDHRA PRADESH 84.74 59.62 ARUNACHAL PRADESH 36.57 17.60 ASSAM 84.78 50.87 BIHAR 96.92 76.29 CHANDIGARH 80.79 43.40 CHATTISGARH 80.02 43.71 D & N HAVELI 82.31 50.01 DAMAN & DIU 98.18 85.70 DELHI 75.67 36.95 GOA 89.53 69.78 GUJARAT 66.87 30.82 HARYANA 67.56 23.21 HIMACHAL PRADESH 87.89 63.96 JAMMU & KASHMIR 94.48 73.60 JHARKHAND 82.24 43.08 KARNATAKA 73.45 41.98 KERALA 94.03 69.71 LAKSHADWEEP 60.00 13.79 MADHYA PRADESH 69.97 35.09 MAHARASHTRA 77.20 47.05 MANIPUR 83.38 61.38 MEGHALAYA 76.60 45.54 MIZORAM 86.38 69.93 NAGALAND 15.04 6.31 ODISHA 91.83 73.45 PUDUCHERRY 91.00 66.22 PUNJAB 34.03 9.26 RAJASTHAN 57.11 19.93 SIKKIM 76.01 35.42 TAMIL NADU 91.27 69.32 TRIPURA 94.89 80.65 UTTAR PRADESH 91.71 66.09 UTTARAKHAND 90.20 66.30 WEST BENGAL 95.75 84.50 India 83.75 47.81 Source: Own calculations from Agriculture Census 2010-11
12
Table 2: States in different quartiles Quartile Food Grains Yield
States Punjab, Delhi, Haryana, West Bengal, Tripura, Tamilnadu, Pondicherry, Kerala, Andhra Pradesh
Q1
Yield>2540.4214
Q2
Yield>1958.58 and Yield
Q3
Yield>1623.4361 and Yield 1958.58
Q4
2540.4214
Goa, Uttar Pradesh, Andaman & Nicobar, Meghalaya, Bihar, Nagaland, Manipur Gujarat, Uttarakhand, Himachal Pradesh, Assam, Arunachal, Jharkhand, Daman & Diu, Jammu & Kashmir, Karnataka MP, Odisha, Dadar & Nagar Haveli, Sikkim, Mizoram, Chhattisgarh, Rajasthan, Maharashtra
1623.4361
Source: Own calculations from Agriculture Statistics at a Glance 2014-15
13