How to Train Good Word Embeddings for Biomedical NLP Billy Chiu
Gamal Crichton Anna Korhonen Sampo Pyysalo Language Technology Lab DTAL, University of Cambridge {hwc25|gkoc2|alk23}@cam.ac.uk,
[email protected]
Abstract
Although word embeddings have been studied extensively in recent work (e.g. Lapesa and Evert (2014)), most such studies only involve general domain texts and evaluation datasets, and their results do not necessarily apply to biomedical NLP tasks. In the biomedical domain, Stenetorp et al. (2012) studied the effect of corpus size and domain on various word clustering and embedding methods, and Muneeb et al. (2015) compared two state-of-the-art word embedding tools: word2vec and Global Vectors (GloVe) on a word-similarity task. They showed that skip-gram significantly out-performs other models and that its performance can be further improved by using higher dimensional vectors. The word2vec tool was also used to create biomedical domain word representations by Pyysalo et al. (2013) and Kosmopoulos et al. (2015). Given that word2vec has been shown to achieve state-of-the-art performance that can be further improved with parameter tuning, we focus on its performance on biomedical data with different inputs and hyper-parameters. We use all available biomedical scientific literature for learning word embeddings using models implemented in word2vec. For intrinsic evaluation, we use the standard UMNSRS-Rel and UMNSRS-Sim datasets (Pakhomov et al., 2010), which enable us to measure similarity and relatedness separately. For extrinsic evaluation, we apply a neural network-based named entity recognition (NER) model to two standard benchmark NER tasks, JNLPBA (Kim et al., 2004) and the BioCreative II Gene Mention task (Smith et al., 2008). Apart from showing that the optimization of hyper-parameters boosts the performance of vectors, we also find that one such parameter leads to contradictory results between intrinsic and extrinsic evaluations. We further observe that a larger corpus does not necessarily guarantee better re-
The quality of word embeddings depends on the input corpora, model architectures, and hyper-parameter settings. Using the state-of-the-art neural embedding tool word2vec and both intrinsic and extrinsic evaluations, we present a comprehensive study of how the quality of embeddings changes according to these features. Apart from identifying the most influential hyper-parameters, we also observe one that creates contradictory results between intrinsic and extrinsic evaluations. Furthermore, we find that bigger corpora do not necessarily produce better biomedical domain word embeddings. We make our evaluation tools and resources as well as the created state-of-the-art word embeddings available under open licenses from https://github.com/ cambridgeltl/BioNLP-2016.
1
Introduction
As one of the main inputs of many NLP methods, word representations have long been a major focus of research. Recently, the embedding of words into a low-dimensional space using neural networks was suggested (Bengio et al., 2003; Collobert and Weston, 2008; Turian et al., 2010; Mikolov et al., 2013b; Pennington et al., 2014). These approaches represent each word as a dense vector of real numbers, where words that are semantically related to one another map to similar vectors. Among neural embedding approaches, the skip-gram model of Mikolov et al. (2013a) has achieved cutting-edge results in many NLP tasks, including sentence completion, analogy and sentiment analysis (Mikolov et al., 2013a; Mikolov et al., 2013b; Fern´andez et al., 2014). 166
Proceedings of the 15th Workshop on Biomedical Natural Language Processing, pages 166–174, c Berlin, Germany, August 12, 2016. 2016 Association for Computational Linguistics
Corpus PubMed PMC PubMed + PMC
Total tokens 2,721,808,542 7,959,548,841 10,681,357,383
Parameters neg samp min-count
Table 1: Corpus statistics
alpha dim win
sults in our tasks. We hope that our results can serve as a reference for researchers who use neural word embeddings in biomedical NLP.
2
Corpora and Pre-processing
then build vectors by varying values of one hyperparameter (Table 2) and keeping others as default. We repeat the process for every hyper-parameter under examination. We then report the results of these sets of vectors in our intrinsic and extrinsic evaluations.
We use two corpora to create word vectors: the PubMed Central Open Access subset (PMC) and PubMed. PMC is a digital archive of biomedical and life science literature, which contains more than 1 million full-text Open Access articles. The PubMed database has more than 25 million citations that cover the titles and abstracts of biomedical scientific publications. A version of PMC articles is distributed in text format1 whereas PubMed is distributed in XML. Thus, we use a PubMed text extractor2 to extract title and abstract texts from the PubMed source XML. Both PubMed and PMC were pre-processed with the Genia Sentence Splitter (GeniaSS) (Sætre et al., 2007), which is optimized for bio-medical text. We further tokenize the sentences with the Tree bank Word Tokenizer provided by the NLTK python library (Bird, 2006). The corpus statistics are shown in Table 1. 2.2
0.0125 / 0.025 / 0.05 / 0.1 25 / 50 / 100 / 200 / 400 / 500 / 800 1 / 2 / 4 / 5 / 8 / 16 / 20 / 25 / 30
Table 2: Hyper-parameters and tested values. Default values shown in bold.
Materials and Methods
2.1
Values 1 / 2 / 3 / 5 / 8 /10 / 15 0 / 1e-1 / 1e-2 / 1e-3 / 1e-4 1e-5 / 1e-6 / 1e-7 / 1e-8 / 1e-9 0 / 5 / 10 / 20 / 50 / 100 / 200 400 / 800 / 1000 / 1200 / 2400
2.3
Hyper-parameters
We test the following key hyper-parameters: Negative sample size (neg): the representation of a word is learned by maximizing its predicted probability to co-occur with its context words, while minimizing the probability for others. However, the normalisation of this probability involves a denominator deriving from co-occurrences between words and all their contexts in the corpus, which is time-consuming to compute. To address this issue, negative sampling only calculates the probability with reference to a set number of other randomly chosen negative words (neg). Sub-sampling (samp): Sub-sampling refers to the process of reducing occurrences of frequent words. It selects words appearing with a ratio higher than the threshold samp, and ignores each occurrence with a given probability. The process is used to minimise the effect of non-informative frequent words in training. Very frequent words (e.g. in) are less informative because they co-occur with most words in the corpus. For example, a model can benefit more from seeing an occurrence of p16 with CDKN2 than an instance of the frequent co-occurrence of p16 with in. Minimum-count (min-count): The minimumcount defines the minimum number of occurrences required for a word to be included in the word vectors. This parameter allows control the over the size of the vocabulary and, consequently, the resulting word embedding matrix. Learning Rate (alpha): neural networks are trained by gradually updating weight vectors
Word vectors
Factors that affect the performance of word representations include the training corpora, the model architectures, and the hyper-parameters. To assess the effect of corpora, we generate three variants of each set of word vectors: one from PubMed, one from PMC, and one from the combination of the two (PMC-PubMed). To study how preprocessing affects word vectors, we create vectors from the original text corpora, lower-cased variants, and variants where sentences are shuffled in random order. We further generate two sets of vectors, one by applying the skip-gram model and one applying the CBOW model, built with the default hyperparameter values of word2vec. We first evaluate these vectors to determine the better-performing model architecture. Using the better model, we 1
http://www.ncbi.nlm.nih.gov/pmc/ tools/ftp/#Data_Mining 2 https://github.com/spyysalo/pubmed
167
Vector PMC-PubMed (Pyysalo et al.) PMC (Pyysalo et al.) PubMed (Pyysalo et al.) PubMed (Kosmopoulos et al.)
Token 5,487,486,225 (total) 2,591,137,744 (total) 2,896,348,481 (total) 1,701,632 (distinct)
learned word vectors. Afterwards, we compare the two scores using Spearman’s correlation coefficient (ρ), which is a standard metric to compare ranking between variables regardless of scale in word similarity task. We systematically ignore words that appear only in the reference but not in our models.
Table 3: Baseline word vectors along a gradient to minimize an objective function. The magnitude of these updates is controlled by the learning rate. Vector dimension (dim): The vector dimension is the size of the learned word vector. While a higher dimension tends to capture better word representations, their training is more computationally costly and produces a larger word embedding matrix. Context window size (win): The size of the context window defines the range of words to be included as the context of a target word. For instance, a window size of 5 takes five words before and after a target word as its context for training. We refer to Mikolov et al. (2013a) and Levy et al. (2015) for further details regarding these parameters. 2.4
2.6
Given that the ultimate evaluation for word vectors is their performance in downstream applications, we also assess the quality of the vectors by performing NER using two well-established biomedical reference standards: the BioCreative II Gene Mention task corpus (BC2) (Smith et al., 2008) and the JNLPBA corpus (PBA) (Kim et al., 2004). Both of these corpora consist of approximately 20,000 sentences from PubMed abstracts manually annotated for mentions of biomedical entity names. Following the window approach architecture with word-level likelihood proposed by Collobert and Weston (2008), we apply a tagger built on a simple feed-forward neural network, with a window of five words, one hidden layer of 300 neurons and a hard sigmoid activation, leading to a Softmax output layer. Our word vectors are used as the embedding layer of the network, with the only other input being a low-dimensional binary vector of word surface features.3 To emphasize the effect of the input word vectors on performance, we avoid fine-tuning the word vectors during training as well as introducing any external resources such as entity name dictionaries. While this causes the performance of the method to fall notably below the state of the art, we believe this minimal approach to be an effective way to focus on the quality of the word vectors as they are created by the tool (word2vec).4 For parameter selection, we estimate the extrinsic performance of word vectors on the development sets of the two corpora using mention-level F-score. For the final experiment with selected parameters we apply the test sets and evaluation scripts of the two tasks in accordance with their original evaluation protocols.
Baseline Vectors
As baselines, we include the biomedical domain vectors created by Pyysalo et al. (2013) and Kosmopoulos et al. (2015). Their corpus statistics are shown in Table 3. All of these vectors are built with the skip-gram model with the default parameter values (see Table 2). 2.5
Extrinsic Evaluation
Intrinsic Evaluation
A standardized intrinsic measure for word representations in the biomedical domain is the UMNSRS word similarity dataset (Pakhomov et al., 2010). We use its UMNSRS-Sim (Sim) and UMNSRS-Rel (Rel) subsets as our references. They have 566 and 587 word pairs for measuring similarity and relatedness (respectively) whose degree of association was rated by participants from the University of Minnesota Medical School. In UMNSRS, the human evaluation on every word pair is converted to a score to determine its degree of similarity, a higher score implying a more similar pair. The range of the score is on an arbitrary scale. While UMNSRS provides scores to determine the degree of similarity for each word pair, we will measure this by calculating the cosine similarity score for each word pair using the
3 For example, whether a word starts or contains a capital letter or number. For detailed reference, we make our implementation openly available. 4 It is an interesting question for future work whether the findings from our extrinsic evaluation apply also to state-ofthe-art taggers.
168
Model SG CBOW SG-S SG-L SG-SL CBOW-S CBOW-L CBOW-SL
PMC-PubMed Sim Rel 0.54 0.488 0.435 0.409 0.555 0.515 0.542 0.457 0.543 0.47 0.415 0.403 0.452 0.404 0.461 0.422
PMC Sim Rel 0.507 0.453 0.348 0.351 0.54 0.49 0.502 0.424 0.52 0.459 0.434 0.424 0.447 0.41 0.45 0.39
PubMed Sim Rel 0.446 0.497 0.449 0.446 0.551 0.502 0.552 0.47 0.56 0.481 0.43 0.414 0.461 0.425 0.471 0.426
60 55
Table 4: Intrinsic evaluation results for vectors with different pre-processing: Original Text, Sentence-shuffled (S), lowercased (L), and both (SL) Model SG CBOW SG-S SG-L SG-SL CBOW-S CBOW-L CBOW-SL
PMC-PubMed BC2 PBA 60.86 61.89 55.11 56.97 59.81 62.13 60.52 62.19 61.33 62.58 51.84 56.78 53.72 57.09 52.89 57.15
PMC BC2 PBA 59.48 62.11 54.93 58.10 59.23 62.30 59.93 61.64 60.23 62.05 54.22 58.02 54.57 57.51 52.63 56.80
45
3.1
0
5
neg
10
15
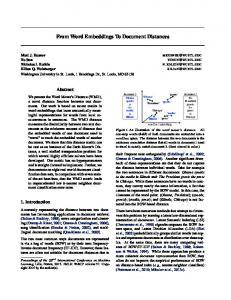
Figure 1: Average intrinsic and extrinsic evaluation results for negative sampling (Unit: ρ: dashed line, F-score: solid line)
PubMed BC2 PBA 61.00 62.52 54.25 58.48 60.75 62.11 60.51 62.64 61.11 61.65 52.82 57.97 52.65 57.41 53.21 58.41
neg 1 2 3 5 8 10 15
Table 5: Extrinsic evaluation results for vectors with different pre-processing: Original text, Sentence-shuffled (S), lowercased (L), and both (SL)
3
Sim Rel BC2 PBA
50
PMC-PubMed Sim Rel 0.52 0.483 0.545 0.493 0.539 0.488 0.538 0.487 0.545 0.501 0.543 0.494 0.542 0.498
PMC Sim Rel 0.453 0.405 0.489 0.439 0.506 0.447 0.498 0.444 0.497 0.446 0.517 0.459 0.514 0.457
PubMed Sim Rel 0.505 0.483 0.511 0.475 0.532 0.482 0.54 0.494 0.543 0.507 0.553 0.499 0.542 0.491
Table 6: Intrinsic evaluation results for number of negative samples (default = 5)
Results Skip-grams vs. CBOW
From Tables 4 and 5, we see that most vectors benefit from lower-casing and shuffling the corpus sentences. Since in word2vec, the learning rate is decayed as training progresses, text appearing early has a larger effect on the model. Shuffling makes the effect of all text (roughly) equivalent. On the other hand, lower-casing ensures that same word but different cases, such as protein, Protein and PROTEIN are normalised (indexed as one term) for training. Although the shuffled-lower vectors perform better, in the following, we report further results based on the unshuffled-text vector to preserve the comparability of results.
Tables 4 and 5 (first 2 rows) show results comparing the skip-gram and CBOW models with default hyper-parameter values in intrinsic and extrinsic evaluation, respectively. In general, the skip-gram vector shows better results than CBOW in both the word similarity task and in entity mention tagging. In CBOW, the representations of a group of context words are learned through predicting one focus word, with the prediction back-propagated averaged over all context words. By contrast, in skip-gram, the representation of a focus word is learned by predicting every other context word in the window separately, with the prediction error of each context word back-propagated to the target word. This may allow better vectors to be learned as a focus word is trained over more data, but with less smoothing over contexts. Our result is consistent with that of many previous studies, including that of Muneeb et al. (2015), who compared model architectures on different vector dimensions and reported that skip-gram outperforms CBOW in biomedical domain tasks.
3.2
Hyper-Parameters
We next show that four out of the six hyperparameters only improve performance notably in the intrinsic task but not the extrinsic one, while one boosts figures in both tasks to a great extent. Lastly, one of them shows opposite effects on intrinsic and extrinsic evaluations. 169
neg 1 2 3 5 8 10 15
PMC-PubMed BC2 PBA 60.78 62.29 60.41 62.03 59.37 62.42 60.37 61.90 60.90 62.19 59.65 62.80 61.09 61.52
PMC BC2 PBA 59.90 61.52 59.44 60.49 59.55 62.02 59.44 62.12 59.49 62.55 59.58 61.61 59.92 60.98
PubMed BC2 PBA 60.80 61.71 59.59 62.63 60.52 62.45 60.44 62.56 60.23 62.68 61.53 62.03 60.12 63.18
samp None 1e-1 1e-2 1e-3 1e-4 1e-5 1e-6 1e-7 1e-8 1e-9
Table 7: Extrinsic evaluation results for number of negative samples (default = 5)
PMC Sim Rel 0.465 0.419 0.476 0.42 0.471 0.418 0.497 0.442 0.521 0.459 0.55 0.507 0.511 0.491 0.401 0.37 0.074 -0.016 -0.076 -0.183
PubMed Sim Rel 0.514 0.451 0.507 0.46 0.513 0.471 0.545 0.494 0.578 0.54 0.589 0.546 0.546 0.528 0.336 0.306 -0.061 -0.146 0.078 0.147
Table 8: Intrinsic evaluation results for sub-sampling (default = 1e-3)
60 40 20
samp None 1e-1 1e-2 1e-3 1e-4 1e-5 1e-6 1e-7 1e-8 1e-9
Sim Rel BC2 PBA
0 0
2
4 6 samp 1e−1
8
PMC-PubMed BC2 PBA 60.46 61.76 61.31 60.99 60.01 62.51 60.30 61.99 60.93 62.73 60.58 61.39 60.00 61.67 57.52 61.17 47.35 50.41 33.09 33.13
PMC BC2 PBA 58.83 61.35 59.60 62.45 59.86 61.63 59.78 61.95 59.87 60.91 60.35 61.26 57.94 60.31 57.04 59.70 44.22 47.23 32.30 32.68
PubMed BC2 PBA 60.51 62.00 60.47 62.69 60.29 62.92 59.87 62.57 60.51 62.22 58.98 62.60 59.02 61.35 52.44 57.34 31.23 32.15 27.40 28.70
Table 9: Extrinsic evaluation results for sub-sampling (default = 1e-3)
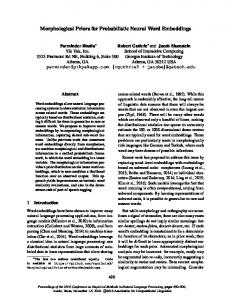
Figure 2: Average intrinsic and extrinsic results for sub-sampling (0 = None) (Unit: ρ: dashed line, F-score: solid line) 3.2.1
PMC-PubMed Sim Rel 0.529 0.476 0.542 0.496 0.521 0.464 0.545 0.5 0.56 0.506 0.594 0.542 0.601 0.558 0.519 0.475 0.09 0.055 -0.074 -0.166
60
Negative Sampling, Sub-sampling, Min-count and Learning Rate
55
Intuitively, larger values of the neg parameter could be expected to benefit the training process by providing more (negative) examples, but we can only see a benefit in the intrinsic result (Figure 1). The performance of word vectors on the intrinsic task generally improves as neg increases from 1 to 8 (Table 6), whereas extrinsic task performance remains approximately the same (Table 7). We refer to Levy et al. (2015) for further analysis of the effect of the skip-gram parameter in a general domain context. Regarding sub-sampling, a lower threshold gives more words a probability of being downsampled. From Figure 2, it appears that also subsampling has a large effect on the intrinsic task, where most figures increase substantially before samp = 1e-6 (Table 8). After samp = 1e-7, figures in both measures drop dramatically. While some extremely frequent words (e.g. the) are effectively non-informative, other common words may be important for modeling word meaning. Thus, when the sub-sampling threshold decreases
Sim Rel BC2 PBA
50 45
0
600
1,200 1,800 2,400 min-count
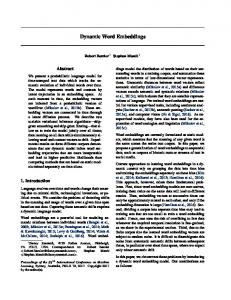
Figure 3: Average intrinsic and extrinsic evaluation results for min-counts (Unit: ρ: dashed line, F-score: solid line) continuously, a substantial amount of informative frequent words are downsampled, leading to an ineffective learning of the representation. Words occurring fewer than min-count times will be completely removed from the corpus, resulting in fewer words in the word vectors. From Figure 3, most of the results show limited effect for this parameter, excepting a notable increase for PubMed vectors in the intrinsic task (Table 10). 170
min-count 0 5 10 20 50 100 200 400 800 1000 1200 2400
PMC-PubMed Sim Rel 0.543 0.498 0.534 0.485 0.536 0.487 0.531 0.499 0.551 0.523 0.546 0.508 0.547 0.513 0.555 0.522 0.55 0.492 0.551 0.503 0.56 0.506 0.565 0.485
PMC Sim Rel 0.512 0.444 0.492 0.437 0.528 0.485 0.531 0.492 0.535 0.49 0.553 0.502 0.536 0.49 0.543 0.479 0.55 0.467 0.529 0.443 0.531 0.452 0.517 0.405
PubMed Sim Rel 0.505 0.462 0.544 0.494 0.557 0.521 0.574 0.531 0.581 0.534 0.578 0.534 0.591 0.538 0.598 0.531 0.603 0.517 0.622 0.515 0.601 0.499 0.616 0.504
60 55
45 0.01
Table 10: Intrinsic evaluation results for min-count (default = 5) min-count 0 5 10 20 50 100 200 400 800 1000 1200 2400
PMC-PubMed BC2 PBA 61.04 62.03 60.56 61.83 60.42 62.48 60.64 62.92 61.32 62.17 60.59 62.37 59.87 61.39 59.75 62.08 59.35 61.79 59.98 62.08 59.26 62.34 59.49 62.44
PMC BC2 PBA 59.73 61.92 59.75 61.80 60.22 61.50 60.24 62.17 59.58 62.06 58.76 61.47 58.97 61.82 59.95 61.04 59.53 61.75 58.54 60.98 58.75 60.74 58.58 61.54
0.05 alpha
0.1
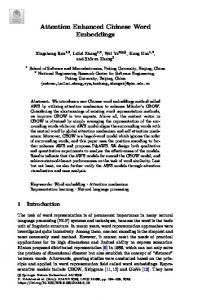
Figure 4: Average intrinsic and extrinsic evaluation results for learning rate (Unit: ρ: dashed line, F-score: solid line)
PubMed BC2 PBA 59.74 63.41 60.52 62.98 60.56 62.98 60.67 62.56 59.41 62.59 59.90 62.30 60.00 62.53 60.42 61.62 57.88 61.79 58.67 62.16 58.34 61.66 57.11 60.70
alpha 0.0125 0.025 0.05 0.1
PMC-PubMed Sim Rel 0.511 0.468 0.538 0.492 0.55 0.501 0.542 0.504
PMC Sim Rel 0.442 0.401 0.492 0.441 0.516 0.46 0.511 0.46
PubMed Sim Rel 0.508 0.475 0.543 0.493 0.584 0.532 0.583 0.543
Table 12: Intrinsic evaluation results for learning rate (default = 0.025)
Table 11: Extrinsic evaluation results for min-count (default = 5)
alpha 0.0125 0.025 0.05 0.1
However, our intrinsic evaluations, following the standard protocol, ignore words that are excluded by min-count. Hence, for PubMed vectors, when min-count = 400, only about half of the assessment items are used in intrinsic evaluation. This implies that the result in min-count > 400 only reflects the representation of frequent words. By contrast, as the out-of-vocabulary rate in extrinsic tasks is about 2.6%, its influence is less notable. The learning process will be unstable if the learning rate is too large and will be slow if it is too small. From table 12 and table 13, alpha = 0.05 appears to be an optimal value, for which most of the vectors have their best or second best results in both evaluations. 3.2.2
Sim Rel BC2 PBA
50
PMC-PubMed BC2 PBA 60.03 61.41 59.57 61.86 59.80 62.86 60.41 62.38
PMC BC2 PBA 60.24 62.04 59.86 62.16 59.54 61.25 60.40 61.94
PubMed BC2 PBA 60.57 63.29 59.83 62.68 60.77 62.65 60.30 62.64
Table 13: Extrinsic evaluation results for learning rate (default = 0.025)
60
50
Sim Rel BC2 PBA
40 0
Vector Dimension (dim)
The effect of vector dimension on our vectors is notable in all tasks (Figure 5). In Tables 14 and 15, we see a large improvement in all evaluations when the vector dimension grows. Although the improvement for extrinsic measures stops when dim > 200, it is evident that an increase from low
200
400 dim
600
800
Figure 5: Average intrinsic and extrinsic evaluation results for vector dimension (Unit: ρ: dashed line, F-score: solid line) dim gives a very substantial improvement. 171
PMC-PubMed Sim Rel 0.426 0.38 0.508 0.461 0.537 0.491 0.552 0.504 0.562 0.505 0.553 0.507 0.544 0.479
dim 25 50 100 200 400 500 800
PMC Sim Rel 0.385 0.346 0.452 0.407 0.509 0.459 0.511 0.459 0.518 0.469 0.511 0.447 0.51 0.448
PubMed Sim Rel 0.466 0.438 0.534 0.494 0.543 0.491 0.551 0.495 0.534 0.477 0.531 0.47 0.51 0.45
win 1 2 4 5 8 16 20 25 30
Table 14: Intrinsic evaluation results for vector dimension (default = 100) PMC-PubMed BC2 PBA 56.33 59.14 59.03 61.38 60.81 62.39 61.22 63.04 61.17 61.57 60.89 62.21 61.00 62.30
dim 25 50 100 200 400 500 800
PMC BC2 PBA 55.38 58.06 57.24 61.40 60.84 62.17 60.13 62.27 60.18 61.61 60.81 62.38 60.43 62.34
PMC-PubMed Sim Rel 0.419 0.377 0.488 0.43 0.528 0.477 0.545 0.494 0.562 0.516 0.589 0.535 0.66 0.558 0.6 0.543 0.605 0.541
PMC Sim Rel 0.342 0.302 0.422 0.374 0.485 0.425 0.496 0.412 0.544 0.487 0.556 0.506 0.562 0.513 0.582 0.531 0.571 0.522
PubMed Sim Rel 0.425 0.387 0.493 0.454 0.53 0.478 0.55 0.497 0.581 0.536 0.597 0.557 0.619 0.574 0.61 0.568 0.627 0.584
Table 16: Intrinsic evaluation results for context window size (default = 5)
PubMed BC2 PBA 55.77 60.26 57.57 61.75 60.38 62.88 61.24 62.68 60.54 62.50 61.03 62.36 60.59 62.92
win 1 2 4 5 8 16 20 25 30
Table 15: Extrinsic evaluation results for vector dimension (default = 100)
PMC-PubMed BC2 PBA 61.28 62.23 60.81 61.74 61.29 62.45 59.87 62.25 59.52 61.83 59.82 61.41 59.54 60.80 58.86 60.86 57.83 61.28
PMC BC2 PBA 60.18 62.44 60.83 61.59 60.43 61.43 60.08 62.51 58.78 61.26 59.40 61.30 59.92 60.92 58.91 61.41 57.61 60.53
PubMed BC2 PBA 60.93 62.70 61.11 63.01 60.74 62.86 59.47 62.80 60.40 62.74 60.18 62.62 60.02 61.76 58.98 62.79 59.22 62.83
Table 17: Extrinsic evaluation results for context window size (default = 5)
60
Parameter Corpus Architecture neg dim alpha samp win min-count
50 Sim Rel BC2 PBA
40 1
8
16 win
30
Table 18: Settings selected for comparative evaluation
Figure 6: Average intrinsic and extrinsic evaluation results for window size (Unit: ρ: dashed line, F-score: solid line) 3.2.3
Setting PubMed skip-gram 10 200 0.05 1e-4 2, 30 5
tion to primarily capture word function (Turney, 2012). It is possible that for intrinsic evaluation datasets such as UMNSRS it is more important to model topical rather than functional similarity. Conversely, it is intuitively clear that for tasks such as named entity recognition the modeling of functional similarity such as co-hyponymymy is centrally important. For further discussion on the effect of the context window size parameter, we refer to Hill et al. (2015) and Levy et al. (2015).
Context Window Size (win)
We find contradictory results from changing the size of the context window parameter (Figure 6). All three sets of vectors show a notable increase in the intrinsic measures when the context window size grows (Table 16). However, the extrinsic evaluation shows the opposite pattern (Table 17): all results in extrinsic tasks have an early perofmance peak with a narrow window (e.g. win = 1), followed by a gradual decrease when window size increases. One possible explanation may be that a larger window emphasizes the learning of domain/topic similarity between words, while a narrow context window leads the representa-
3.3
Comparative evaluation
Based on the parameter selection experiments covering three corpora (PMC, PubMed and both), various preprocessing options (normal-text, sentenceshuffled text, lower-cased text), two model architectures (skip-gram vs. CBOW) and six hyper172
PubMed, win 2 (ours) PubMed, win 30 (ours) Pyysalo et al. (PMC-PubMed) Pyysalo et al. (PMC) Pyysalo et al. (PubMed) Kosmopoulos et al. (BioASQ)
Sim 0.56 0.652 0.523 0.453 0.549 0.589
Rel 0.507 0.601 0.48 0.396 0.506 0.509
BC2 76.89 75.51 77.01 75.48 76.47 75.51
PBA 64.13 63.15 63.6 63.66 63.66 62.85
ing, which contradicts some prior in-domain results. First, we used PMC texts recently introduced by PubMed Central using an incompletely documented extraction process, and preliminary examination suggests that the proportion of nonprose text in this material may be quite high, potentially affecting learning. An alternative explanation may be that the word2vec implementation has a (somewhat hidden) “reduce-vocab” function that triggers rare-word removal when the size of the corpus crosses certain thresholds: the larger the corpus size, the more aggressive the trimming. Preliminary results suggests that this functionality may have affected PMC-PubMed, our largest corpus, to a larger extent than the other corpora. We leave the resolution of this question for future work.
Table 19: Intrinsic and extrinsic evaluation with comparison to baseline vectors parameters, we selected the best-performing options for comparative evaluation against the baseline vectors (Table 18). Since the size of the context window (win) showed contradictory results between the intrinsic and extrinsic tasks, we created vectors for two different values of this parameter. Note that for this comparative evaluation we use the test sets and test evaluation scripts of the two extrinsic tasks. Table 19 summarizes the results of the comparative evaluation. For our intrinsic tasks, our vectors with win = 30 show the best performance, clearly outperforming the baselines as well as our otherwise identically created vectors with win = 2. This further supports the suggestion that a higher context window facilitates the learning of domain similarity for the intrinsic task. For extrinsic tasks, while the difference to the baselines is smaller, our vectors with win = 2 show the best results for JNLPBA and the second best in BC2GM, while the vectors with win = 30 are clearly less competitive. The comparative evaluation on test set data thus confirms the indications from parameter selection that the context window size has opposite effects on the intrinsic and extrinsic metrics and indicates that our experiments have succeeded in creating a pair of word embeddings that show state-of-the-art performance when applied to tasks appropriate for each. 3.4
4 Conclusion and future work In this study, we show how the performance of word vectors changes with different corpora, preprocessing options (normal text, sentence-shuffled text, lower-cased text), model architectures (skipgram vs. CBOW) and hyper-parameter settings (negative sampling, sub sample rate, min-count, learning rate, vector dimension, context window size). For corpora, sentence-shuffled PubMed texts appear to produce the best performance, exceeding that of the notably larger combination with PMC texts. For hyper-parameter settings, it is evident that performance can be notably improved over the default parameters, but the effects of the different hyper-parameters on performance are mixed and sometimes counterintuitive. We have previously found a similar result in general domain work (with Wikipedia text) (Chiu et al., 2016). Several directions remain open for future work. First, in addition to tuning individual parameters in isolation, we can study the effect of tuning two or more parameters simultaneously. In addition, the number of training iterations was not considered in the experiments here, and careful tuning of this parameter both separately and jointly with associated parameters such as alpha may offer further opportunities for improvement.
Discussion
In this study, we have created vectors with PubMed, PMC and the combination of the two with a large variety of different model, preprocessing and parameter combinations. While in theory a larger corpus is expected to benefit the learning of word representations, we find that in many cases this does not hold, in particular with the combination of PubMed and PMC showing lower results than PubMed alone. We offer two possible explanations for this surprising find-
Acknowledgments This work has been supported by Medical Research Council grant MR/M013049/1
173
References
Serguei Pakhomov, Bridget McInnes, Terrence Adam, Ying Liu, Ted Pedersen, and Genevieve B Melton. 2010. Semantic similarity and relatedness between clinical terms: an experimental study. In Proceedings of AMIA, volume 2010, page 572.
Yoshua Bengio, R´ejean Ducharme, Pascal Vincent, and Christian Jauvin. 2003. A neural probabilistic language model. Journal of Machine Learning Research, pages 1137–1155. Steven Bird. 2006. Nltk: the natural language toolkit. In Proceedings of COLING/ACL demos, pages 69– 72.
Jeffrey Pennington, Richard Socher, and Christopher D Manning. 2014. Glove: Global vectors for word representation. In Proceedings of EMNLP, volume 14, pages 1532–1543.
Billy Chiu, Anna Korhonen, and Sampo Pyysalo. 2016. Intrinsic evaluation of word vectors fails to predict extrinsic performance. Proceedings of RepEval 2016.
Sampo Pyysalo, Filip Ginter, Hans Moen, Tapio Salakoski, and Sophia Ananiadou. 2013. Distributional semantics resources for biomedical text processing. Proceedings of LBM.
Ronan Collobert and Jason Weston. 2008. A unified architecture for natural language processing: Deep neural networks with multitask learning. In Proceedings of ICML, pages 160–167. ACM.
Rune Sætre, Kazuhiro Yoshida, Akane Yakushiji, Yusuke Miyao, Yuichiro Matsubayashi, and Tomoko Ohta. 2007. Akane system: protein-protein interaction pairs in biocreative2 challenge, ppi-ips subtask. In Proceedings of BioCreative II, pages 209–212.
Javi Fern´andez, Yoan Guti´errez, Jos´e M G´omez, and Patricio Martınez-Barco. 2014. Gplsi: Supervised sentiment analysis in twitter using skipgrams. In Proceedings of SemEval, pages 294–299.
Larry Smith, Lorraine K Tanabe, Rie Johnson nee Ando, Cheng-Ju Kuo, I-Fang Chung, Chun-Nan Hsu, Yu-Shi Lin, Roman Klinger, Christoph M Friedrich, Kuzman Ganchev, et al. 2008. Overview of biocreative ii gene mention recognition. Genome biology, 9(Suppl 2):1–19.
Felix Hill, Roi Reichart, and Anna Korhonen. 2015. Simlex-999: Evaluating semantic models with (genuine) similarity estimation. Computational Linguistics.
Pontus Stenetorp, Hubert Soyer, Sampo Pyysalo, Sophia Ananiadou, and Takashi Chikayama. 2012. Size (and domain) matters: Evaluating semantic word space representations for biomedical text. In Proceedings of SMBM.
Jin-Dong Kim, Tomoko Ohta, Yoshimasa Tsuruoka, Yuka Tateisi, and Nigel Collier. 2004. Introduction to the bio-entity recognition task at JNLPBA. In Proceedings of JNLPBA, pages 70–75.
Joseph Turian, Lev Ratinov, and Yoshua Bengio. 2010. Word representations: a simple and general method for semi-supervised learning. In Proceedings of ACL, pages 384–394.
Aris Kosmopoulos, Ion Androutsopoulos, and Georgios Paliouras. 2015. Biomedical semantic indexing using dense word vectors in bioasq. Journal Of Biomedical Semantics.
Peter D Turney. 2012. Domain and function: A dual-space model of semantic relations and compositions. Journal of Artificial Intelligence Research, pages 533–585.
Gabriella Lapesa and Stefan Evert. 2014. A large scale evaluation of distributional semantic models: Parameters, interactions and model selection. Transactions of the Association for Computational Linguistics, 2:531–545. Omer Levy, Yoav Goldberg, and Ido Dagan. 2015. Improving distributional similarity with lessons learned from word embeddings. TACL, 3:211–225. Tomas Mikolov, Kai Chen, Greg Corrado, and Jeffrey Dean. 2013a. Efficient estimation of word representations in vector space. In Proceedings of ICLR. Tomas Mikolov, Ilya Sutskever, Kai Chen, Greg S Corrado, and Jeff Dean. 2013b. Distributed representations of words and phrases and their compositionality. In Proceedings of NIPS, pages 3111–3119. TH Muneeb, Sunil Kumar Sahu, and Ashish Anand. 2015. Evaluating distributed word representations for capturing semantics of biomedical concepts. In Proceedings of ACL-IJCNLP, page 158.
174