1160
IEEE TRANSACTIONS ON GEOSCIENCE AND REMOTE SENSING, VOL. 41, NO. 6, JUNE 2003
Hyperion, a Space-Based Imaging Spectrometer Jay S. Pearlman, Senior Member, IEEE, Pamela S. Barry, Member, IEEE, Carol C. Segal, John Shepanski, Debra Beiso, and Stephen L. Carman
Abstract—The Hyperion Imaging Spectrometer was the first imaging spectrometer to routinely acquire science-grade data from earth orbit. Instrument performance was validated and carefully monitored through a combination of calibration approaches: solar, lunar, earth (vicarious) and atmospheric observations complemented by onboard calibration lamps and extensive prelaunch calibration. Innovative techniques for spectral calibration of space-based sensors were also tested and validated. Instrument performance met or exceeded predictions including continued operation well beyond the planned one-year program. Index Terms—Earth Observing 1 (EO-1), Hyperion, hyperspectral, imaging spectrometer, instruments, space systems.
I. BACKGROUND HE NATIONAL Aeronautics and Space Administration (NASA) New Millennium Program (NMP) was created to flight-validate instrument and spacecraft technologies that may enable new or more cost-effective approaches to earth observation [1]. Both advanced multispectral imagers and hyperspectral imagers were part of the NMP Earth Observing 1 (EO-1) mission. These two classes of instruments were to be integrated into a single design using a common set of fore-optics. However, in the interests of flexibility and time, a parallel development path was chosen, and the multispectral Advanced Land Imager (ALI) and the hyperspectral Hyperion became separate instruments. The Hyperion instrument was built by TRW, Inc. (now Northrop Grumman Space Technology) with strong support from key sensor subsystem organizations.1 The Hyperion project had a fast-track schedule and was delivered to NASA Goddard Space Flight Center (GSFC) for spacecraft integration in less than 12 months. To accomplish this, TRW used focal planes and associated electronics remaining from the NASA Lewis Small Satellite Technology Initiative hyperspectral mission. As an important demonstration instrument, emphasis was placed on quality characterization and calibration. For radiometric measurements, National Institute of Standards and
T
Manuscript received April 10, 2003; revised April 24, 2003. This work was supported by the National Aeronautics and Space Administration. J. S. Pearlman is with the Advanced Network Centric Operations, Phantom Works, Boeing Company, Seattle, WA 98124 USA (e-mail:
[email protected]). P. S. Barry is with Raytheon Electronics Systems, El Segundo, CA 90245 USA (e-mail:
[email protected]). C. C. Segal, J. Shepanski, D. Beiso, and S. L. Carman, are with Northrop Grumman Space Technology, Redondo Beach, CA 90278 USA (e-mail:
[email protected];
[email protected];
[email protected];
[email protected]). Digital Object Identifier 10.1109/TGRS.2003.815018 1The optical structure was designed, fabricated, and assembled by SSG, Inc.; the SWIR focal plane array was produced by Boeing; the VNIR focal plane array was built by Loral; and the gratings were fabricated by JPL.
Technology (NIST)-traceable lamps and solid-state detectors were used for radiometric measurements. Teams from the Massachusetts Institute of Technology (MIT)/Lincoln Laboratory, NASA GSFC, and the Jet Propulsion Laboratory (JPL) participated in the radiometric calibration. Each of these groups brought sources or transfer standards to TRW during the laboratory environmental testing. The results of these measurements were ultimately integrated into the on-orbit calibration. The instrument’s end-to-end testing included an image simulator that allowed creation of two-dimensional (2-D) spatial images for both instrument characterization and for testing the image processing system. The image processing software was developed by TRW, and the Level 0 processing code (from raw data to an uncalibrated imageable format) was delivered to NASA GSFC for production operations. The data were processed to calibrated Level 1 format at TRW during the first year of operations. In the later years, the processing was done at the U.S. Geological Survey (USGS) EROS Data Center (EDC). Following launch, the on-orbit characterization lasted for 120 days [2] with continuing assessment of the instrument throughout the first year of operations. Much of the laboratory calibration carried through to the on-orbit operations. Several areas, however, are worth noting. • The calibration lamps were characterized in the environmental testing and were found to be stable. Following launch, as much as a 30% change in the light output was measured and ultimately ascribed to a change in lamp characteristics due to operation in zero gravity. Thus, for on-orbit operations, the lamps could not be used as a transfer standard nor for absolute radiometry. • A number of single-event pixel anomalies over South America were observed. These occurred in as little as one frame (rather than in image stripes characteristic of a pixel failure) and were traced to radiation from the South Atlantic anomaly. • After one year of operations, the radiometric coefficients were modified to combine the vicarious, lunar, solar, and updated laboratory calibrations. The visible near-infrared (VNIR) and shortwave infrared (SWIR) spectrometer gains were increased 8% and 18%, respectively. • The instrument was very stable; variations in calibration of 1% in the VNIR and 3% in the SWIR were measured during the first year of operation using lunar observation data. Hyperion was designed for a one-year life. The instrument has continued to function well beyond two years with no degradation. Details of the instrument design, performance, and data processing are provided in the following sections.
0196-2892/03$17.00 © 2003 IEEE
PEARLMAN et al.: HYPERION, A SPACED-BASED IMAGING SPECTROMETER
1161
II. INSTRUMENT OVERVIEW The Hyperion pushbroom instrument was designed as a technology demonstration and provided high-quality calibrated data for hyperspectral application evaluations [3]. With Hyperion, each pushbroom image frame captured the spectra from an area 30 m along-track by 7.7 km cross-track. The forward motion of the satellite created a sequence of frames that were combined into a 2-D spatial image with a third dimension of spectral information (called a “three-dimensional data cube”). The pushbroom technology introduced new operations and performance characteristics in comparison to the traditional scanning sensors. Scanning instruments such as the Landsat-7 ETM+ use small linear detector arrays and a mirror that scans in the cross-track direction in order to create multiband, 2-D images. As array technology has improved, 2-D focal plane arrays have become available for space-based remote sensing. The advantages of using 2-D arrays are that they generate a 2-D spectral image without the need for moving parts, and they have longer dwell times that improve S/N performance. The challenges of pushbroom configurations are that they have a multitude of pixels that need to be calibrated and that the natural calibration process in the scanning system is not available—i.e., the scanning mirror allows a calibration source to be routinely swept across the detectors, providing continuous calibration. Addressing these challenges was a key facet of the Hyperion program. Hyperion had a single telescope and two spectrometers: one VNIR spectrometer and one SWIR spectrometer. The Hyperion instrument consisted of three physical units: 1) the Hyperion electronics assembly (HEA), 2) the cryocooler electronics assembly (CEA), and 3) the Hyperion sensor assembly (HSA). These units were placed on the nadir deck of the spacecraft with the viewing direction along the major axes of the spacecraft. The HEA and the CEA contained the data and control electronics for the sensor and the cryocooler. The HSA included the optical systems, cryocooler, in-flight calibration system, and the high-speed focal plane electronics (Fig. 1). The HSA enclosure was 38.6 cm wide, 75 cm long, and 64.6 cm high. The HSA enclosure controlled the optics thermal environment, and the housing was maintained at 293 K 2 K for precision imaging and alignment. The VNIR spectrometer focal plane array (FPA) was passively cooled by a radiator and operated at 283 K. The SWIR spectrometer FPA was actively cooled by the cryocooler with a thermal head set to 110 K. The Hyperion telescope (fore-optics) was a three-mirror astigmate design with a 12-cm primary aperture and an effective f-number of 11. The telescope imaged the earth onto a slit that defined the instantaneous 0.624 wide field of view (i.e., 7.7-km swath width from a 705-km altitude) by 42.55 rad (30 m) in the satellite velocity direction. This slit image of the earth was relayed at a magnification of 1.38 : 1 to two focal planes, one in each of the two grating imaging spectrometers. A dichroic filter in the system reflected the band from 400–1000 nm to the VNIR spectrometer and transmitted the band from 900–2500 nm to the SWIR spectrometer. The SWIR overlap with the VNIR from 900–1000 nm allowed cross calibration of the two spectrometers. Both spectrometers used JPL convex gratings [4] in a three-reflector Offner configuration. There was an order-sorting filter in the VNIR spectrometer.
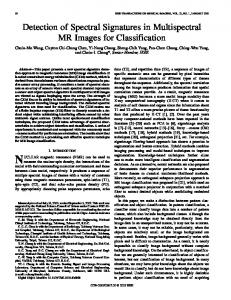
Fig. 1. HSA contains the optical systems, cryocooler, in-flight calibration system, and high-speed focal plane electronics.
The motorized HSA cover was an integral part of the instrument calibration process; the cover had three positions: open, closed, and calibration. The backside of the cover was coated with a diffuse reflecting white, silicone thermal control paint. With the aperture cover in calibration position (partially open at 37 ), solar illumination reflecting off the diffuse painted surface was used as a source for the on-orbit radiometric calibration. With the cover closed, the internal calibration lamps reflected off the painted cover. For these two calibration techniques, the paint was characterized for reflectivity as a function of angle [5]. During the instrument design, a number of tradeoffs were made to increase the S/N for an orbit of 705-km altitude. Hyperion was built using existing focal planes designed for operation at a 520-km altitude orbit. Operating at the higher 705-km orbit reduced the S/N by almost a factor of two. To counter this, the original Lewis instrument bandwidth of 5 nm was increased to 10 nm for Hyperion. For the same reason, two spectrometers with JPL curved gratings were used rather than a single spectrometer with a dual-blazed grating. The VNIR spectrometer had a 128 256 FPA, and the SWIR had a 256 256 array. As noted earlier, these were built for the Lewis Small Spacecraft Technology Initiative with a 5-nm bandwidth and 5-nm band spacing imaging spectrometer. When this was changed to 10-nm bandwidth and spacing, all the pixels in the “spectral direction” were not used; the VNIR spectrometer employed only a 70 (spectral) 256 (spatial) pixel section of the 128 256 silicon FPA. The mercury-cadmium-telluride SWIR FPA had 256 256 pixels of 60 m pitch and a custom pixel readout. For Hyperion, only a 172 pixel (spectral) 256 pixel (spatial) section of the SWIR FPA was used. While the
1162
IEEE TRANSACTIONS ON GEOSCIENCE AND REMOTE SENSING, VOL. 41, NO. 6, JUNE 2003
TABLE I CHARACTERISTICS OF THE HYPERION SYSTEM
Fig. 2. Hyperion signal-to-noise performance.
TABLE II PERFORMANCE OF THE HYPERION INSTRUMENT
total number of bands was, therefore, 242, S/N considerations led to only 198 pixels being routinely processed by the Level 1B software (50 VNIR and 148 SWIR) (see Section IV). The general instrument characteristics are given in Table I. A summary of the on-orbit performance is given in Table II. Details of the characterization and performance are provided in the next section. III. INSTRUMENT CALIBRATION AND PERFORMANCE A. Radiometric Calibration The use of a 2-D focal plane pushbroom configuration versus a more traditional side-scanned linear array required new approaches to calibration.
1) Prelaunch Calibration: For the prelaunch calibration, TRW used its multispectral test bed (MSTB) [6]. The MSTB consisted of a monochrometer whose output was in one of two optical configurations: 1) either the light illuminated a pinhole, slit, or knife edge that was at the focus of an off-axis parabola reflector or 2) the light illuminated a spectralon panel whose reflection was collimated by the same off-axis parabola. Absolute radiometric standards and NIST-traceable sources/detectors were used for the characterization. Typically, the light from the MTSB was directed onto a transfer radiometer or into the Hyperion aperture. The data were then analyzed, and the absolute reference was transferred to Hyperion to determine the radiometric gain coefficients. Prelaunch calibration included extensive laboratory observations using both lamp-based and solid-state detector measurements [5], including the GSFC Landsat Transfer Standard [7] for cross calibration with ALI. For Hyperion, the lamp-based and solid-state detector-based calibrations showed a 5% to 15% difference in absolute values but similar spectral response profiles. The solid-state detector values were used for the prelaunch baseline. Based on the measured performance, the S/N performance was calculated (Fig. 2). The baseline conditions assumed for the performance model were a 60 solar zenith angle, a 30% uniform albedo, an instrument with f/11 optics, a 10-nm bandwidth, and a 224-Hz frame rate. This was very conservative. Other instruments tend toward an assumed albedo of 50% and solar zenith angles less than 45 . Thus, the performance shown in Fig. 2 may be lower than that observed in Hyperion data applications. 2) On-Orbit Radiometric Calibrations: Solar, lunar, and earth-surface-observing “vicarious” measurements were used for the on-orbit calibration. Pointing agility of the EO-1 satellite enabled unique calibration experiments (in addition to traditional solar and vicarious measurements) to help quantitatively analyze instrument performance including active illumination experiments, lunar (radiometric), atmospheric limb (spectral), and 90 yaw (slit in-track) (uniformity) observations. All of these measurements had strengths and weaknesses (Table III). a) Solar calibration: For solar calibration, the sunlight was diffusely reflected from the paint on the rear of the instrument cover. The solar calibration was unique in that it provided a uniform cross-track reference with a very stable source. It was
PEARLMAN et al.: HYPERION, A SPACED-BASED IMAGING SPECTROMETER
1163
TABLE III TRADEOFFS OF APPROACHED TO ON-ORBIT RADIOMETRIC CALIBRATION
conducted about once per week during the first year of operations for both absolute calibration and to initially update the preflight calibration files by correcting for pixel-to-pixel variations [8]. While the sun is stable, long-term temporal variations in the diffuser characteristics could potentially lead to a drift in calibration. There was also some uncertainty due to possible small effects caused by variations in spacecraft pointing. To ensure that the pointing was correct, early in the mission, the spacecraft was maneuvered so that the sun angle varied over 6 , about normal incidence to induce vignetting of the solar radiation by the solar baffle. The correct pointing orientation was then established to avoid subsequent vignetting. b) Lunar calibration: Lunar calibration did not use a diffuser, as the instrument views the moon directly and with no intervening atmosphere. These benefits were balanced by the need for special spacecraft maneuvers and by the uncertainties of the lunar reflection model. Lunar observations were conducted near a 7 lunar phase angle each month starting in January 2001 [9]. For each lunar observation, the spacecraft was maneuvered to scan the moon in the in-track direction at one-eighth of the nominal scan rate in order to oversample the lunar disk. The lunar spectral irradiance was obtained by summing the calibrated lunar image. Once the measured lunar irradiance was calculated for a given observation, the expected lunar irradiance for the time of the observation was calculated by the USGS using data obtained from the Robotic Lunar Observatory (ROLO) in Flagstaff, AZ [10]. Since 1996, ROLO has been measuring the lunar irradiance between 350–2500 nm as a function of phase angle as often as weather and visibility permit [11]. A model of the lunar irradiance was required and depended on the spacecraft position, as well as the relative positions of the earth, moon, and sun [12]. The absolute radiometric scale of the lunar model was based on standard stars [13], and although the absolute scale is in general agreement with several spacecraft measurements [14], there is uncertainty that is not yet well understood; direct calibration of the ROLO system to NIST standards is underway. c) Internal lamp calibration: On-orbit radiometric calibration was also to be performed with internal reference sources (lamps) mounted inside Hyperion. Initially, they were designed as a radiometric transfer standard between preflight and on-orbit calibrations. However, a large (30%) increase in lamp output was seen in the VNIR and SWIR immediately after launch. This was attributed to a loss of convective cooling of the filament
Fig. 3. Comparison of Hyperion synthesized Landsat-7 data (left at top) and Landsat-7 ETM+ data (right) over the same location.
Fig. 4. VNIR spectrometer repeatability using lunar and solar calibration.
Fig. 5. SWIR spectrometer repeatability using lunar and solar calibration.
in the zero-gravity environment and invalidated using the reference lamps as calibration transfer standards between preflight and flight calibration [15]. As continued solar and lunar calibrations established that the long-term stability of the instrument was better than 3%, the lamps played a smaller role in calibration and characterization.
1164
IEEE TRANSACTIONS ON GEOSCIENCE AND REMOTE SENSING, VOL. 41, NO. 6, JUNE 2003
Fig. 6. Hyperion SWIR “echo” as seen in the Moomba gas flare scene, before and after echo correction.
d) Vicarious calibration: Vicarious calibration involved imaging a characterized test area on the earth’s surface. Vicarious calibration was an important aspect of the instrument characterization program because the scene was viewed directly rather than reflected by a diffuser. Vicarious calibration also facilitates intercomparison with Landsat-7 and other space-based imaging systems [16]. A broader range of intercomparisons such as solar and lunar imaging would have been beneficial, but were not within the capabilities of other operational imaging systems. For the calibration, ground truth and atmospheric characterization were performed with ground-based instruments. These measurements were projected to radiances at the spacecraft through an atmospheric model. The challenges were in extrapolating a surface point measurement to a pixel area in the image and in correcting for atmospheric effects. Sites for vicarious calibration were selected in both the Northern and Southern Hemispheres to allow measurements with a high sun angle throughout the year. Sites included Lake Frome in South Australia, Arizaro in Argentina, Railroad Valley in the United States, and others. These areas were dry lake beds or salt flats with generally high reflectivity. Lake Frome [17] had 60% reflectivity in the VNIR spectrum. Arizaro had both high reflectivity and was at very high altitude ( 4000 m) [18], reducing the impact of the atmosphere, but making the atmospheric modeling more difficult. Railroad Valley was a well-characterized site with easy access to permit frequent measurements [19]. The ground sites were also used for a cross-calibration with Landsat-7. For this comparison, the Hyperion spectral bands were aggregated into the larger Landsat bands, and a number of nearly simultaneous images were acquired over mineral and agricultural areas. With the current Hyperion calibration (Level 1B1), the agreement between the two instruments was excellent, within a few percent [16]. A comparison over the Coleambally Irrigation area is shown in Fig. 3. The radiometry of Hyperion was very stable. Data from a series of lunar and solar calibration collects used to monitor
Fig. 7. Echo intensity variation as measured across the Hyperion SWIR focal plane array.
the repeatability of the VNIR and SWIR are shown in Figs. 4 and 5. For this period, the VNIR repeatability was better than 1%, and the repeatability of the SWIR was better than 3%. At the end of the first year, based on the full range of on-orbit radiometric measurements, a decision was made by TRW and
PEARLMAN et al.: HYPERION, A SPACED-BASED IMAGING SPECTROMETER
1165
Fig. 8. Noise levels in the four quadrants of the VNIR FPA. Quadrants C and D had more noise, and D shows pattern noise.
the Science Validation Team (SVT) calibration team to increase the VNIR calibration coefficients by 8% and the SWIR by 18%. This brought the absolute radiometry into close agreement with the lunar, vicarious, ALI, and Landsat-7 comparisons. It also adopted a consistent value of the solar constant for both Landsat-7 and EO-1. The Level 1 data products using these revised factors were denoted Level 1B1. 3) Other Radiometric Effects: In addition to the absolute calibration, certain features were observed during the prelaunch calibration that were characterized and then removed as part of the image processing to create radiometrically corrected Level 1 data. These included both a SWIR “echo” and a SWIR “smear.” The echo resulted from electronic “cross-talk” in the SWIR spectrometer that caused a small anomalous signal to appear 11 lines offset in track. The effect is illustrated in Fig. 6, which was the image of a very bright gas flare in Moomba, Australia. The magnitude of the echo was mapped for the entire focal plane and is typically 6.5%. The mapping and intensity profile of the
echo from laboratory measurements are exhibited in Fig. 7. The effect was stable and was readily removed as part of the Level 1 data processing. The SWIR smear was a local effect in which a small percentage of the signal from an adjacent pixel occurs in the pixel readout. This is due to incomplete charge transfer in the readout process. The value was approximately 6% and was repeatable. The effect was also removed during Level 1 processing. Similar artifacts were observed with the VNIR spectrometer but to a much smaller extent. The maximum observed crosstalk was 0.9% with more typical levels of 0.5% for low-contrast scenes. The effect was observed most prominently with lunar images where there was very high contrast between lunar intensity and the blackness of deep space. The VNIR readout electronics also contributed to the noise. The VNIR spectrometer had four readout quadrants, each of which had a slightly different noise level and pattern (Fig. 8). In addition to random noise, a temperature-dependent pattern
1166
IEEE TRANSACTIONS ON GEOSCIENCE AND REMOTE SENSING, VOL. 41, NO. 6, JUNE 2003
TABLE IV MTF LAB MEASUREMENT RESULTS USING KNIFE-EDGE TECHNIQUE FOR DIFFERENT FIELDS OF VIEW (FOV)
in the dark images was seen in Quadrant D and was referred to as the “Dark Pattern.” While it was not consistent between data collections events (DCEs), the noise was stable within a DCE. Thus, the dark subtraction on a pixel-by-pixel basis removed the pattern from the Level 1 data of land images. However, the impact on images from very dark targets, particularly deep water, was not entirely removed by Level 1 processing and was generally dealt with through additional scene-dependent postprocessing. B. Optical Calibration The optical performance of Hyperion was characterized by the modulation transfer function (MTF), the ground sample distance (GSD), and other parameters. In some cases, direct measurements were possible. In other cases, a combination of measurements and modeling was used. 1) Modulation Transfer Function: In the laboratory, knife edges/slits and 2-D patterns were used to characterize the MTF. Sensor illumination was performed with both knife edges and slit. The knife edge, for example, was positioned at the MSTB image plane and illuminated with the edge perpendicular to the slit of the spectrometer. A steering mirror was tilted so that the image moved across the spectrometer slit in fractional pixel steps for oversampling. These data were used to derive the point spread function and the system MTF (Table IV). A similar process was conducted with a slit replacing the knife edge. An innovative approach to the same objective used the image simulator with a starburst pattern (Fig. 9). The MTF was determined by examining the image clarity moving into the center of the image. The results were similar to the knife-edge measurements. The on-orbit approach to validating the MTF involved modeling the instrument response to ground targets with sharp edges including bridges, edges of ice shelves, and the moon [20]. Bridge scenes produced excellent correlation with the preflight measurements. Several “cross-track” and “in-track” bridges were selected for these measurements. Fig. 10 shows a Hyperion image acquired on December 24, 2000 of the Mid-Bay Bridge near Eglin AFB in Destin, FL. To measure the MTF, the line spread function (LSF) was sampled at a higher resolution than the GSD. This was accomplished by
Fig. 9. Two-dimensional Hyperion images were used to measure MTF.
analyzing an object at a slight angle to the spacecraft direction and interlacing the consecutive frames. In the bridge scene of Fig. 10, the angle between the orbital track and the bridge was too small to use consecutive frames, so every fifth frame was used in the interlaced LSF. The interlaced LSF was then processed with a Fourier transform and adjusted by the bridge width to determine the MTF. The MTF measured at the Nyquist sampling frequency using this scene agreed with the preflight measured value. Based on the preflight and on-orbit MTF measurements, there was no change in the Hyperion optical performance due to the launch or operational environment. 2) Ground Sample Distance: The on-orbit GSD was measured using 1) a pixel count method between known targets (i.e., known distances) in the images and 2) a geocorrection process with multiple control points and orthorectified aerial photographs. The pixel count method gave a GSD of 30.4 m cross-track and 30.4 m in-track with standard deviations of 0.25 and 0.073 m, respectively. The measurements are summarized in Table V. For the second approach, the on-ground pixel size was measured through geocorrecting a set of images using highly accurately surveyed ground points and orthorectified aerial images. A detailed study was conducted at a level agricultural site in Coleambally, NSW, Australia [21]. Since the VNIR and SWIR were separate spectrometers, the two datasets were treated as
PEARLMAN et al.: HYPERION, A SPACED-BASED IMAGING SPECTROMETER
1167
Fig. 10. Mid-Bay Bridge near Eglin AFB in Destin, FL was used to measure the MTF. TABLE V MEASUREMENT OF GSD OVER MANY IMAGES SHOWS GOOD CONSISTENCY
independent images. Three separate collections over the January–March 2001 timeframe provided six images that were interactively optimized along with the ground control points and aerial orthophotographs. The resulting GSDs were 30.77 m 0.005 m in-track and 30.49 m 0.007 m for cross-track. Also, analyses of the average positional accuracy across the entire 0.6 Coleambally image had rms errors (ranges) of 12.9 m and 11.6 m 2.1 m, respectively in the cross- and in-track directions [21]. Since these results are both latitude and spacecraft role-angle dependent, results observed at Coleambally may vary, depending on image site location.
C. Spectral Calibration 1) Prelaunch Spectral Calibration: Laboratory measurements with the MSTB characterized the spectral shape of 25 pixels distributed systematically in a 5 5 array around each of the focal planes. The shape was well represented by a Gaussian profile. The distance between band-to-band center wavelengths for the VNIR and SWIR dispersions were 10.19 and 10.09 nm/pixel, respectively [22]. The results of the spectral calibration measurements performed by a monochrometer are shown in Table VI. The band centers and shapes for the remainder of the pixels were derived through interpolation between the measured points. A spectral variation across the field of view (termed “smile”) was measured using the laboratory MSTB. The VNIR and SWIR spectrometers had different characteristic smiles as shown in Figs. 11 and 12. In addition to the monochrometer-based measurements, two techniques were used for spectral calibration in the laboratory. The diffuser paint on the back of the HSA cover had a spectral signature in the infrared consisting of three absorption lines at approximately 1190, 1690, and 1740 nm (Fig. 13). These were also observed on orbit, during both solar and lamp calibrations, and were used to verify that the spectral response performance did not change from prelaunch to postlaunch. The second spectral calibration technique used spectralon doped with either erbium or holmium. The light that reflected off of the spectralon had unique spectral absorption lines due to the doping (Fig. 14). For the calibration measurements, two
1168
IEEE TRANSACTIONS ON GEOSCIENCE AND REMOTE SENSING, VOL. 41, NO. 6, JUNE 2003
TABLE VI HYPERION SPECTRAL CALIBRATION DERIVED FROM LABORATORY MONOCHROMETER MEASUREMENTS
Fig. 12.
SWIR spectral variation across the field of view.
Fig. 13. SWIR portion of the internal calibration image displaying instrument cover paint spectral patterns.
Fig. 11.
VNIR spectral variation across the field of view. Fig. 14.
images were acquired, one using the doped spectralon and the other taken with the undoped spectralon. The data in the two images were ratioed, which removed both lamp source wavelength and sensor response variations. High-resolution scans of the doped spectralon subsequently convolved with the sensor response agreed extremely well with the other sensor measurements (Fig. 15) [23]. There was a slight change between the spectral characterization acquired at TRW prior to spacecraft integration and that measured at GSFC during postsatellite environmental testing, probably due to a small movement of the FPAs. Using the atmospheric limb data, it was believed that the launch vibration also
Reflectance spectra of doped spectralon.
caused a small shift in the focal planes because the smile characterizations for pre- and postlaunch were slightly different. Since the shift was within the measurement errors, the instrument calibration factors used for data processing were not changed. 2) On-Orbit Spectral Calibration: On-orbit spectral verification was more challenging. Spectrally pure ground features that extend across the full swath are extremely rare. One such class of targets was the mineral absorption features above 2000 nm. In this spectral range, the S/N was still sufficient to provide usable signals for analysis. The results of the measurements, though relatively coarse because of S/N limitations,
PEARLMAN et al.: HYPERION, A SPACED-BASED IMAGING SPECTROMETER
Fig. 15.
1169
Comparison of high-resolution and Hyperion measurement of erbium-doped spectralon.
Fig. 16. Atmospheric limb measurements enable spectral measurements without earth background.
were consistent with the prelaunch laboratory measurements [24]. Another technique, a data collection of solar radiation transmitted through the earth’s atmospheric limb, provided uniform, tractable data for spectral analysis. The atmospheric limb/solar calibration collect viewed the sun through different tangent heights of the atmosphere (Fig. 16). Because Hyperion viewed the sun scattered off the solar diffuser, the illumination was uniform across the field of view and contained spectral features. These were matched with solar lines, atmospheric lines, and
Fig. 17. Analysis of atmospheric limb measurement showing Hyperion spectra of atmospheric limb collect (lower curve); measured diffuse cover reflectance (upper curve); and atmospheric reference profile from Modtran 3 (middle curve).
absorption lines associated with the solar diffuser (Fig. 17). The process enabled the center wavelengths and variations of the center wavelengths across the field of view (i.e., the smile) to be characterized on-orbit for specific wavelengths [22]. For the VNIR, the band center wavelength variability was from 1.7–2.55 nm, measured on-orbit. This is a shift of about 1 nm from the prelaunch measurements. The SWIR had
1170
Fig. 18.
IEEE TRANSACTIONS ON GEOSCIENCE AND REMOTE SENSING, VOL. 41, NO. 6, JUNE 2003
Comparison of laboratory and on-orbit smile characteristics for spectral channels 17 and 141.
minimal smile effect. Maps of the shifts across the focal plane are given in Fig. 18. Some uncertainties remain in the spectral location of features associated with the atmosphere and the validity of interpolating between the measured wavelengths. The magnitude of this effect for the VNIR and SWIR is still being studied using the oxygen, carbon dioxide, and other spectral signatures [25]. D. Polarization There was some concern that applications for targets with polarized reflections would be impacted if Hyperion had a strong polarization effect. Thus, the polarization sensitivity was measured in the laboratory. The measurement used dual polarizers that were rotated to map the polarization characteristics. Results for the VNIR and SWIR are shown in Fig. 19. Polarization response measurements were not performed on-orbit. IV. IMAGE AND DATA PROCESSING The EO-1 spacecraft was in a sun-synchronous orbit with an altitude of 705 km, a 10:01 A.M. descending node, and a 16-day repeat cycle. The spacecraft was capable of rolling 22 or more, and data were acquired with the spacecraft rolled to various pointing angles. The angle was held constant during an image acquisition. Typical pointing accuracies at the earth’s surface were 100 m cross-track, and the associated pointing knowledge was 40 m cross-track and 100 m along-track. A DCE included the scene image, dark images, and the ancillary data needed for image processing. For Hyperion, a typical image cube consisted of approximately 6000 frames of data and required about 27 s to collect. Data collections up to 2 min were possible, limited by the solid-state memory. During the first year of operations, the Level 1 radiometric processing was done at TRW on Level 0 data provided by EO-1 operations at GSFC. Level 1 processing provides a number of correction and calibration functions. Initially, it used the preflight calibration developed during environmental testing for pixel gains and identified bad pixels whose values were replaced by nearest neighbor averages. The offset for each pixel derived from the cover closed “dark” image was subtracted during the Level 1 processing. Corrections for smear and echo, discussed previously, were also included. Level 1
Fig. 19.
VNIR and SWIR polarization characteristics.
processing output is in a computer-compatible format for further processing and analysis. During the first year of operations, the Level 1 data processing evolved as further experience was gained with the instrument (Table VII). A major change in processing and data format was implemented seven months after launch. The data format was modified from an unsigned to a signed integer to allow both positive and “negative” data that accounted for noise fluctuations around zero. The offset calculation was changed from nearest dark collect to a linear interpolation between dark collects before and after image collection. This was done because a small drift in dark level was observed over the several minutes of a data collection sequence. Also, a saturated pixel report was created. Saturation in the SWIR was observed when imaging very bright thermal sources such as volcanic eruptions or intense fires. Since the echo correction was defined as a known percentage of the related pixel intensity, saturation caused errors in the echo correction. The echo correction for saturation pixels was eliminated.
PEARLMAN et al.: HYPERION, A SPACED-BASED IMAGING SPECTROMETER
1171
TABLE VII EVOLUTION OF LEVEL 1 PROCESSING. ITALICS INDICATES A CHANGE FROM PREVIOUS VERSION
By one year after launch, sufficient vicarious, lunar, and solar collects had been analyzed to create final gain coefficients for each pixel to provide better correlation between Hyperion and Landsat-7. As previously noted, these were typically 8% greater for the VNIR and 18% greater for the SWIR that the prelaunch values. This change was not due to a change in instrument characteristics, but represented an update of the laboratory calibration factors. The new gain coefficients were used on all data processed after calendar year 2000. Starting in February 2001, USGS EDC assumed responsibility for routine data processing. In addition to the radiometric corrections, Level 1B1 processing performed an alignment of the VNIR and SWIR spectrometer images to within approximately half a pixel. There was a known one-pixel shift between the VNIR and SWIR images in the cross-track direction. The in-track direction was more complex because the shift varied linearly across the swath. This was due to the differences in readout procedures for the two focal planes: the VNIR focal plane was read out in quadrants, while the SWIR focal plane had four readout ports that read adjacent pixels in 2 2 arrays. The result of the different readout processes was a timing difference between the two focal planes so that the VNIR and SWIR images were aligned spatially on the right side of the image (west side for descending orbits), and the SWIR was one in-track pixel later on the left side. The Level 1B1 processing adjusted for this by shifting the SWIR one cross-track pixel and, for the left half of the image, also shifting the SWIR forward one pixel (Fig. 20). While not precise, this adjustment did not require resampling and was reversible. More precise shifts may be performed by the user, if desired. Experience showed that the Level 1 data had vertical (in-track) striping. The striping that remains after Level 1 processing appears to be scene dependent and is generally consistent within an image. However, some of the stripes are intermittent. The reason for the intermittent behavior is not fully understood. Various techniques have been used to
Fig. 20.
Spatial overlay of VNIR and SWIR images for Level 1B1 processing.
minimize the scene-dependent striping. Two of these involved calculating the mean and variance of columns along-track for a sufficiently long collect, typically 600–1000 frames. The mean and variance of each column were then set equal to the mean and variance for the entire image. This technique worked well for images of terrain with a random mixture of features such as desert scenes [24]. However, using this approach over large agricultural fields caused the destriping to alter the spectral
1172
IEEE TRANSACTIONS ON GEOSCIENCE AND REMOTE SENSING, VOL. 41, NO. 6, JUNE 2003
characteristics within the image. An alternative approach involving a more local rather than a global mean and variance was reported to avoid the problem of spectral contamination while still removing the striping [26]. While this approach improves the data for applications and land cover assessment, fine tuning of the image, including corrections for stripping, smile, and atmospheric effects, are still open questions for continuing research. V. SUMMARY Hyperion was a major advance in space-based hyperspectral instruments. It was designed as a technology demonstration to build and maintain a science-grade instrument for validating pushbroom performance and to initiate hyperspectral applications on a global scale. The instrument was built in less than one year, and the design goal of a stable, carefully calibrated instrument was achieved. Hyperion’s 242 bands covered the visible, near-infrared, and shortwave infrared bands (400–2500 nm) with 10-nm bandwidths; typically 198 bands were provided in the calibrated data The spatial resolution of 30 m was sufficient to address most land cover issues. The pointing and data storage capabilities of the spacecraft allowed global access. The radiometric and spectral performance permitted quantitative temporal hyperspectral monitoring of earth surface processes, something that has never been done routinely with global access. With the success of the mission and the continuing interest in the Hyperion data, the EO-1 mission has been extended. Operations are ongoing 30 months after the November 2000 launch. ACKNOWLEDGMENT The success of Hyperion resulted from the work of many people and organizations both within TRW and from subcontractors and colleagues in the science community. Special recognition goes to SSG for building the optical system in less than six months, to MIT/Lincoln Labs, GSFC, and JPL for their support in the calibration, to Swales for their spacecraft, to JPL for the curved gratings, and to the EO-1 Science Validations Team—whose questions and suggestions made the data a lot more valuable. While it is hard to single out individuals, the authors thank B. Cramer, W. Brown, and S. Ungar (GSFC) for their unrelenting support and encouragement. We also acknowledge the close collaboration of D. Jupp and his team at the CSIRO for their work in the calibration and assessment of the Hyperion instrument. The authors also thank R. Bindschindler, M. Crawford, and S. Biggar for their review and suggestions for the manuscript. REFERENCES [1] S. Ungar, J. S. Pearlman, J. A. Mendenhall, and D. Reuter, “Overview of the Earth Observing One (EO-1) mission,” IEEE Trans. Geosci. Remote Sensing, vol. 41, pp. 1149–1159, June 2003. [2] S. Ungar, “Overview of EO-1, the first 120 days,” in Proc. IGARSS, vol. 1, July 9–13, 2001, pp. 43–45. [3] J. Pearlman, S. Carman, C. Segal, P. Jarecke, P. Barry, and W. Browne, “Overview of the Hyperion imaging spectrometer for the NASA EO-1 mission,” in Proc. IGARSS, vol. 6, 2001, pp. 3504–3506.
[4] P. Mourouis, D. W. Wilson, P. D. Maker, and R. A. Muller, “Convex grating for concentric imaging spectrometer,” Appl. Opt., vol. 37, pp. 7200–7208, 1998. [5] P. Jarecke and K. Yokoyama, “Radiometric calibration of the Hyperion imaging spectrometer instrument from primary standards to end-to-end calibration,” Proc. SPIE, vol. 4135, pp. 254–263, Aug. 2000. [6] J. S. Pearlman, S. Carman, P. Lee, L. Liao, and C. Segal, “Hyperion imaging spectrometer on the New Millennium Program Earth Orbiter-1 system,” in Proc. 1999 Int. Symp. Spectral Sensing Research (ISSSR’99) and the Int. Society for Photogrammetry and Remote Sensing (ISPRS) Commission 7, Working Group 1: Fundamental Physics and Modeling, Las Vegas, NV, Oct. 31–Nov. 4 31, 1999–November 4, 1999. [7] B. L. Markham, J. S. Schafer, F. M. Wood, Jr., P. W. Dabney, and J. L. Barker, “Monitoring large aperture spherical integrating sources with a portable radiometer during satellite instrument calibration,” Metrologia, vol. 35, no. 4, pp. 643–648, 1998. [8] P. Jarecke, K. Yokoyama, and P. S. Barry, “On-orbit solar radiometric calibration of the Hyperion instrument,” Proc. SPIE, vol. 4480, pp. 225–230, 2002. [9] H. H. Kieffer, P. Jarecke, and J. Pearlman, “Initial lunar calibration observations by the EO-1 Hyperion imaging spectrometer,” Proc. SPIE, vol. 4480, pp. 247–258, 2002. [10] H. H. Kieffer and R. L. Widley, “Establishing the moon as a spectral radiance standard,” J. Atmos. Oceanic Technol., vol. 13, no. 2, pp. 360–375, 1996. [11] T. C. Stone and H. H. Kieffer, “Absolute irradiance of the moon for on-orbit calibration,” Proc. SPIE, vol. 4814, pp. 211–221, 2002. [12] H. H. Kieffer, J. A. Anderson, and K. J. Becker, “Radiometric calibration of spacecraft using small lunar images,” Proc. SPIE, vol. 3870, pp. 193–205, 1999. [13] J. M. Anderson, H. H. Kieffer, and K. J. Becker, “Modeling the brightness of the moon over 350–2500 nm for spacecraft calibrations,” Proc. SPIE, vol. 4169, pp. 248–259, 2000. [14] H. H. Kieffer, T. C. Stone, R. A. Barnes, S. Bender, R. E. Eplee, Jr., J. Mendenhall, and L. Ong, “On-orbit radiometric calibration over time and between spacecraft,” Proc. SPIE, vol. 4481, 2002. [15] P. Jarecke, K. Yokoyama, and P. S. Barry, “On-orbit solar radiometric calibration of the hyperion instrument,” Proc. SPIE, vol. 4480, pp. 225–230, 2002. [16] P. J. Jarecke, P. S. Barry, J. S. Pearlman, and B. L. Markham, “Aggregation of Hyperion hyperspectral spectral bands into Landsat-7 ETM+ spectral bands,” Proc. SPIE, vol. 4480, pp. 259–263, 2002. [17] P. S. Barry, P. Jarecke, J. Pearlman, D. L. B. Jupp, J. Lovell, and S. Campbell, “Radiometric calibration validation of the Hyperion instrument using ground truth at a site in Lake Frome,” Proc. SPIE, vol. 4480, pp. 242–246, 2002. [18] R. O. Green, B. E. Pavri, and T. G. Chrien, “On-orbit radiometric and spectral calibration of EO-1 Hyperion derived with an underflight of AVIRIS and in situ measurements at Sala de Arizaro, Argentina,” IEEE Trans. Geosci. Remote Sensing, vol. 41, pp. 1194–1203, June 2003. [19] S. Biggar, K. J. Thome, and W. T. Wisniewski, “Vicarious radiometric calibration of EO-1 sensors by reference to high reflectance ground targets,” IEEE Trans. Geosci. Remote Sensing, vol. 41, pp. 1174–1179, June 2003. [20] N. Nelson and P. S. Barry, “Measurement of Hyperion MTF from on-orbit scenes,” in Proc. Int. Symp. Optical Science and Technology, July 29–August 3, 2001. [21] T. R. McVicar, T. G. Van Niel, and D. L. B. Jupp, “Geometric validation of Hyperion data acquired by Earth Observing 1 satellite at Coleambally irrigation area,” CSIRO Land and Water, Canberra, Australia, Tech. Rep. 46/01, 2001. [22] P. S. Barry, J. Shepanski, and C. Segal, “Hyperion on-orbit validation of spectral calibration using atmospheric lines and on-board system,” in Proc. Int. Symp. Optical Science and Technology, July 29–August 3, 2001. [23] L. Liao, P. Jarecke, D. Gleichauf, and T. Hedman, “Performance characterization of the hyperion imaging spectrometer instrument,” Proc. SPIE, vol. 4135, pp. 264–275, 2000. [24] T. J. Cudahy, A. P. Rodger, P. S. Barry, P. Mason, M. Quigley, M. Folkman, and J. S. Pearlman, “Assessment of the stability of the Hyperion SWIR module for hyperspectral mineral mapping using multi-date images from Mount Fitton, Australia,” in Proc. IGARSS, vol. 6, 2002, pp. 3504–3506. [25] D. L. B. Jupp, R. Green, and B. Carlson, private communication.
PEARLMAN et al.: HYPERION, A SPACED-BASED IMAGING SPECTROMETER
[26] B. Datt, T. R. McVicar, T. G. Van Niel, D. L. B. Jupp, and J. S. Pearlman, “Preprocessing EO-1 Hyperion hyperspectral data to support the application of agricultural indices,” IEEE Trans. Geosci. Remote Sensing, vol. 41, pp. 1246–1259, June 2003.
Jay S. Pearlman (M’84–SM’03) received the B.S. degree from the the California Institute of Technology, Pasadena, and the Ph.D. degree from University of Washington, Seattle. He is currently the Chief of Science and Applications for the Advanced Network Centric Operations, Phantom Works, Boeing Company, Seattle, WA, and is actively involved in remote sensing development and applications. Previously, he was with TRW, Redondo Beach, CA, and was Deputy Program Manager and Scientist for the Hyperion instrument on EO-1. In addition to instrument development, his activities include applications of remote sensing to agriculture and forestry using both airborne and space-based systems. Dr. Pearlman is an Associate Editor of the IEEE TRANSACTIONS ON GEOSCIENCE AND REMOTE SENSING.
Pamela S. Barry (M’01) received the B.S. degree from Rensselaer Polytechnic Institute, Troy, NY, the M.S. degree from the Massachusetts Institute of Technology, Cambridge, and the Ph.D. degree from The Ohio State University, Columbus. She is currently a Calibration Scientist with Raytheon’s Space and Aircraft Systems, El Segundo, CA. Previously, she was with TRW [now Northrop Grumman Space Technology (NGST)], Redondo Beach, CA, and led the on-orbit performance characterization and assessment of Hyperion. She has ten years of experience working on advanced experimental techniques that use imaging and point detectors to make quantitative measurements in a variety of applications. This experience includes instrument characterization and calibration from payload level and prelaunch preparations through on-orbit initialization and demonstration. Dr. Barry is a Member of the American Institute of Aeronautics and Astronautics Aerodynamic Measurement Technology Technical Committee and the American Society of Mechanical Engineers.
1173
Carol C. Segal received the B.S. degree from the University of Chicago, Chicago, IL, and the M.S. and Ph.D. degrees from the University of California, Berkeley, all in chemistry. She has been with TRW [now Northrop Grumman Space Technology (NGST)], Redondo Beach, CA, and has been a Deputy Program Manager for Operations with the National Aeronautics and Space Administration Goddard Space Flight Center, Greenbelt, MD, for the Hyperion hyperspectral imager project, responsible for instrument activation and checkout, mission planning, performance verification, and data processing. She is currently a Department Manager for the Sensors and Instruments Department, Laser and Sensor Products Center, NGST. Dr. Segal is a Member of the American Institute of Aeronautics and Astronautics and the Society of Women Engineers.
John Shepanski received the Ph.D. degree in physics from the University of Rochester, Rochester, NY, in 1982. He is currently a Senior Scientist in the Sensors and Instruments Department, Northrop Grumman Space Technology, Redondo Beach, CA, and was involved in the development and testing of the Hyperion hyperspectral imager on the National Aeronautics and Space Administration EO-1 satellite. He has been active in applications research and algorithm development in a number of fields: laser spectroscopy, Kalman filters, neural networks, robotics, hyperspectral remote sensing, and Bayesian belief nets.
Debra Beiso received the B.S. degree in wildlife biology/natural resource management from Colorado State University, in 1992. She has over 20 years experience with remote sensing hardware and software for military, civil, environmental, and natural resource applications. Areas of expertise include electro-optical sensor measurements for instrument characterization, in-flight/on-orbit sensor performance assessment, radiometric calibration, ground data processing, detection/correction of instrument artifacts, data exploitation, and end-user data products. She is a member of the Sensors and Instruments Department, Northrop Grumman Space Technology, Redondo Beach, CA, where she supports airborne and space-based hyperspectral sensor programs (EO-1 Hyperion, TRWIS III, and LWHIS) including sensor data acquisitions (laboratory and airborne), instrument characterization, in-flight and on-orbit performance assessment, radiometric calibration, and ground data processing.
Stephen L. Carman received the B.S.M.E. degree from the University of California, Berkeley. He currently teaches a Risk Management Workshop for the Professional Development Center, Northrop Grumman Space Technology (NGST), Redondo Beach, CA and as a University of California, Los Angeles extension class. He was the NGST Project Manager for the National Aeronautics and Space Administration (NASA) Goddard Space Flight Center Hyperion hyperspectral imager project, responsible for design, fabrication, assembly, test, and calibration of the first hyperspectral instrument for space. He manages the NASA-LaRC Clouds and the Earth’s Radiant Energy System (CERES) Project, and the National Oceanic and Atmospheric Administration NPOESS Earth’s Radiant Energy Suite. Mr. Carman is a Trustee and Past President of the Los Angeles Chapter of the Project Management Institute.