The PSF is the product of [Cdn, 'Pn, and In (the superscript n denotes that the respective values were normalized). tl/2 is .... gression analysis was also performed using SYSTAT. Standard ... mean (n = 9). PAH abbreviations: anthracene, ANT;.
Environmental Toxicology and Chemistry, Vol. 16, No. 11, pp. 2296-2303, 1997 @ 1997 SETAC Printed in the USA 0730-7268/97 $6.00 + .00
ISETA~/PRESS I
MECHANISTIC QUANTITATIVE STRUCTURE-ACTIVITY RELATIONSHIP MODEL FOR THE PHOTOINDUCED TOXICITY OF POLYCYCLIC AROMATIC HYDROCARBONS: II. AN EMPIRICAL MODEL FOR THE TOXICITY OF 16 POLYCYCLIC AROMATIC HYDROCARBONS TO THE DUCKWEED LEMNA GIBBA L. G-3 XIAO-DONG
HUANG, SERGEY N. KRYLOV,
LISHA REN, BRENDAN J. MCCONKEY,
D. GEORGE DIXON and
BRUCE M. GREENBERG* Department of Biology, University of Waterloo, Waterloo, Ontario N2L 3GI, Canada (Received 5 October 1996;Accepted 28 March 1997) Abstract-Rhotoinduced toxicity of polycyclic aromatic hydrocarbons (PAHs) occurs via photosensitization reactions (e.g., generation of singlet-state oxygen) and by photomodification (photooxidation and/or photolysis) of the chemicals to more toxic species. The quantitative structure-activity relationship (QSAR) described in the companion paper predicted, in theory, that photosensitization and photomodification additively contribute to toxicity. To substantiatethis QSAR modeling exercise it was necessaryto show that toxicity can be described by empirically derived parameters.The toxicity of 16 PAHs to the duckweed Lemna gibba was measured as inhibition of leaf production in simulated solar radiation (a light source with a spectrum similar to that of sunlight). A predictive model for toxicity was generated based on the theoretical model developed in the companion paper. The photophysical descriptors required of each PAH for modeling were efficiency of photon absorbance,relative uptake, quantum yield for triplet-state formation, and the rate of photomodification. The photomodification rates of the PAHs showed a moderate correlation to toxicity, whereas a derived photosensitization factor (PSF; based on absorbance,triplet-state quantum yield, and uptake) for each PAH showed only a weak, complex correlation to toxicity. However, summing the rate of photomodification and the PSF resulted in a strong correlation to toxicity that had predictive value. When the PSF and a derived photomodification factor (PMF; based on the photomodification rate and toxicity of the photomodified PAHs) were summed, an excellent explanatory model of toxicity was produced, substantiating the additive contributions of the two factors. Keywords-Polycyclic Photosensitization
aromatic hydrocarbons
Phytotoxicology
INTRODUCTION
F
'
or ecotoxlco
I
'
oglc
mo
d I
'
"
e mg, quantitative
t
s ructure-actlv-
'
toxicity
Photomodification
sitizing molecule absorbing a photon, which elevates it to the excltea smglet state lli,Yj, l'rom there the molecule can be
'
,
't I t h (QSAR ) f If I t th h lyre a Ions IpS s are use u or corre a mg e p ysical propertiesof chemicals to given biological responses[1,2]. Such QSARs allow prediction of the potential hazards of untestedcompounds,identification of the physical traits of chemicals that contribute to their biological impacts, descriptions of the routes of chemical interaction with an organism, and elucidation of the mechanisms of toxicity, In developing a model, consideration of the attributes of the environmental compartment in which the contaminant of interest resides is essential,as this will dictate which of the contaminant's physical properties are likely to be most influential in toxicity. Becausesolar radiation is ubiquitous in the environment and can enhancethe toxicity of polycyclic aromatic hydrocarbons (PAHs) [3-6], it representsa modifying environmental factor that should be consideredin QSAR toxicity modeling for these chemicals, The primary photochemical reactions of PAHs can impact negatively on living organisms [3-7], In the companion paper [8], these principles were used to derive a theoretical QSAR model for photoinduced toXicity of PAHs based on photosensitization and photomodification reactions, Photosensitization reactions usually proceed via formation of highly reactive singlet-state oxygen CO2) [5,7], The processbegins with the sen'
Photoinduced
transformed by intersystem crossing to the exCItedtriplet state, , " 3 where It can react wIth ground trIplet-state oxygen (-°2) to for~ 1°2, Singlet-state oxygen formed within a biologi,cal orgamsm IS, hIghly damagmg [,10,1~], Photomo~lficatlOn of PARs, whIch usually occurs Via oxIdatIon reactIOns[12,13], generally increases the toxicity of the PARs by formation of new compounds with toxicologic properties distinct from the parent PARs [6,13-15], In the companion paper [8] distinct photosensitization constants (PSC) and photomodification constants(PMC) were derived for each PAR, to describe the contributions to toxicity of the photosensitization reactions and the impact of the photomodified compounds, Further, the PSC and PMC were theoretically shown to additively contribute to toxicity, This paper reports on the validation of the theoretical model based on independently measured parameters for each PAH that were suggested in the companion paper [8] to be determinants in photoinduced toxicity. Lemna gibba L. was chosen for this study and that in the companion paper [8] becauseat the level of photosynthesisand leaf morphology it is a typical C-3 plant [16], However, becausethe leaves are in direct contact with the aqueousmedium and the plant takes up chemicals through the underside of the leaf [16], QSAR modeling can be based
'
on a two-compartment system, growth medium and leaf tissue, The parameters were the integral of the overlap between the
* To whomcorrespondence may be addressed, 2296
Empirical QSAR model for photoinduced toxicity of PAHs
Environ.
Toxieo!. Chern. 16, 1997
2297
Table I. Physical constants and toxicity data used for the calculation of photosensitization factors (PSFs) and photomodification factors (PMFs). Toxicity is inhibition of growth of Lemna gibba by the intact polycyclic aromatic hydrocarbons (PAHs) :i: standard deviation, n = 9. [CLL in J.Lmol/gfresh weight, is plant uptake of PAH. 'P is the quantum yield for triplet-state formation [20-23]. J represents absorption of simulated solar radiation (SSR) by the PAH [8]. The PSF is the product of [Cdn, 'Pn,and In (the superscript n denotes that the respective values were normalized). tl/2 is the half-life in h of the PAH in SSR, and km(h-I) is the exponential decay rate constant based on tl/2 [8]. ~m is the normalized value of the toxicity (inhibition of growth) of the fully photomodified PAHs to L. gibba. The PMF is the product of k:;,and ~m PAHa
ANT BAA BBA BBF BGP BAP BEP CHR COR OAA OAP FLA FLE PHE PYR TRI
Toxicity
[Cd
'P
J
[Cdn
'Pn
1"
PSF
t1/2
km
k:;,
~m
PMF
0.019 0.006 0.009 0.023 0.044 0.039 0.030 0.010 0.032
2 5 27 70 100 52 75 56 100
0.347 0.139 0.026 0.010 0.007 0.013 0.009 0.012 0.007
1.000 0.401 0.075 0.029 0.020 0.038 0.026 0.035 0.020
1.00 1.00 0.97 0.66 0.26 0.98 0.78 0.74 0.55
1.000 0.401 0.073 0.019 0.005 0.037 0.020 0.026 0.011 0.021 0.031 0.043 0.032 0.039 0.020 0.018
1.000 :i: 0.024
0.080
0.60
36.9
0.250
0.63
0.745 ::t:0.014
0.012
0.80
58.7
0.038
0.84
0.259 ::t: 0.038 0.354 :t 0.061 0.139:i: 0.043 0.255 :i: 0.024 0.165 :i: 0.057 0.016 :i: 0.026 0.118 :i: 0.052
0.035 0.093 0.054 0.046 0.051 0.039 0.037
0.65 0.50 0.60 0.40 0.70 0.67 0.80
37.0 46.5 126.2 200.3 78.8 34.8 102.0
0.109 0.291 0.169 0.144 0.159 0.122 0.116
0.68 0.53 0.63 0.42 0.74 0.70 0.84
0.119 0.190 0.120 0.150 0.408 0.647 0.255 0.112 0.330
0.085 :i: 0.038
0.058
0.50
144.2
0.181
0.53
0.466
0.044
16
0.043
0.124
0.17
0.458 0.580 0.160 0.104 0.170 0.071
0.045 0.288 0.236 0.320 0.251 0.094
0.50 0.60 0.31 0.80 0.27 0.95
309.5 84.8 3.0 8.9 72.7 8.9
0.141 0.900 0.738 1.000 0.784 0.294
0.53 0.63 0.33 0.84 0.28 1.00
1.000 0.274 0.010 0.029 0.235 0.029
0.074 0.156 0.002 0.024 0.052 0.008
40 40 19 14 46 65
0.017 0.017 0.037 0.050 0.015 0.011
0.049 0.049 0.107 0.144 0.043 0.032
0.64 0.88 0.30 0.27 0.45 0.58
:i: 0.028 :i: 0.061 :t 0.071 :i: 0.043 :i: 0.024 :i: '0.043
, Names of PAHs are given in Figure 1.
spectrum of the simulated solar radiation (SSR) source and the absorption spectrum of the PAR (1), uptake of a given PAR ([Cd), quantum yield for triplet-state formation «p), rate of photomodification (km), and toxicity of a given photomodified PAR (Tpm)'The parameters were combined to provide both predictive and explanatory QSAR models of toxicity. MATERIALS
AND METHODS
Prior to chemical treatment, L. gibba L. G-3 was cultured axenically on half-strength Hutner's medium under 60 !-lmol m2 s of continuous cool-white fluorescent light [6]. The irradiation source for plant growth during chemical treatment was SSR at a total photon fluence rate of 100 !-lmol m2 s based on integration from 290 to 700 nm [6,8,15]. Plants were placed on 10 ml of fresh half-strength Hutner's medium in 5-cm petri dishes and exposed to a given PAH at 2 mg L for both the intact and photomodified forms as previously described [6,8]. In this set of experiments the PARs and medium were not replenished during the experiment to allow sufficient time for the slowly photomodified PAHs to form large amounts ofphotoproducts. The primary toxicity endpoint employed was inhibition of plant growth as determined by leaf production [16]. Plant growth was monitored over an 8-d period by counting leaves in 2-d intervals. Data for the number of leaves produced as a function of time were converted to growth rates of the plants and presented as inhibition of growth in the presence of a PAH. Toxicity was also assessedby measuring the fresh weight of the plants 'and quantifying the chlorophyll content of the leaves [16]. All toxicity tests were performed in triplicate with a minimum of three independent replicates per test (n = 9). The data for the rate of PAH photomodification were taken from the companion paper[8] and are presentedhere in Table 1. Uptake of intact PARs, [Cd, was estimatecjby measuring the PAH concentration in the growth medium after incubation of L. gibba in medium containing 2 mg L of the intact PAH in darknessfor 48 h. This period is sufficient for the chemicals to come to a steady state in plant tissue [17]. The dimethyl-
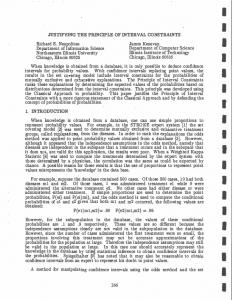
sulfoxide (DMSO) delivery solvent does not change the kinetics of uptake [17]. Additionally, the chemicals were shown to occur in cellular membranes,not in leaf cuticles [17]. After incubation, the PARs remaining in solution and adsorbed to the petri dish were assayedspectrophotometrically following dichloromethane extraction. The difference between the starting and the final concentrations was the amount taken up by the plant leaf, as the PARs used are not lost by volatilization [18]. The amount of PAR taken up, [Cd, was then calculated on a plant fresh weight basis (f1mol/g fresh weight; Table 1). The data were then normalized to the PAR with the highest tissue concentration (phenanthrene)to generaterelative tissue concentrations, [Cd" (Table 1). Although this does not provide a bioaccumulation factor, it does allow ranking of the relative (or normalized) uptake of each PAR by L. gibba, which was sufficient for modeling. The tissue concentrations reported in Table 1 were consistent with the results of a recently completed extensive study on PAR uptake by L. gibba [17]. Linear and log-linear least squares regressions were performed to determine the quality of the correlation of a given parameter(s) to toxic strength. The regression analyses were performed with Sigma Plot (Jandel Scientific Software, San Rafael, CA, USA) and SYSTAT (Version 5.05 for Windows, Evanston, IL, USA). The strength (r2) and significance (P) of the correlations are reported for each regression. Multiple regression analysis was also performed using SYSTAT. Standard deviations and standarderrors were calculated as neededusing SYSTAT (in all casesn = 9). RESULTS Inhibition of plant growth in the presence of intact and photomodified PARs in SSR When the intact PARs were applied to the plants in the presence of SSR, inhibition of growth ranged from :::;10% (CRR, FLE, COR, and DAA [names of PARS are given in Fig. 1]) to 97% (ANT) (Fig. 1 and Table 1). Growth inhibition for each of the 16 PARs in photomodified form was also measured (Fig. 1) and ranged from about 20% for DAA to 100%
2298
Environ. Taxiea/. Chern. 16, 1997 I2lillPhotomodified
-~ C
II
X.-D. Huang et al.
Intact
E'2 ::sO U:;:; u.-
60
.E .c 40 3
ca;8 50 -.c: .c:c: 1:11.-
.-
~ !! , 1
.c: UI !!! u.
,1
1'[' ':
"
,
It~iI~I~
T
.,
,
'
,',
I!~II ",. ,i
.,."
,
1 '
,
,
,
.
",
"'.,,
~
,
,
"
,,
~
."",
.',
;~
,
;,
,
:,
,.,
,
.,
~' : ' "'
,:
,:,
1
."
;
[
0
GI"': ;:---
.
20 0'
a
:;
0
~ C)
y=10.36+1.10x r2= 0.91 p < 0.001
:;
80
;:
;§ .c
100 A
c: 0
I
,
0
1/""","""",';l1li";"""";""\\';""""_1/"-"""""1')""""""l1li1"'l1li1,,/,l1li11"'II1II1'"!1IIII1'i!!1IIII
~
~
W
W
~
~
~
~
~
~
~
~
~
~
~
~
~ ~ K ~ ~ ~ ~ 8 5 ~ ~ ~ ~ ~ ~ ~
100
B
y= -6.89+1.19x r2 = 0.85
Fig. I. Photoinduced toxicity of intact and photomodified polycyclic aromatic hydrocarbons (PAHs) to Lemna gibba. Plants were grown in simulated solar radiation with the chemicals at 2 mg/L. Growth was monitored by counting leaves and is presented as percent inhibition of growth relative to the controls. Error bars representstandard error of the mean (n
=
9). PAH abbreviations:
anthracene, ANT;
benzo[a]anthracene, BAA; benzo[b]anthracene, BBA; benzo[b]fluorene, BBF; benzo[g,h,i]perylene, BGP; benzo[a]pyrene, BAP; benzo[e]pyrene, BEP; chrysene, CHR; coronene, COR; dibenzo[a,i]anthracene, DAA; dibenzo[a,h]pyrene, DAP; fluoranthene, FLA; fluorene, FLE; phenanthrene,PHE; pyrene, PYR; triphenylene, TRI.
~ 1/1 'Iii 0 .. 0 :c