This article has been accepted for publication in a future issue of this journal, but has not been fully edited. Content may change prior to final publication. Citation information: DOI 10.1109/JBHI.2016.2620496, IEEE Journal of Biomedical and Health Informatics
JBHI-00235-2016
1
Identification of Location Specific Feature Points in a Cardiac Cycle Using a Novel Seismocardiogram Spectrum System Wen-Yen Lin, Member, IEEE, Wen-Cheng Chou, Po-Cheng Chang, M.D., Chung-Chuan Chou, M.D., Ming-Shien Wen, M.D., Ming-Yun Ho, M.D., Wen-Chen Lee, M.D., Ming-Jer Hsieh, M.D., Chung-Chih Lin, Tsai-Hsuan Tsai, and Ming-Yih Lee, Member, IEEE
Abstract—Seismocardiogram (SCG) or Mechanocardiography (MCG) is a non-invasive cardiac diagnostic method; however, previous studies used only a single sensor to detect cardiac mechanical activities which will not be able to identify location-specific feature points in a cardiac cycle corresponding to the four valvular auscultation locations. In this study, a multi-channel SCG spectrum measurement system was proposed and examined for cardiac activity monitoring to overcome problems like, position dependency, time delay, and signal attenuation, occurring in traditional single channel SCG systems. ECG and multi-channel SCG signals were simultaneously recorded in twenty-five healthy subjects. Cardiac echocardiography was conducted at the same time. SCG traces were analyzed and compared with echocardiographic images for feature point identification. Fifteen feature points were identified This work was supported in part by the Ministry of Science and Technology, Taiwan, R.O.C. under Grant No. MOST 104-2627-E-182-001, MOST104-2754-8-182-001, MOST 103-2221-E-182-003 and MOST 104-2221-E-182-013, as well as CGU fund BMRPC50 and BMRP138. The funder had no role in study design, data collection and analysis, decision to publish, or preparation of the manuscript. Wen-Yen Lin and Wen-Cheng Chou are with the Department of Electrical Engineering and Center for Biomedical Engineering / College of Engineering, Chang Gung University, Taoyuan 333, Taiwan, ROC. Wen-Yen Lin currently is also an adjunct researcher of the Division of Cardiology, Department of Internal Medicine, Chang Gung Memorial Hospital, Linkou, Taoyuan, Taiwan, ROC.( email:
[email protected],
[email protected]). Po-Cheng Chang, Chung-Chuan Chou, Ming-Shien Wen, Ming-Yun Ho, Wen-Chen Lee, and Ming-Jer Hsieh are with the Division of Cardiology, Department of Internal Medicine, Chang Gung Memorial Hospital, Linkou, Taoyuan, Taiwan, ROC. Po-Cheng Chang, Chung-Chuan Chou, Ming-Shien Wen, and Ming-Jer Hsieh are also with the College of Medicine, Chang Gung University, Taoyuan 333, Taiwan, ROC (email:
[email protected],
[email protected],
[email protected],
[email protected],
[email protected], and
[email protected]). Chung-Chih Lin is with the Department of Computer Science and Information Engineering / Center for Biomedical Engineering, College of Engineering, Chang Gung University, Taoyuan 333, Taiwan, ROC. He is also with the Department of Neurosurgery, Chang Gung Memorial Hospital, Linkou, Taoyuan, Taiwan. (email:
[email protected]). Tsai-Hsuan Tsai is with the Department of Industrial Design, Chang Gung University, Taoyuan 333, Taiwan, ROC. She is also an adjunct researcher of the Division of Cardiology, Department of Internal Medicine, Chang Gung Memorial Hospital, Linkou, Taoyuan, Taiwan, ROC (email:
[email protected]). Ming-Yih Lee is the corresponding author of this manuscript and he is with the Graduate Institute of Medical Mechatronics / Center for Biomedical Engineering, College of Engineering, Chang Gung University, No. 259, Wenhwa 1st Rd., Kweishan Dist., Taoyuan 333, Taiwan, ROC. He is also an adjunct researcher of the Division of Cardiology, Department of Internal Medicine, Chang Gung Memorial Hospital, Linkou, Taoyuan, Taiwan, ROC. (email:
[email protected], tel: +886-3-2118800 x5340, fax: +886-3-2118234).
in the corresponding SCG traces. Among them, six feature points, including left ventricular lateral wall contraction peak velocity (LCV), septal wall contraction peak velocity (SCV), trans-aortic peak flow (AF), trans-pulmonary peak flow (PF), trans-mitral ventricular relaxation flow (MFE) and atrial contraction flow (MFA) were identified. These new feature points were not observed in previous studies because the single-channel SCG could not detect the location-specific signals from other locations due to time delay and signal attenuation. As the results, the multi-channel SCG spectrum measurement system can record the corresponding cardiac mechanical activities with location-specific SCG signals and six new feature points were identified with the system. This new modality may help clinical diagnoses of valvular heart diseases and heart failure in the future. Index Terms—cardiac diagnostic method, heart failure, seimocardiography (SCG), valvular heart diseases
I. INTRODUCTION
C
ARDIOCASCULAR diseases are the leading causes of death in the world [1],[2]. The mortality rate of cardiovascular diseases is about 230 - 1700 per 100,000 populations, accounting for 24-47% of total death. Detection and diagnosis of cardiovascular diseases rely on a number of clinical modalities, including electrocardiogram (ECG), echocardiography, computerized tomography (CT) scan, magnetic resonance imaging (MRI) and nuclear myocardial perfusion scan. ECG plays an important role in the initial diagnosis and ambulatory monitoring of cardiovascular diseases. However, ECG is composed of the summation of cardiac electric signals but does not represent cardiac mechanical activities. Echocardiography is a better modality to exam cardiac function and anatomy. However, in most medical institutes, echocardiography exam is costly, time-consuming and usually not immediately available. In 1939, Starr et al recorded traces of cardiac mechanical activities on chest surface, and the recording modality was named ballistocardiogram (BCG) [3]. The authors also reported that the smaller amplitude of BCG was associated with shorter survival in patients with heart diseases [4]. Although limited information about cardiac function was revealed, the relationship between cardiac function and the amplitude of BCG was a reasonable explanation. Salerno et al recorded cardiac vibration waves using an accelerometer attached to the
2168-2194 (c) 2016 IEEE. Translations and content mining are permitted for academic research only. Personal use is also permitted, but republication/redistribution requires IEEE permission. See http://www.ieee.org/publications_standards/publications/rights/index.html for more information.
This article has been accepted for publication in a future issue of this journal, but has not been fully edited. Content may change prior to final publication. Citation information: DOI 10.1109/JBHI.2016.2620496, IEEE Journal of Biomedical and Health Informatics
JBHI-00235-2016 sternum, and the modality was named seismocardiography (SCG) [5],[6]. The authors compared SCG traces and Doppler echocardiography to identify several feature points: mitral valve opening (MO), mitral valve close (MC), aortic valve opening (AO), aortic valve close (AC) and cardiac rapid ejection (RE). They also showed amplitude change in patients received coronary angiography followed by nitroglycerin injection or percutaneous transluminal angioplasty. SCG had been investigated to optimize atrioventricular (AV) and ventricular-to-ventricular (VV) delays in patients with biventricular pacemaker (cardiac resynchronization therapy, CRT) implantation [7]. The results support the recording of cardiac mechanical signal for clinical diagnoses of heart diseases. Accordingly, a clinical modality was also developed for the recording of SCG signals. Later, Crow et al. revealed additional 4 feature points including isovolumic movement (IM), isotonic contraction (IC), peak of rapid diastolic filling (RF), and peak of atrial systolic (AS) acquired at the tricuspid valve site [8]. Recently, the cardiac mechanical signal recording has become an emerging method because the development of microelectromechanical systems (MEMS) -based accelerometers make miniaturization of BCG/SCG measurement feasible and ECG-based systems cannot be shrunk into the scale as integrated circuit (IC) technology [9]. The recent advances of BCG/SCG technologies were also detailed reviewed in [10] and the authors suggested that the physiological meanings of the signals must be studied and discussed further. However, most investigators recorded BCG or SCG signals using a single accelerometer placed on the sternum, where summation of cardiac vibration was acquired. The single-channel recording method does not define the exact sources of signals and is not able to differentiate the location
2
whenever an abnormal finding is detected. Therefore, Zanetti et al suggested multi-channel SCG to record complete signals from a whole heart in a review article [11]. It is better for detection of cardiac diseases with multi-channel signal acquisition, which may partly reduce the influence of signal attenuation and timing delay in the single-channel method. Moreover, no research article about the multi-channel SCG had been published so far. Sarlabous et al first introduced mechanocardiography (MCG) as an alternative name of SCG or BCG to represent the signal recording of cardiac mechanical activities [12]. Although MCG is more meaningful and precise to represent the mechanical vibrational signals from cardiac activities, the term SCG is used to avoid confusion in the readers. In this study, we sought to develop a multi-channel SCG technique to record location-specific signals and to identify more feature points as compared to the single-channel SCG. Cardiac mechanical vibrations are generated by valvular motion, blood flow, myocardial contraction and relaxation. Four accelerometers were placed at the clinically four valve auscultation sites in this study. We hypothesized that the multi-channel SCG system could record location-specific waveforms, and the cardiac mechanical characteristics could be extracted from the location-specific traces to discover new feature points. Analysis of SCG and Doppler echocardiography in twenty-five healthy subjects was conducted to identify new feature points and to determine the timing sequence of these new feature points. II. MATERIAL AND METHODS This study was reviewed and approved by the institutional review board (IRB) of the Chang Gung Memorial Hospital. Twenty-five healthy subjects, 13 males and 12 females, with no known cardiac conditions were enrolled in this study. Written
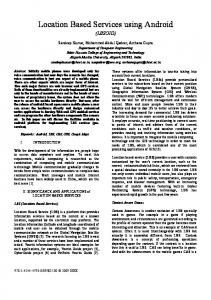
Fig. 1. System framework of the proposed multi-channel accelerometer-based SCG spectrum measurement system and echocardiography.
2168-2194 (c) 2016 IEEE. Translations and content mining are permitted for academic research only. Personal use is also permitted, but republication/redistribution requires IEEE permission. See http://www.ieee.org/publications_standards/publications/rights/index.html for more information.
This article has been accepted for publication in a future issue of this journal, but has not been fully edited. Content may change prior to final publication. Citation information: DOI 10.1109/JBHI.2016.2620496, IEEE Journal of Biomedical and Health Informatics
JBHI-00235-2016 and informed consents were obtained from these subjects. ECG and multi-channel SCG signals were simultaneously recorded and compared with echocardiographic images in the proposed system framework. A. System Framework - SCG, ECG, and Echocardiography The multi-channel accelerometer-based SCG spectrum measurement system synchronized with echocardiography was proposed to obtain location-specific SCG waveforms and to extract new SCG feature points (Fig. 1). The self-built system included 3 sub-systems: the multi-channel SCG measurement, the 3-lead ECG recording and the synchronous data collection subsystems. The multi-channel SCG measurement system was composed of multiple accelerometer sensing modules and an embedded micro-controller system board. The accelerometer sensing modules were placed at four valvular auscultation sites for SCG signal acquisition and were connected to the embedded micro-controller system board for data processing and conversion. The analog SCG and ECG signals were amplified, filtered and transferred to the host computer through the synchronous data collection subsystem for data processing, storage, and display. All the accelerometer sensing modules were electrically isolated to avoid electrical interference. The core of the sensing modules was the accelerometer (LIS331DLH, from STMicroelectronics, Geneva, Switzerland), which was set for a sensing range of ± 2g at a 12-bit digital data resolution and a sensitivity of 1 mg (1mg = 2-10 g, i.e. 1/1024g, where g is the gravity force). The embedded micro-controller system board in the multi-channel SCG measurement subsystem was equipped with the micro-controller (ADuC7020, from Analog Devices Inc, Cambridge, Massachusetts, United States), which communicated with multiple accelerometer sensing modules using inter-integrated circuit (I²C) interface. Data were collected by the micro-controller, processed and converted to
3
analog signals with the built-in Digital-to-Analog Converters (DACs), and subsequently connected to the synchronous data collection subsystem (PowerLab 16/35, from AD Instruments, Dunedin, New Zealand). At the meantime, the output analog signals from the Bio Amplifier of the 3-lead ECG signals were also connected to the synchronous data collection subsystem. As the results, all the SCG and ECG signals were sampled at a frequency of 400Hz in the data collection subsystem and the synchronized data consisting of multi-channel SCG and ECG signals were transmitted to the host computer. An echocardiographic system (GE Healthcare, VIVID 7, Little Chalfont, United Kingdom) with a 2.5-MHz phased-array multi-frequency transducer (M4S) was used. The M-mode and Doppler images from echocardiographic system were recorded and synchronized with ECG signal. The timing of valvular opening and closing was identified with m-mode echocardiographic images. The timing of peak blood flow through each valve was identified using pulse-wave Doppler images. Tissue Doppler was used for left ventricular wall motion of the six segments. The whole data processing flow is very similar with the work described in [13], where the collected raw signals went through denoising process and then features were extracted before signal classification. The results present in this work are the novel findings in multi-channel SCG spectrum system during the feature extraction with the proposed framework. B. Testing Procedures Simultaneous SCG and ECG signals were acquired from twenty-five healthy subjects at supine position. The schematic diagram of sensor placement is shown in Fig. 2(A). Four SCG sensors were placed at the heart auscultation sites for mitral, tricuspid, aortic and pulmonary valves. Three ECG leads were placed at right and left arms and the left leg. We chose lead I ECG traces as the standard lead for data analysis and
Fig. 2. (A) Locations of SCG sensor placement. (B) Synchronized SCG traces, Echocardiographic images, ECGs, for feature point identification.
2168-2194 (c) 2016 IEEE. Translations and content mining are permitted for academic research only. Personal use is also permitted, but republication/redistribution requires IEEE permission. See http://www.ieee.org/publications_standards/publications/rights/index.html for more information.
This article has been accepted for publication in a future issue of this journal, but has not been fully edited. Content may change prior to final publication. Citation information: DOI 10.1109/JBHI.2016.2620496, IEEE Journal of Biomedical and Health Informatics
JBHI-00235-2016 comparison. Heart and respiratory rates were checked to make sure that the subjects were in stable and resting condition during data acquisition. Each subject received three sessions of 5-minute data acquisition with a 5-minute break between sessions. Echocardiography was performed immediately after the SCG and ECG recording by a single echocardiographer. Lead I ECG was recorded with 3 electrodes placed at the same locations as in the SCG testing. Standard parasternal long, parasternal short, apical four-chamber, apical two-chamber and apical long views were performed for all image recording and measurements. The timing of valvular opening and closing was identified with m-mode echocardiographic images. The timing of peak blood flow through each valve was identified using pulse-wave Doppler images. Tissue Doppler was used for left ventricular wall motion of the six segments. After the images were obtained, cine loops were transferred to a computer for off-line analysis using the GE EchoPAC Dimension system. Fig. 2(B) shows the location-specific SCG traces and echocardiography images with synchronized ECG signals, for new feature point identification. C. Data Analysis Similar methodology as in [8] for data analysis was adopted to find the relationship between SCG traces and echocardiography images was adopted in this research. The acquired SCG traces and echocardiographic images were synchronized and aligned on the R-peak of ECG signals from both systems for at least three consecutive similar R-R intervals of the lead I traces. By simultaneously comparing SCG traces and echocardiography images, the onset timings of the cardiac activity events identified in echocardiography images by an experienced cardiologist are then mapped to the multi-channel SCG traces acquired from each valvular site. As the results, feature points of SCG traces representing corresponding cardiac events could be extracted. This kind of visual inspection of echo images are also well accepted in clinical practice. Continuous variables with normal distribution were expressed as the mean ± standard deviation, and categorical variables were expressed as number (percentage). III. RESULTS Table I shows the characteristics of the twenty-five healthy subjects in this study. Both male and female subjects are included with age range of 21~28 in males and 20~40 in females. The subjects did not have history of valvular heart diseases, coronary artery diseases, congenital heart diseases, cardiomyopathy, major systemic diseases or taking regular medications. TABLE I CHARACTERISTICS OF TEST SUBJECTS Gender Number of Subjects group
Age
Height (m)
Weight (kg)
BMI
Male
13
21 ~ 28
1.65 ~ 1.8
54 ~ 101
18.7 ~ 32.6
Female
12
20 ~ 40
1.54 ~ 1.69
45 ~ 78
18.97 ~ 29
4
A. SCG Feature Points Identified Previously
Fig. 3. Nine SCG feature points reported previously in Tricuspid channel.
All feature points reported previously were also observed using the proposed multi-channel SCG measurement system. As shown in Fig. 3, the 9 feature points identified previously by Dr. Crow [8], including mitral valve close (MC), iso-volumic movement (IM), aortic valve open (AO), isotonic contraction (IC), aortic valve close (AC), mitral valve open (MO), cardiac rapid ejection (RE), peak of rapid diastolic filling (RF), and peak of atrial systolic (AS) can be identified in the SCG traces acquired at the conventional tricuspid valve site. B. New SCG Feature Points In this study, six new feature points which have never been investigated in previous BCG/SCG/MCG researches were identified at the corresponding valvular locations (Fig. 4): left ventricular lateral wall contraction peak velocity (LCV), septal wall contraction peak velocity (SCV), trans-aortic valvular peak flow (AF), transpulmonary peak flow (PF), trans-mitral atrial contraction peak flow (MFA) and trans-mitral ventricular relaxation peak flow (MFE). The naming rules for these 6 new feature points were introduced below: the first letter indicates the source of the cardiac activities, (e.g., “A” stands for trans-aortic valve, “L” stands for left ventricular lateral wall, “M” stands for trans-mitral valve, “P” stands for trans-pulmonary valve, and “S” stands for septal wall); the second and/or third letters indicate the types of cardiac activities, (e.g., “F” stands for peak blood Flow, “CV” stands for contraction peak myocardial velocity). The detailed description of each feature point is provided as follows. 1) Left ventricular lateral wall contraction peak velocity (LCV) feature point A left ventricular lateral wall contraction peak velocity (LCV) feature point was identified by matching the mitral valve SCG traces with the tissue Doppler images of the left ventricular lateral wall, as shown in Fig 4a. The LCV feature point represents the instant at which left ventricular lateral wall contracts at peak velocity. It is compatible with the physiology that left ventricular lateral wall contraction at peak velocity, pushing the left ventricular apex toward the chest wall, which is the acquisition location of this SCG recording site. 2) Interventricular septal wall contraction peak velocity (SCV) feature point An interventricular septal wall contraction peak velocity (SCV) feature point could be identified by matching the tricuspid valve SCG traces with the tissue Doppler echocardiography images of the interventricular septal wall, as shown in Fig 4b. The tricuspid valve acquisition site was used because the interventricular septum is beneath the tricuspid valve SCG acquisition site. The SCV feature point represents the instant at which the septal wall contracts at the peak velocity.
2168-2194 (c) 2016 IEEE. Translations and content mining are permitted for academic research only. Personal use is also permitted, but republication/redistribution requires IEEE permission. See http://www.ieee.org/publications_standards/publications/rights/index.html for more information.
This article has been accepted for publication in a future issue of this journal, but has not been fully edited. Content may change prior to final publication. Citation information: DOI 10.1109/JBHI.2016.2620496, IEEE Journal of Biomedical and Health Informatics
JBHI-00235-2016 It is compatible with the physiology during cardiac systole, at which the interventricular septum moves toward posterior wall, making a downward shift of the chest wall. The time difference between SCV and LCV provide the information about synchronicity of LV contraction, and the relationship between SCV and LCV may be applied clinically to evaluate cardiac dyssynchrony. 3) Trans-aortic valve peak flow (AF) feature point Trans-aortic valve peak flow (AF) feature point was identified by matching the aortic valve SCG traces with the pulse-wave Doppler echocardiographic images of the aortic valve (Fig 4c). The AF feature point represents an upstroke trans-aortic blood flow following aortic valve opening (AO) in the aortic valve SCG trace. The pattern is compatible with the physiology of rapid blood flow ejection through the aortic valve to the aorta. Interestingly, the AF feature point was a downward notch in the mitral valve SCG traces, and the pattern is also compatible with volume reduction of the left ventricle at the moment of rapid blood flow ejection.
5
4) Transpulmonary peak flow (PF) feature point Similar to the AF feature point, the transpulmonary peak flow (PF) feature point was identified by matching the pulmonary valve SCG trace with the pulse-wave Doppler echocardiographic images, as shown in Fig 4d. The PF feature point represents an upstroke of trans-pulmonary blood flow following pulmonary valve opening. The upstroke pattern is compatible with the physiology of rapid blood flow ejection through the pulmonary valve to the lung. 5) Trans-mitral atrial contraction peak flow (MFA) and trans-mitral ventricular relaxation peak flow (MFE) feature points The trans-mitral ventricular relaxation peak flow feature point (MFE) and trans-mitral atrial contraction peak flow (MFA) were identified by matching the mitral valve SCG trace with the pulse wave Doppler echocardiographic images. As shown in Fig 4e, these two upstrokes on the SCG traces are compatible with the physiology of mitral inflow, which pushes the left ventricular apex toward the chest wall, where the mitral valve SCG acquisition site is located.
Fig. 4. Six new feature points identified. (a) Left ventricular lateral wall contraction peak velocity (LCV) feature point, (b) septal wall contraction peak velocity (SCV) feature point, (c) trans-aortic valve peak flow (AF) feature point, (d) transpulmonary peak flow (PF) feature point, (e) trans-mitral ventricular relaxation peak flow (MFE) feature point and trans-mitral atrial contraction peak flow (MFA) feature point.
2168-2194 (c) 2016 IEEE. Translations and content mining are permitted for academic research only. Personal use is also permitted, but republication/redistribution requires IEEE permission. See http://www.ieee.org/publications_standards/publications/rights/index.html for more information.
This article has been accepted for publication in a future issue of this journal, but has not been fully edited. Content may change prior to final publication. Citation information: DOI 10.1109/JBHI.2016.2620496, IEEE Journal of Biomedical and Health Informatics
JBHI-00235-2016 C. Timing of the new feature points Similar to ECG parameters, such as PR interval, QRS duration and QT interval, timing of the feature points may vary beat by beat and subject by subject. However, the normal ranges of the feature point timing events may be useful for clinical diagnosis. In this study, the timing of each feature point was defined as time lag from the peak of R wave of ECG in each cardiac cycle. The values were derived from 10 consecutive beats in each subject. Table II shows the summarized results (average and standard deviation of the onset timing from R-peak) and Fig. 5 shows the sequence of timing of these new feature points in a cardiac cycle. The timing of AF and PF are very close to each other. Among the test subjects, some subjects have AF occurring before PF and others have PF occurring before AF. This is because that the timings of trans-aortic valve and trans-pulmonary valve flow are very close and are variable physiologically in each subject, their sequence depends on several factors, such as intrinsic heart conduction (the presence of bundle branch block), the presence of valvular heart diseases, the presence of pulmonary hypertension or respiratory cycles (inspiration or expiration). Because of the similarity in timing, we defined the AF and PF feature points in aortic and pulmonary sites respectively by matching the results of echocardiography and SCG. In Table II, significant difference (-17.9%) of the MFE feature point timing between male and female subject groups is also observed. This is because that the feature point MFE is related to trans-mitral valve flow of left ventricular relaxation, following ventricular contraction. The timing of trans-mitral valve relaxation is directly linked to QT interval, which is associated with action potential duration in cardio-myocytes [14]. In previous studies, women have longer QT interval [15] and action potential duration is also longer in female animals [16],[17]. The findings indicate that female subjects have a longer systolic duration and later relaxation, leading to the later MFE timing. The standard deviations shown in Table II represent the inter-subject variability of the feature points identified in this work. Larger standard deviations on some feature points mean that they are having wider range of the onset timing among different subjects. However, the onset timing of these feature points are with less variation, i.e. smaller standard deviation, on the same subject, which are not showing in this table. TABLE II TIMING OF 6 NEW FEATURE POINTS ΔT (Event_Time - R_peak) (ms) Subject Group
Male Female Δ
LCV (MV)
SCV (TV)
AF (AV)
PF (PV)
MFE (MV)
MFA (MV)
73.0 ±23 73.0 ±11.8
92.0 ±5.3 92.0 ±10.1
128.0 ±9.3 130.0 ±8.2
126.0 ±8.1 130.0 ±10.2
479.0 ±53.8 565.0 ±55.1
885.0 ±105.7 821.0 ±102.5
0%
0%
-1.56%
-3.17%
-17.9%
7.23%
Δ: Percentage of differences between genders ((Male – Female)/Male * 100)
6
Fig. 5. Timing of 6 new feature points.
In addition, similar methodology described as in [8] to measure the difference in the SCG- and ultrasound-identified feature points in the cardiac cycle was adopted. The differences were computed by subtracting the timing of the SCG feature point from the Echo point. The mean and standard deviation of the differences are analyzed and shown in Table III. Negative value means that the SCG feature point occurred later than the Echo-identified feature point. Differences were referenced to R point in ECG wave and were determined by subtracting R to SCG time from R to Echo. TABLE III DIFFERENCES BETWEEN SCG AND ECHO-IDENTIFIED FEATURE POINTS IN CARDIO CYCLE (ms) Feature point mean SD LCV -1.4 2.6 SCV -1.7 4.6 AF -1.1 3.6 PF -1.1 3.2 MFA 9.3 22 MFE 2.8 22
D. Pattern variation of feature points In this study, we observed timing or pattern variation of feature points among different SCG recording sites. The variation makes the identification of a feature point more difficult with a single SCG recording site, and this is probably the reason these new feature points had not been identified in previous studies yet. We tried to look for the same pattern by matching the most similar peak or trough in conventional SCG traces, which were usually the tricuspid valve site since the previous studies acquired SCG signals using a single accelerometer attached to middle sternum only. Fig. 6 shows the association of these feature points to the conventional SCG recording site (the tricuspid valve site). Significant location-specific pattern differences could be seen in the multi-channel SCG traces: MFA and MFE feature points presented with prominent upstrokes in the mitral valve SCG trace but were obscure in the tricuspid valve SCG trace; AF and PF feature points presented with both upstrokes in the aortic and pulmonary SCG traces respectively, but the tricuspid valve SCG trace showed a negative notch at that moment.
2168-2194 (c) 2016 IEEE. Translations and content mining are permitted for academic research only. Personal use is also permitted, but republication/redistribution requires IEEE permission. See http://www.ieee.org/publications_standards/publications/rights/index.html for more information.
This article has been accepted for publication in a future issue of this journal, but has not been fully edited. Content may change prior to final publication. Citation information: DOI 10.1109/JBHI.2016.2620496, IEEE Journal of Biomedical and Health Informatics
JBHI-00235-2016
Fig. 6. Matching the new feature points to tricuspid valve SCG.
The reported 6 new feature points were identified through the visualized comparison with echocardiography images and SCG spectrums by synchronously matching with ECG signals. Also, these feature points are first time reported and identified with the proposed new multi-channel SCG systems, hence there is no benchmark to compare with. In this work, the main purpose is to report the 6 new feature points found with the proposed multi-channel SCG system. The comparison of the accuracy of the 9 feature points identified in single channel SCG measurements and multi-channel SCG system will be discussed in the following articles. IV. Discussion The major finding in this study is the new feature points identified using the multi-channel SCG method and the location-specific SCG patterns. Six new feature points (LVC, SCV, AF, PF, MFE and MFA) were identified by analyzing the acquired SCG signals and the corresponding echocardiographic Doppler (including tissue Doppler) images. These feature points were not obviously visible in the conventional single-channel sternal SCG. The multi-channel SCG analyses also showed pattern differences of the feature points between the corresponding sites and the conventional sternal site. A. The advantages of multi-channel SCG SCGs are the acceleration signals generated in cardiac cycles, consisting of valve opening or closing, blood flow and myocardial motion. Some (but not all) of the vibration is presented as heart sounds and can be detected by a stethoscope [18]. Multi-channel SCG system records the underneath cardiac activities with better accuracy, because shorter the distance from the cardiac valve auscultation site, less the signal attenuation. Using the new multi-channel SCG technique, the specific cardiac motion generated by the corresponding heart chambers, valves or blood flow can be detected more accurately. The location-specific pattern differences of the feature points help identify the signal source, and the multi-channel SCG may be applicable in clinical diagnosis of cardiac diseases, such as valvular heart diseases, heart failure and ventricular dyssynchrony.
7
Previous studies used a single accelerometer on sternum, in conjunction with ECG, phonocardiogram, or echocardiogram, for signal acquisition [19],[20]. In this study, signals were acquired at four cardiac valve corresponding sites, and the multi-channel SCG recording may be considered as a SCG spectrum. The idea of SCG spectrum is actually similar to ocean monitoring using buoy stations, and a single buoy station can only detect the nearby signals (such as levels of water). As comparing with previous studies in which signals of a single spot were acquired, multi-channel SCG can record more details of each part of a heart, such differential feature point signals of each particular sites and their time delay. Moreover, the system can detect more location-specific motion of each valve or chamber instead of picking up the composite vibration signals of a whole heart in the conventional sternal SCG. A single-channel SCG system acquires only vibration over time, and therefore, the signals compose of 2-dimensional information. On the other hand, a SCG spectrum contains the vibration amplitude over time of the 2-dimensional chest surface, representing 4-dimentional information of cardiac activities. For example, the upstroke pattern of AF feature point is compatible with the physiology of rapid blood flow through the aortic valve to the aorta. Using the multi-channel SCG system, an upright signal can be detected in the aortic valve feature point; however, at the moment, there was no significant transition in the tricuspid valve SCG waveform. The results indicate that SCG traces represent location-specific cardiac activities. B. Clinical implication Cardiovascular diseases are the top leading cause of death in United States and Canada in the past decades, accounting for about 30% of annual mortality [21]. Successful treatment of cardiovascular diseases depends on accurate diagnoses and early treatment. The most commonly available clinical cardiac diagnostic tool is ECG, which provides important information for diagnosis of myocardial ischemia, infarction and arrhythmias. Basically ECG reveals cardiac electrical activities rather than the information of cardiac contractile function or valvular motion. For now, the diagnoses of cardiac contractility dysfunction and valvular diseases usually require other diagnostic tools, such as echocardiography. However, echocardiography is usually costly and labor consuming, requires both sub-special personnel and expensive equipment, and is not immediately available in most medical institutes. The development of a cheaper and easily available diagnostic tool to detect cardiac mechanical activities may help make prompt diagnoses, especially for in-patient and emergency departments. The concept of SCG spectrum is proposed and the acquired signals are location-specific. For example, in this study, the trans-aortic valve flow signal was very different in the signals from mitral and aortic sites, indicating that the recording sites are important. The new technique might make the clinical diagnosis of specific diseases possible in the future. C. Limitations We placed only 4 SCG sensors at the cardiac valve
2168-2194 (c) 2016 IEEE. Translations and content mining are permitted for academic research only. Personal use is also permitted, but republication/redistribution requires IEEE permission. See http://www.ieee.org/publications_standards/publications/rights/index.html for more information.
This article has been accepted for publication in a future issue of this journal, but has not been fully edited. Content may change prior to final publication. Citation information: DOI 10.1109/JBHI.2016.2620496, IEEE Journal of Biomedical and Health Informatics
JBHI-00235-2016 auscultation sites, and signals originated from other parts of a heart might be missing, such as left ventricular anterior and posterior walls. More detail signal acquisition may be required using a SCG sensor array. V. CONCLUSIONS In this study, six new feature points, i.e. LCV, SCV, AF, PF, MFE, and MFA, of cardiac activity events were identified with the proposed multi-channel SCG spectrum measurement system. The multi-channel SCG measurement system, forming a SCG spectrum, provides the measurement of location-specific vibration signals originated from cardiac activities. The system may avoid time delay and signal attenuation, and hence, it can detect more accurate and more detailed feature points. The proposed multi-channel SCG measurement system is a promising technology for cardiac mechanical signal recording, and, in conjunction with ECG, which records electrical cardiac signals, may become an important diagnostic tool to evaluate cardiac contractility and valvular function. At present this research is in IRB phase. Once enough data are collected from normal and patient subjects in IRB experiments, the system will be ready and available for clinical use.
[13]
[14]
[15]
[16]
[17]
[18] [19]
[20]
REFERENCES [1]
E.S. Ford, U.A. Ajani, J.B. Croft, J.A. Critchley, D.R. Labarthe, et al., “Explaining the decrease in U.S. deaths from coronary disease,” N Engl J Med., vol. 356, pp. 2388-98, 2007. [2] W. Rosamond, K. Flegal, G. Friday, K. Furie, A. Go, et al., “Heart disease and stroke statistics--2007 update: a report from the American Heart Association Statistics Committee and Stroke Statistics Subcommittee,” Circulation, vol. 115, pp.169-71, 2007. [3] I Starr and F.C. Wood, “Twenty-year studies with the Ballistocardiograph: the relation between the amplitude of the first record of "Healthy" adults and eventual mortality and morbidity from heart disease,” Circulation, vol. 23, pp. 714-32, 1961. [4] I Starr and F.C. Wood, “Studies with the ballistocardiograph in acute cardiac infarction and chronic angina pectoris,” American Heart Journal, vol. 25, pp. 81-101, 1943. [5] D.M. Salerno, J.M. Zanetti, L.A. Green, M.R. Mooney, J.D. Madison, et al, “Seismocardiographic changes associated with obstruction of coronary blood flow during balloon angioplasty,” The American J Cardiology, vol. 68, pp. 201-207, 1991. [6] D.M. Salerno and J. Zanetti, “Seismocardiography for monitoring changes in left ventricular function during ischemia,” CHEST J, vol. 100, pp. 991-3, 1991. [7] F.I. Marcus, V. Sorrell, J. Zanetti, M. Bosnos, G. Baweja, et al., “Accelerometer‐derived time intervals during various pacing modes in patients with biventricular pacemakers: comparison with normal,” Pacing and Clinical Electrophysiology, vol. 30, pp. 1476-81, 2007. [8] R.S. Crow, P. Hannan, D. Jacobs, L. Hedquist, and D.M. Salerno, “Relationship between seismocardiogram and echocardiogram for events in the cardiac cycle,” American J Noninvasive Cardiology, vol. 8, pp. 39-46, 1994. [9] C.I. Stefanadis, “Bioelectronics: The way to discover the world of arrhythmias,” Hellenic J Cardiology, vol. 55, pp. 267-8, 2014. [10] O.T. Inan, P-F Migeotte, K-S Park, M. Etemadi, K. Tavakolian, et al., “Ballistocardiography and Seismocardiography: a review of recent advances,” IEEE J. Biomed. Health Informat., vol. 19, no. 4, pp. 1414-27, 2015. [11] J.M. Zanetti and K. Tavakolian, “Seismocardiography: past, present and future,” in Proc. 35th Annu. Int. Conf. Eng. Med. Biol. Soc., 2013, pp. 7004-7. [12] L. Sarlabous, A. Torres, J.A. Fiz, and R. Jane, “Evidence towards improved estimation of respiratory muscle effort from diaphragm mechanomyographic signals with cardiac vibration interference using
[21]
8
sample entropy with fixed tolerance values,” PLOS ONE, vol. 9, issue 2, pp. e88902 1-9, 2014. M. Faezipour, A. Saeed, S. C. Bulusu, M. Noyrani, H. Minn, and L. Tamil, “A patient-adaptive profiling scheme for ECG beat classification,” IEEE Trans. on Inf. Techno. in Biomedicine, vol. 14, no. 5, pp. 1153-1165, 2010. T. Aiba, W. Shimizu, M. Inagaki, T. Noda, S. Miyoshi, W.G. Ding, D.P. Zankov, F. Toyoda, H. Matsuura, M. Horie, and K. Sunagawa, “Cellular and ionic mechanism for drug-induced long qt syndrome and effectiveness of verapamil,” Journal of the American College of Cardiology, vol. 45, pp. 300-307, 2005. V.S. Chauhan, A.D. Krahn, B.D. Walker, G.J. Klein, A.C. Skanes, and R. Yee, “Sex differences in qtc interval and qt dispersion: Dynamics during exercise and recovery in healthy subjects,” American heart journal, vol. 144, pp. 858-864, 2002. N. Abi-Gerges, B.G. Small, C.L. Lawrence, T.G. Hammond, J.P, Valentin, and C.E. Pollard, “Gender differences in the slow delayed (iks) but not in inward (ik1) rectifier k+ currents of canine purkinje fibre cardiac action potential: Key roles for iks, beta-adrenoceptor stimulation, pacing rate and gender,” British journal of pharmacology, vol. 147, pp. 653-660, 2006. Y. Zhu, X. Ai, R.A. Oster, D.M. Bers, and S.M. Pogwizd, “Sex differences in repolarization and slow delayed rectifier potassium current and their regulation by sympathetic stimulation in rabbits,” Pflugers Archiv : European journal of physiology, vol. 465, pp. 805-818 2013. A.J. Delman, “Hemodynamic correlates of cardiovascular sounds,” Annu Rev. Med., vol. 18, pp. 139-58, 1967. C.A. Wick, J.J. Su, O. Brand, J.H. McClellan, P.T. Bhatti, et al, “A trimodal system for the acquisition of synchronous echocardiography, electrocardiography, and seismocardiography data,” in Proc. 33th Annu. Int. Conf. Eng. Med. Biol. Soc., 2011, pp. 6911-14. C.A. Wick, J.J. Su, J.H. McClellan, O. Brand, P.T. Bhatti, et al, “A system for seismocardiography-based identification of quiescent heart phases: implications for cardiac imaging,” IEEE Trans. Inf. Technol. Biomed., vol. 16, no. 5, pp. 869-77, 2012. D. Mozaffarian, E.J. Benjamin, A.S. Go, D.K. Arnett, M.J. Blaha, et al., “Heart disease and stroke statistics—2015 update: a report from the American Heart Association,” Circulation, vol. 131, no. 4, pp. e29-322, 2015.
Wen-Yen Lin (S’92-M’09) received the B.S. degree in Electrical Engineering from National Taiwan University, Taiwan, Republic of China, in 1988, the M.S. degree in Electrical Engineering and Ph.D. degree in Computer Engineering from University of Southern California, California, USA, in 1992 and 2000, respectively. From 1993 to 2004, he worked at Motia, Inc. in USA for embedded system designs, FPGA/ASIC designs, RF application board developments. In 2004, he relocated back to Taiwan to setup the Taiwan Branch office for Motia, Inc. and continued to promote company technologies and products to Taiwan OEMs. In 2006, He joined Compal Electronics Inc. in Taiwan to lead RF Communication Dept. on integrating RF/Wireless devices in notebooks, netbooks, hand-held devices and consumer electronic applications. Dr. Lin joined the faculty of the Department of Electrical Engineering, Chang Gung University, Taoyuan, Taiwan, since Feb. 2009, where he is currently an Assistant Professor. His research interests are in inertial sensing technologies for health care applications, embedded system design for tele-cares, and parallel and distributed processing including multi-core SoC Designs.
2168-2194 (c) 2016 IEEE. Translations and content mining are permitted for academic research only. Personal use is also permitted, but republication/redistribution requires IEEE permission. See http://www.ieee.org/publications_standards/publications/rights/index.html for more information.
This article has been accepted for publication in a future issue of this journal, but has not been fully edited. Content may change prior to final publication. Citation information: DOI 10.1109/JBHI.2016.2620496, IEEE Journal of Biomedical and Health Informatics
JBHI-00235-2016 Wen-Cheng Chou received his B.S degree and M.S degree in Electronic Engineering from Lunghwa University of Science and Technology, Taiwan, Republic of China, in 2007 and 2010. Mr. Chou started his Ph.D. program in Electrical Engineering in Chang Gung University in 2010. His research is mainly on Medical Embedded system and the applications of inertial sensing techniques combining with human-machine interface. Po-Cheng Chang, M.D. was born in Taichung City, Taiwan on Oct/30/1976. He earned his medical degree in Chang Gung University Medical School, Taoyuan, Taiwan, in 2001/Jun; then he finished resident training in Department of Internal Medicine and fellow training in the Second Division of Cardiology, Chang Gung Memorial Hospital, Linkou Medical Center, in 2006/Jul. The clinical physician training was under the mentoring of Profs. Delon Wu, San-Jou Yeh, Fen-Chiung Lin, Ming-Shien Wen, Chun-Chieh Wang, I-Chang Hsieh, Chung-Chuan Chou. The major clinical research topics include implantable cardiac devices, heart failure, cardiac arrhythmias and coronary artery disease. Three first-author and 5 co-author papers had been published. He received his Research Fellowship in Krannert Institute of Cardiology, Indiana University, USA under Prof. Peng-Sheng Chen, Prof. Shien-Fong Lin and Prof. Tomohiko Ai’s mentoring (2010/Mar- 2013/Dec). The research fields included the mechanisms of electric storm in a heart failure (HF) model, the mechanisms and therapeutic approaches in arrhythmia transgenic mouse models and the mechanisms of early afterdepolarization (EAD) in a HF rabbit model. Dr. Chang is currently a clinical cardiologist and an assistant professor in Chang Gung Memorial Hospital, Linkou Medical Center. Chung-Chuan Chou, M.D. received his MD degree in Kaohsiung Medical University, Taiwan in 1993. Then he finished his residency training in 1998, Cardiology fellowship training in 2000, and became an attending physician in Division of Cardiology, Department of Internal Medicine, Chang Gung Memorial Hospital, Linkou, Taiwan. He has been a research electrophysiology fellow under Professor Peng-Sheng Chen’s (Chief editor of “Heart Rhythm” Journal) tutoring in Cedar-Sinai Medical Center, LA in 2002-2003. His research interests include both basic and clinical electrophysiology, especially intracellular calcium dynamics of atrial and ventricular fibrillation. He has been conducting basic electrophysiological laboratory in Chang Gung Memorial Hospital and has published papers in journals such as Journal of American College Cardiology, Heart Rhythm, and International Journal of Cardiology etc. since 2004.
9
Dr. Chou is currently the associated professor in Chang Gung Memorial Hospital, Linkou and Director of Non-invasive Cardiovascular Laboratory, Chang Gung Memorial Hospital, Taoyuan. He is a member of Heart Rhythm Society and American Physiological Society. He has been a Fellow of Heart Rhythm Society since 2014. He has won the 2nd prize of 2007 Young Investigator Award of Taiwan Society of Cardiology and the Best Poster Award of the 42nd Taiwan Society of Cardiology Annual Meeting (2012). Ming-Shien Wen, M.D. earned his M.D. degree from Kaohsiung Medical College at Kaoshiun, Taiwan in 1986. He completed his internal medicine residence and cardiology fellowship trainings in Linkou Chang Gung Memorial Hospital. He is a visiting attending doctor since 1991. He is currently clinical professor of internal medicine in Chang Gung Memorial Hospital, associated professor in medical college of Chang Gung University, and the Director of the Division of Cardiology in Linkou Chang Gung Memorial Hospital. He particularly interested in arrhythmia, catheter ablation, remote monitoring and precise medicine. He had publications in Circulation, JACC, and NEJM. Dr. Wen is the fellow of American College of Cardiology, Director of Taiwan Heart Rhythm Society and Taiwan Society of Critical Care Medicine. He ever awarded Young Investigator Award of Taiwan Society of Cardiology in 1998. Ming-Yun Ho, M.D. received medical degree from Chang Gung Memorial Hospital (CGMH), Linkou, Taiwan in 2009. He is currently cardiologist in CGMH. He is interested in coronary artery disease, heart failure, peripheral arterial disease, interventional cardiology and cardiac echography. He received internal medicine resident training in CGMH during 2010~2013 and military service in Kinmen military hospital for 1 year. He took cardiology fellowship training in CGMH during 2013~2015. He published papers including pericardiocentensis from National Health Insurance Research Database, lung cancer research, and cardiac image. Dr. Ho attended American Thoracic Society conference for discussion presentation in 2013 and Taiwan transcatheter therapeutics conference for case presentation in 2016. Dr. Ming-Yun Ho is a member in Taiwan Society of Internal Medicine and Taiwan Society of Cardiology. Ming-Jer Hsieh, M.D. received his Medical Degree (MD.) from medical school of Chang Gung University in Taiwan in 2000. He is currently the clinical assistant professor, attending physician of cardiology in Chang Gung Memorial Hospital (CGMH), Linkao medical center in Taiwan.
2168-2194 (c) 2016 IEEE. Translations and content mining are permitted for academic research only. Personal use is also permitted, but republication/redistribution requires IEEE permission. See http://www.ieee.org/publications_standards/publications/rights/index.html for more information.
This article has been accepted for publication in a future issue of this journal, but has not been fully edited. Content may change prior to final publication. Citation information: DOI 10.1109/JBHI.2016.2620496, IEEE Journal of Biomedical and Health Informatics
JBHI-00235-2016 He was appointed as the research fellow of cardiology in CGMH in Taiwan (from 2003~2005). He was the director of the Cardiac Care Unit (CCU) of CGMH (2009). Currently, he is the director of cardiology ward in CGMH. Dr. Hsieh has been elected as a member in “Public Medical Policy Committee” (2014-2016) and in ”Editorial & Register Board Committee” (2016-2018) of Taiwan Society of Cardiovascular Interventions (TSCI). His research interests have been in coronary artery disease, acute myocardial infarction, percutaneous coronary interventions, renal-cardiac disease, echocardiography, cardiovascular pharmacology, angiogenesis and biomaterial clinical application, etc. Dr. Hsieh currently has a number of ongoing projects of which many are related to medical device design, medication or interventional devices clinical trials. Dr. Hsieh has been the faculty of many cardiovascular interventional related conferences and workshops. Chung-Chih Lin (S’95–M’00) received the Ph.D. degree in electrical engineering from the National Taiwan University (NTU) in 1999. Since 2008, he has been an Associate Professor in the Department of Computer Science and Information Engineering, Chang Gung University (CGU), Kwei-Shan, Taiwan. His current research interests include medical informatics, data mining, embedded system, and wireless sensor networks. Tsai-Hsuan Tsai is Associate Professor of Department of Industrial Design at Chang Gung University (http://id.cgu.edu.tw/). She received her Ph.D in Design Theory & Innovation /Multimedia Design from De Montfort University in the UK in 2006. Her research interests include the design of human-computer interaction (HCI) with mobile devices and services for people with special needs, and the development of theoretical usability model for assistive technology assessments and usability evaluation methods, particularly for the user interface and interaction technologies. Dr. Tsai’s current research focuses on the design and use of mobile social technologies for older people, the development of virtual and augmented reality and its applications to healthcare and medicine, the analysis of users' behavior in social networks, mobile usability and user experience testing.
10
Technical Committee (TC) on Medical Mechatronics in IEEE/SMC Society. He was a robotic engineering manager in CIMCORP Inc. (U.S.A.) for eight years before he joint Chang Gung University (1984 to 1992). Dr. Lee has been elected as the “Distinguished Engineering Professor Award” (1998) by Chinese Mechanical Engineering Association. His research interests have been in medical mechatronics, hospital automation, rehabilitation engineering, computer-aided medical modality development, technical aids design, medical rapid prototyping, Bio-MEMS, etc (http://mmrl.cgu.edu.tw/). He has more than 60 patents on the medical related technologies, medical instrumentations and rehabilitation systems. Some novel designs have been adopted at Chang Gung Memorial Hospital (Taoyuan, Taiwan). He has received many honors and academic awards. Just name a few, he has won the “Golden Brain Award” in National Invention Competition (Taiwan) for three consecutive years (1997~1999). He also represents Taiwan to win 3 gold medals in Nuremberg International Invention exhibition from 1998 to 2000. He also received “Best paper awards” from different professional societies and conferences. He has received Outstanding Research Award from CGU and Outstanding Academic-industry Collaboration Award from Ministry of Education (MOE). He is authored / co-authored of more than 500 technical journal and conference papers. Professor Lee was appointed as the Associate Editor of ASME Journal of Medical Device and member of the International Editorial Board for JMBE. Currently, he is acting as Associate Editor of IEEE Transactions on System, Man, and Cybernetics: Systems. Dr. Lee has a number of ongoing projects of which many are related to biomedical engineering and medical device design. Dr. Lee has had research collaborations with faculty in Orthopedics Rehabilitation, Neuroscience, Surgery, Dentistry, Craniofacial and Sport Biomechanics. He has consulted at over 10 companies or institutions in medical device design, including ITRI, MIRDC, Ever Prosperous, Jaeger Industrial, Glorious Union Medtech. Lee is a Fellow of IET (Formal IEE). He has been the Chair of many biomedical related conferences and workshops. He is currently elected as Vice-president of Chinese Safe Patient Handling & Movement Association.
Ming-Yih Lee (M’96) received his Ph.D. in Mechanical Engineering from University of Minnesota. He is currently the professor and Chairman of Graduate Institute of Medical Mechatronics in Chang Gung University (Taiwan, http://mm.cgu.edu.tw/). He was appointed as the Director of National Medical Mechatronics Educational Resource Center (MMERC) sponsored by the Ministry of Education (MOE) in Taiwan (from 2001~2006, http://mmerc.cgu.edu.tw/). He was the Chair of the IEEE Robotics and Automation Society (RAS) Taipei Chapter (2007). Currently, he is the Chair of the
2168-2194 (c) 2016 IEEE. Translations and content mining are permitted for academic research only. Personal use is also permitted, but republication/redistribution requires IEEE permission. See http://www.ieee.org/publications_standards/publications/rights/index.html for more information.