Myb. TaRRB. XHQXKGSSXS. Introduction. Methods and Materials. Results. Downloaded assembled wheat. ESTs sequences (DFCI, NCBI,. PlantGDB and TIGR ...
Identification of two-component system (TCS) candidate genes and their expression analysis under dehydration stress in wheat Vijay Gahlaut1, Saloni Mathur2, Raman Dhariwal1, Jitendra P. Khurana2, 3 Akhilesh K. Tyagi 3,4 Harindra S Balyan1 and Pushpendra K Gupta1 1Department
of Genetics & Plant Breeding, Ch. Charan Singh University, Meerut, 2Interdisciplinary Centre for Plant Genomics, University of Delhi South Campus, New Delhi, 3Department of Plant Molecular Biology, University of Delhi South Campus, New Delhi,4National Institute of Plant Genome Research, New Delhi.
Introduction The two-component system (TCS) is common signal transduction mechanisms that are implicated in regulation of diverse biological processes in plants, including responses to water stress. TCS include the following three signalling elements: histidine kinases (HK), his-containing phosphotransfer proteins (HPTs), and response regulators (RRs). In wheat, using different bioinformatics tools, we identified and characterized 59 TCS signalling candidate genes. Comparison of protein sequences, conserved motifs and phylogenetic analyses showed their conserved nature across wheat, Arabidopsis and rice. Considering the importance of water stress in determining wheat productivity, we studied the quantitative expression of a set of selected TCS members (4 HKs, 5 HPTs and 9 RRs) in seedlings of two wheat cvs. ‘HD2967’ (drought sensitive) and ‘Dharwar Dry’ (drought tolerant) under dehydration stress. We identified all selected TCS genes differentially regulated in dehydration stress. We propose that the TCS genes responding to dehydration stress may be further (i) tested for their tissue and stage specific expression, and (ii) also for their ability to provide drought tolerance in wheat through molecular breeding or transgenic approach.
Methods and Materials
Results
Downloaded assembled wheat ESTs sequences (DFCI, NCBI, PlantGDB and TIGR databases)
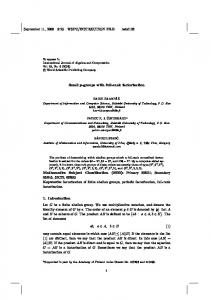
Identification of TCS in wheat Identification of the TCS members in wheat A total of 4,98,390 wheat UniGenes/Transcript Assemblies (TAs) were searched Translation using software Identification of genes encoding TCS members in ESTScan software using the HMMER software leading to identification of 59 putative TCS proteins [4 wheat was carried out using a step-by-step pipeline HKs, 10 HPTs and 45 RRs (41 type-A RRs, 2 type B RRs, and 2 PRRs, pseudo(Figure 1). To annotate the transmembrane (TM) Hidden Markov Model HMMER 3.0 (HMM) profiles of TCS response regulators)] in wheat. A comparison of protein sequences conserved motifs helices for wheat putative HK proteins, TMHMM ver. software domains (Figure 2) and phylogenetic analyses (Figure 3) of TCS from wheat, Arabidopsis and 2.0c was used. The newly identified UniGenes/TAs was rice showed that the TCS genes were conserved nature across the species, barring named according to standardized nomenclature for the Putative Wheat TCS exceptional cases. plant TCS members (Heyl et al., 2013). Expression analysis of 18 selected TCS genes Phylogenetic analysis Remove redundant The qRT-PCR analyses of 18 TCS (4 TaHKs, 5 TaHPTs and 9 TaRRs) genes in protein sequences using The sequence alignment of related proteins belonging CD-HIT suite seedling tissues of two wheat genotypes (drought susceptible; HD2967 and drought to TCS elements from wheat, Arabidopsis and rice HK = 4 tolerant; Dharwar dry) suggested that all the 18 TCS genes were dehydration Revalidate using Pfam proteins were performed using MUSCLE. The aligned HPT = 10 database RR = 45 responsive. Among 18 wheat TCS genes; (i) 10 genes were induced in both sequences were used to construct the unrooted genotypes, (ii) 6 genes were repressed in both genotypes, and (iii) 2 genes were phylogenetic trees by the neighbor–joining (NJ) method Analysis of expression patterns of selected TCS genes under dehydration stress (DS) using qRTinduced in HD2967 and repressed in Dharwar dry (Figure 4). using MEGA 5 (Tamura et al 2011). PCR Plant materials and dehydration treatment Identification of TCS genes Two wheat genotypes (drought susceptible, HD2967 responsive to DS and drought tolerant, Dharwar dry) were used for expression profiling of TCS genes. For inducing Figure 1. Step-wise pipeline for the identification, classification dehydration stress, 7 days old (Z11) normal seedlings and prediction of dehydration responsive TCS genes in wheat. were raised in polyethyleneglycol (PEG) 6000 halfstrength Hoagland's Solution to achieve an osmotic potential of −0.49 MPa (PEG 20%). Expression analysis The total RNA from seedlings was isolated using the RNeasy Plant Mini Kit (Qiagen, Valencia, CA, USA). First-strand cDNA was prepared using a QuantiTect Reverse Transcription Kit (Qiagen). The primers were designed using the Primer Express program 3.0 (Applied Biosystems). The quantitative RT–PCR (qRTPCR) was performed using a StepOnePlus™ Real-time PCR detection system (Applied Biosystems, CA, USA) with a QuantiTect SYBR Green RT-PCR Kit (Qiagen). The relative values of the transcripts were normalized to the wheat Actin level. Fold changes were calculated Figure 2. Domain architectures of wheat TCS elements: The pictorial −ΔΔCt by the 2 method (Livak and Schmittgen 2001). Figure 4. Expression of wheat TCS genes in HD2967 (gray bars) and (a) 1.5
5.5 5 4.5 4 3.5 3 2.5 2 1.5 1 0.5 0
TaHK1
1
0.5
0
0hr
(b)
0
100
200
300
TaHK1
500
HisKA
TaCHK1
TaERS1
400
T M
CHASE
T M
T M
T M
HATPase_c
HATPase_c
HisKA
GAF
600
700
800
900
1000
2 1.8 1.6 1.4 1.2 1 0.8 0.6 0.4 0.2 0
RR
RR
HisKA
GAF
HATPase_c
Hpt
TaRRB
RR
TaPRR
RR
CCT
I
III(A)
II
1.5
1.5 1
0.5
0.5
0
0hr
0
0hr 1hr TaHPT3
4
3hr
6hr
0hr
2
1hr
3hr
6hr
TaHPT4
1.5
1
1.5 1
0.5
0.5
1hr
3hr
6hr
0
0
2
TaRRA1
1hr
3hr
3hr
6hr
4.5
TaHPT6
4
4
3.5
3.5
3
3
2.5
2.5
2
2
1.5
1.5
1
1
0.5
0.5
0
6hr
0hr
1.5
TaRRA12
4.5
1hr
1hr
3hr
6hr
0
0hr
1.5
TaRRA19
TaHPT8
1hr
3hr
6hr
0hr
1.5
TaRRA29
1hr
3hr
6hr
3hr
6hr
TaRRA41
1.5
1
1
0.5
0.5
3hr
6hr
0
3hr
1
0.5
0.5
0.5
1hr
3hr
6hr
2.5 2
1.5 1
0.5
0
0
0hr
1hr
3hr
6hr
0hr
1hr
0
0hr 1hr 27.5 TaPRR2
3hr
6hr
25 22.5 20 17.5 15 12.5 10 7.5 5 2.5 0
3
0.5
6hr
0
0hr
3.5 TaPRR1
1
3hr
1
6hr
1.5
1hr
1
0
0hr 1hr 2.5 TaRRB2 2
0hr
depiction is based on the predictions carried out using Pfam database. The locations of the conserved domains and transmembranes within the protein sequences are represented by the labelled symbols.
2
1
2
4.5 4 3.5 3 2.5 2 1.5 1 0.5 0
Myb
2.5
2
2.5
0hr 1hr 5 TaRRB1
RR
3
2.5
3
0
TaRRA
3.5
3.5
1.5
XHQXKGSSXS
TaHPT
6hr
4 TaERS2
TaERS1
3
0hr
2
TaERS2
3hr
TaHPT2
0hr
(c)
HATPase_c
HisKA
1hr
3.5
TaCHK1
3hr
6hr
0hr
1hr
HD 2967
Dharwar dry
0hr
1hr
3hr
6hr
Dharwar dry (white bars) under dehydration stress (a) Expression of TaHK genes (b) TaHPT genes (c) TaRR genes. Data represent the mean and standard errors of the biological replicates.
III (B)
III (C)
Figure 5 - Diagrammatic representation show chromosomal distribution of 59 wheat TCS elements on its seven homologous chromosome groups.
References
Figure 3. Phylogenetic relationship of HKs (I), HPTs (II) and RRs (III) [type-A RRs (A), type-B RRs (B) and pseudo RRs (C)] proteins from Arabidopsis, rice and wheat. The unrooted phylogenetic tree was constructed with MEGA 5.0 using the Neighbor-Joining (NJ) method with 1,000 bootstrap replicates based on a multiple alignment of amino acid sequences of RRs Proteins from Arabidopsis, rice and wheat. Bootstrap values higher than 50% are shown on the nodes
Acknowledgments
Livak, K.J., and Schmittgen, T.D. (2001). Analysis of relative gene expression data using real-time quantitative PCR and the 2(-Delta Delta C (T)) method. Methods. 25, 402-408. Tamura, K., Peterson, D., Peterson, N., Stecher, G., Nei, M., and Kumar, S. (2011). MEGA5: molecular evolutionary genetics analysis using maximum likelihood, evolutionary distance, and maximum parsimony methods, Mol. Biol. Evol. 28, 2731–2739.
Thanks are due to The Head, Department of Genetics and Plant Breeding, CCS University Meerut, India for providing facilities. PKG was awarded a National Academy of Sciences India (NASI) Senior Scientist Platinum Jubilee Fellowship, during the tenure of which this work was initiated; VG was awarded a Senior Research Fellowship under the same program. Also, thanks are due to the Department of Biotechnology (DBT), Government of India (for providing travel support) and AK Joshi, CIMMYT, South Asia Office, Nepal (for registration fee support) for attending the Interdrought-IV, conference.