Identifying and Characterizing User Communities on Twitter during Crisis Events Aditi Gupta∗ , Anupam Joshi† , Ponnurangam Kumaraguru∗ ∗
Indraprastha Institute of Information Technology, Delhi, India † University of Maryland Baltimore County, Maryland, USA
{aditig, pk}@iiitd.ac.in,
[email protected] ABSTRACT
1. INTRODUCTION
Twitter is a prominent online social media which is used to share information and opinions. Previous research has shown that current real world news topics and events dominate the discussions on Twitter. In this paper, we present a preliminary study to identify and characterize communities from a set of users who post messages on Twitter during crisis events. We present our work in progress by analyzing three major crisis events of 2011 as case studies (Hurricane Irene, Riots in England, and Earthquake in Virginia). Hurricane Irene alone, caused a damage of about 7-10 billion USD and claimed 56 lives. The aim of this paper is to identify the different user communities, and characterize them by the top central users. First, we defined a similarity metric between users based on their links, content posted and meta-data. Second, we applied spectral clustering to obtain communities of users formed during three different crisis events. Third, we evaluated the mechanism to identify top central users using degree centrality; we showed that the top users represent the topics and opinions of all the users in the community with 81% accuracy on an average. The top central people identified represent what the entire community shares. Therefore to understand a community, we need to monitor and analyze only these top users rather than all the users in a community.
Online social media provides people with a platform to disseminate ideas, learn information, explore knowledge, and express their opinions on diverse topics. There is a sudden rise in activity over the Internet and online social media, especially during crisis and emergency situations [5]. People log on to social media websites to check for updates about the event and also to share information about the event with others. In such situations, social media content provide a vast resource of unmonitored and unstructured but rich information about events. Since the data is generated in real time and by users, many of whom are some times directly or indirectly in the actual event; mining this content can yield quite useful knowledge about the crisis situation [4, 8]. Our work aims to identify, extract and characterize prominent components of topics and opinions that people share during crisis events on Twitter. Twitter, is a micro-blogging website on which users post messages (called tweets) of a maximum length of 140 characters.1 Researchers have analyzed relevance of online social media, and in particular Twitter as news disseminating agent. Kwak et al. showed that 85% topics discussed on Twitter are related to news [3]. Users who post messages about events, have varied opinions, sentiments, and information content. The biggest challenge in analyzing data from any social media is the volume of content being generated. Millions of users post messages on Twitter everyday, and these numbers further surge up during a real-world event (in particular, high impact events). The motivation for our work is that, high volume of content and users on such social networks, makes manual monitoring of each message or user impossible. We propose a framework to cluster together users who are similar and then extract views of prominent people in each of these communities formed by identifying the top central users in each of them.2 Community detection helps us in monitoring the broad subtopics and sub-communities of users that are formed during an event. Identifying top central users is useful as they can represent the entire community. Hence we need to monitor and analyze the opinions and sentiments of only these few user profiles rather than all the users in a community. To identify the communities of users, and top users in each of these community, we utilize techniques of clustering and social network analysis. As case studies for the generic framework proposed in this paper, we analyze three major crisis events of 2011, the hur-
Categories and Subject Descriptors H.3.3 [Information Systems]: Information storage and retrieval—Information Retrieval ; K.4.1 [Computing Milieux]: Computers and society—Public policy issues
General Terms Experimentation, Measurement
Keywords Community detection, Online social media, Crisis events
Permission to make digital or hard copies of all or part of this work for personal or classroom use is granted without fee provided that copies are not made or distributed for profit or commercial advantage and that copies bear this notice and the full citation on the first page. To copy otherwise, to republish, to post on servers or to redistribute to lists, requires prior specific permission and/or a fee. DUBMMSM’12, October 29, 2012, Maui, Hawaii, USA. Copyright 2012 ACM 978-1-4503-1707-8/12/10 ...$15.00.
1
www.twitter.com The words cluster, community and groups are used interchangeably in this paper. 2
ricane Irene, the riots in United Kingdom and the earthquake in Virginia. Hurricane Irene alone, caused a damage of about 7-10 billion+ USD and claimed 56 lives.3 All these three real-life events, saw a vast number of message posts on online social media during the events itself, including Twitter. For instance, we collected over 1.1 million tweets related to England riots alone. The methodology and framework evaluated in the paper is generic and may be applied to any event. The aim is to identify different user communities, and characterize them by the properties of top central users in them. Communities in a network are groups of nodes such that, there are maximum number of edges inside the clusters than between clusters [7]. The main contributions of this paper are: • We defined a novel similarity metric to compute similarities between users based on their links, content posted and meta data. • We applied spectral clustering to obtain communities of users formed during three different crisis events. • We showed most central people (by degree centrality) represent what users in the cluster are talking about with 81% accuracy on average. In section 2, we present the theory and methodology followed in the paper. Section 3 gives the data description considered for the analysis. Section 4 describes the evaluation results. The last section consists of discussion and future work.
2.
THEORY AND METHODOLOGY
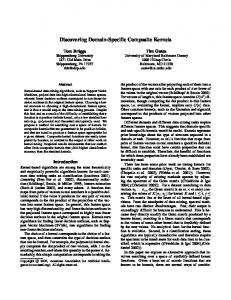
Most of the previous work has focussed on detecting and analyzing communities based on explicit social links like friends, followers or retweets [9, 10]. We follow the approach proposed by Java et al. for clustering blog data by using spectral methods [2]. Java et al. adapted the N-Cut spectral clustering algorithm for image segmentation to online social media [7]. Adapting the approach proposed by them for blogs to Twitter, we formulate the communities based on different metrics like content, link and meta-data of user on Twitter. Figure 1 represents the architecture of the methodology followed in this paper. After extracting the communities of users, we also propose the use of centrality metrics of social network analysis in order to obtain top central users in each community. The identification of top users in each community helps us in characterizing and analyzing, the topics and opinions of each community, and who comprises of that community. We perform clustering of users based upon the tweets posted, the link structure and the meta-data of the users on Twitter. A user*user similarity matrix U is constructed, where for all users ui and uj , the value ai,j is the sum of the following: • Content similarity C[i, j]: We calculate the similarity of content between two users by computing number of common words, hashtags and URLs in all the tweets by ui and uj related to the particular event.4 3 http://www.nytimes.com/2011/08/31/us/31floods.html? pagewanted=all 4 Before finding the common words among the tweets, we remove all the stop words from the tweet text.
• Link similarity L[i, j]: The similarity between two users, ui and uj with respect to links is computed based on how many times two users retweet, mention or reply to each other tweets or a common third person’s tweet. • Meta-data similarity M [i, j]: Twitter profile of a user contains an optional field called location. We compute similarity between two users based on the value in their location field. The field is a text box, the user may leave it blank, or fill it with a valid / invalid location. We used Yahoo PlaceFinder API5 to check whether the given text corresponds to a valid location. From the values returned by the API, we check if the users have similarity at the level of country, state or city. For each of the similarity metrics above, we normalize the score of each similarity using the maximum value of similarity score for each of the feature and then compute their sum (Equation 1). U [i, j] = C[i, j] + L[i, j] + M [i, j] (1) After collecting data from Twitter API, and constructing U [i, j], the next step is to perform spectral clustering on this matrix. We performed the spectral clustering using the specc function of R statistical analysis package, by specifying the number of clusters as three. The number of clusters was selected as three intuitively, for our preliminary study. In future, we would like to apply standard techniques for selection of number of clusters. The users are divided in different communities, which is followed by identifying top users in each of the community. We use the degree centrality metric of social network analysis to identify the top users for the communities. We then evaluate, that with how much accuracy, the top central users represent the opinions and sentiments of the entire community.
3. DATA DESCRIPTION Three events analyzed in this paper are England riots, hurricane Irene and earthquake in Virginia. All events occurred during the months of July and August, 2011. Riots in United Kingdom caused 5 deaths, in addition to 16 civilian and 186 police injuries. We selected tweets about the UK riots, based on the keywords related to them that emerged as trending topics on Twitter from 6th August to 11th August [1]. Similarly, we collected data for the other two events. Our second event under consideration is the earthquake of magnitude 5.8 that hit the Piedmont region of the U.S. state of Virginia. The third event is the hurricane Irene, which caused 55 deaths and a damage of US $10.1 billion. We used the Streaming API from Twitter to collect the tweets and user information corresponding to these three events. Table 1 presents the tweets and users of the three events analyzed in this paper. Table 1: Data statistics for the three crisis events. Event England Riots Hurricane Irene Earthquake in Virginia 5
Tweets 1,165,628 90,237 277,604
Users 546,966 55,718 219,621
http://developer.yahoo.com/geo/placefinder/
?%,>6*,'
45/*%/*'-#.#6)&#*7'
46>,*%&,'
!"%%*,'D'A,%&,' ()*)' !"#$%&'' ()*)+),%'
-#.#6)&#*7' :)*&#='
8#/9'-#.#6)&#*7'
!5@'C5&,*%&'
46>,*%&#/0'
!"#$%&'-*&%).#/0'123'
!5@'4%/*&)6' A,%&,'B'46>,*%&'
:%*);