courses are a source of frustration, since they typically have very weak visualization .... instruction, previous art courses, previous technical courses, previous ...
IDENTIFYING GENDER DIFFERENCES IN THE 3-D VISUALIZATION SKILLS OF ENGINEERING STUDENTS IN BRAZIL AND IN THE UNITED STATES Afonso Celso Medina and Helena B. P. Gerson Fundamental Engineering Escola de Engenharia Mauá São Caetano, SP BRAZIL Sheryl A. Sorby Civil and Environmental Engineering Michigan Technological University Houghton, MI USA 49931 Abstract Three-dimensional visualization skills are critically important for success in engineering careers. Before a complex problem can be solved, the engineer must be able to visualize how all of the components in the system work and fit together. Unfortunately, studies have shown that the 3-D spatial visualization skills of women engineering students lag significantly behind those of their male counterparts. A variety of strategies have been implemented to enhance the spatial visualization skills of engineering students. Along with these strategies, the Mauá Engineering School (EEM) and Michigan Technological University (MTU), have been utilizing specific exams as a means of measuring spatial ability. At both schools, the tests were administered as a pre-test in the beginning of a freshman graphics course. At each university, background questionnaires were filled out by the students during the pre-test period. The questions asked of the students were related to those types of activities which are thought to develop spatial skills including: age, handedness, play with certain types of toys, previous geometry instruction, vocational training, work experience and participation in sports which involved putting an object in a specific place (e.g., soccer, basketball, etc.). Student responses were analyzed to determine their significance in the development of spatial skills as measured by the respective testing instruments. At EEM, the tests also revealed that there is a certain group of students whose spatial visualization ability was not significantly improved after a full year of graphics instruction. For these students, the traditional graphics courses are a source of frustration, since they typically have very weak visualization skills from the outset. In order to help these students attain a minimum proficiency in their spatial skills so that they can then actively participate in a traditional graphics course, new techniques must be developed which take into account their
particular deficiencies. This paper examines gender differences in background and in visualization ability for students enrolled in the U.S. and in Brazil. The factors which seem to be significant in the development of visualization skills will be presented. Gender differences and other problems in visualization skills which cross international boundaries will also be described.
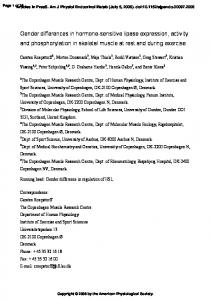
Introduction The primary objective of this research was to determine whether or not gender differences exist in the visualization skills of engineering students at the two universities participating in this study--Escola de Engenharia Mauá (EEM) and Michigan Technological University (MTU). To achieve this objective, tests which assess a person’s ability to visualize in three dimensions were administered to students at EEM and MTU. The results of these tests show that significant gender differences in visualization skills exist. The results of the tests were also used to help identify some of the factors that are thought to develop spatial skills. Assessment of Spatial Skills Several standardized tests have been developed to assess a person’s spatial skills. Since 1995, EEM has administered a spatial visualization test composed of four parts: A, B, C and D to freshman engineering students. Each part of the exam is meant to assess a specific component of spatial visualization skills. Part A is composed of 45 items subdivided into two types of questions. In the first type of question, a sheet of paper that is folded in half and then folded in half again is shown. A “cut” is made in some location on the paper. The students must choose which of five alternatives accurately portrays the paper after it is unfolded. In the second type of question, a two-dimensional figure with fold lines is shown. The students must choose
which of the four alternatives represents the solid formed by folding the figure along the fold lines. Sample problems
from part A are shown in Figure 1.
Figure 1. Sample Problems from Part A
Part B of the exam consists of problems from the Mental Cutting Test (MCT) [1]. The MCT was first developed for a university entrance exam in the USA and has been used for testing visualization ability in research in Japan, the U.S., Australia and other countries. The test
consists of 25 items. For each problem on the exam, students are shown a three-dimensional object that is to be cut with an indicated plane. They must then choose the correct resulting cross-section from among five alternatives. A sample problem from the MCT is shown in Figure 2.
Figure 2. Sample Problem from Part B (MCT)
Part C of the exam is composed of 13 items which involve the rotation of objects. In the first 8 questions, students are shown a principal object and five secondary objects. They must choose which of the five objects mates perfectly with the principal object. In order to answer these questions successfully, a person must be able to rotate the
objects mentally to determine how they fit together. In the remaining five questions, students are shown five cubes of which only four cubes are identical. They must then choose which of the cubes is different from the others. Sample problems from part C are shown in Figure 3.
Figure 3. Sample Problems from Part C Part D is composed of 25 items related to mirroring surfaces. The students are shown a cube with a line in one of its faces. The students must draw the another line which
is symmetric to the given line. A sample problem from part D is shown in Figure 4.
Figure 4. Sample Problem from Part D Three primary tests have been used at MTU in assessing spatial visualization skills of engineering students. These include the MCT (also administered at EEM), the Mental Rotations Test (MRT) and the Purdue Spatial Visualization Test: Rotations (PSVT:R). The MRT was developed by Vandenberg and Kuse [2] and it consists of 20
items. Each problem contains a criterion figure with two correct alternatives and two incorrect alternatives. Students are asked to identify which two of the alternatives are rotated images of the criterion figure. A sample problem similar to the problems on the MRT is shown in Figure 5.
A
B
C
D
Figure 5. Sample Problem from MRT The Purdue Spatial Visualization Test: Rotations (PSVT:R) was developed by Guay [3] to assess a person’s ability to visualize rotated solids. The test has 30 items and is scored as the percent correct. In this test, the top line of the problem shows an object and a rotated view of the object. In
the second line, a different object is shown and the student is to select from five choices what this second object would look like if it were rotated by the same amount as the first object. A sample problem from the PSVT:R is shown in Figure 6.
Figure 6. Sample Problem from PSVT:R
Present Study At EEM, in 1995, the special test was administered to 503 students, in 1996 to 665 students and in 1997 to 713 students. In 1997 the students also filled out background questionnaires. The questions asked of the students were related to those types of activities which are thought to develop spatial skills including: age, handedness, play with construction toys (like Legos® or Lincoln Logs®), previous geometry instruction, work experience, participation in certain sports, their parent’s technical instruction, play with video/computer games, previous descriptive geometry instruction, previous art courses, previous technical courses, previous experience with graphics/drafting and projectbased work experience. An additional question dealt with their career choice. At EEM the students choose their
engineering field of study (electrical, mechanical, chemical, production, food, civil or metallurgical) at the end of their first year. The collected data was analyzed in the following manner. First the test which had a better correlation with the student success in graphics was determined. In the second analysis stage, the answers to the background questionnaire were analyzed to determine their significance on test success. Those factors that were deemed significant were then tested for gender bias. Research in spatial visualization has been conducted at MTU for several years. In 1985, Baartmans found that of eleven variables tested, a student’s score on the PSVT:R was the most significant predictor for success in an introductory engineering graphics course [4]. However, no other type of spatial visualization exam was administered at
that time. In 1993 Baartmans and Sorby were awarded a Course and Curriculum Development grant from the National Science Foundation to develop a course and the course materials for developing spatial visualization skills in freshman engineering students [5]. In the fall of 1993, they administered the PSVT:R to 535 engineering students during freshmen orientation. Along with this test, the students were asked to fill out questionnaires similar to the ones administered at EEM. The data was also analyzed in a manner similar to the way it was done at EEM. Since 1993 various spatial visualization tests including the PSVT:R, MRT, and MCT have been administered to engineering students at MTU in conducting various research studies.
Although different testing instruments were used at the schools participating in the study, we believe that interesting gender-based differences in spatial visualization can be reported and that a certain amount of correlation exists between the data collected regardless of the testing instrument chosen. Gender Differences in Test Scores Student test scores were analyzed to determine if there were significant gender differences in visualization skills as measured by these testing instruments. Significant gender differences were found at both of the schools participating in this study. Table 1 summarizes the gender differences in student performance on these tests (Note that the data presented in this table is from Fall 1997 at MTU and is cumulative from 1995-97 at EEM).
Spatial Visualization Test Results The results of this study are summarized in the following.
Table 1: Average Test Scores in Percentages EEM
MTU
Gender Part A
Part B
Part C
Part D
PSVT:R
MRT
MCT
Male
73.2
32.3
65.5
22.0
83.3
75.0
54.3
Female
68.5
26.2
55.1
12.5
76.7
52.5
37.5
Significant and Non-Significant Factors for Spatial Skills
women but not for men, and M denotes significant for men but not for women). Note that the results presented here are from the fall of 1993 for data collected at MTU and from the fall of 1997 for data collected at EEM. It should be further noted that students at MTU choose their field of study prior to their first year in engineering and students at EEM choose their field of study after one year on campus.
Several factors were analyzed to determine their statistical significance in the development of 3-D spatial skills as measured by these testing instruments. The results of these are summarized in Table 2 below (X denotes not significant, NA denotes not questioned, W denotes significant for
Table 2: Significant Predictors for Success on Spatial Test MTU
EEM
Variable PSVT:R
Part A
Part B
Part C
Part D
0.001
0.000
0.000
0.000
0.000
Age
X
X
X
X
X
Field of Study
X
0.004*
X
0.000*
0.000*
Left/Right Handedness
X
X
X
X
X
Parents Tech. Instruction
NA
X
0.018
0.011
0.036
Video/Computer Games
X
X
X
M
M
Geometry Courses
X
0.000
0.000
0.000
0.000
NA
0.001
X
X
0.009
Gender
Descriptive Geometry
Table 2: Significant Predictors for Success on Spatial Test MTU
EEM
Variable PSVT:R
Part A
Part B
Part C
Part D
Art Courses
NA
0.030
W
0.050
X
Math Score
0.002
NA
NA
NA
NA
Drafting Experience
0.001
0.000
0.000
0.000
0.000
Technical Instruction
NA
0.001
X
X
0.001
Work Experience
X
0.000
0.000
X
0.001
Sports
X
X
X
X
X
0.0042
M
M
M
M
Play with Const. Toys
*significant only for those in electrical and food engineering majors Regression Analysis Results The multiple regression analysis comparing performance on the exam with performance during the engineering graphics course revealed that of the four parts of the exam administered at EEM, three produced regression coefficients significantly different from zero: parts A, C, and D. The results from the regression analysis are presented in Table 3. As it can be seen from the data presented in Table 3, of the tests administered, part A was the most significant predictor of success in the engineering graphics course. The 1998 version of the test will incorporate these results by reducing the total number of questions on the exam and by administering a different series of tests. Table 3: Regression Analysis for Visualization Exam at EEM Exam Component
Regression Coefficient
Significance
A
5.57
p