Burlington, MA 01803. Introduction. Most analyses of world politics and studies of national security policies recognize the inter- dependence among the salient ...
Identifying International Networks: Latent Spaces and Imputation Corey Lowell Lofdahl Michael D. Ward Peter D. Hoff1 Political Science Statistics Simulation & Information University of Washington University of Washington Technology Operations Seattle, Washington Seattle, Washington SAIC 98195 98195 Burlington, MA 01803
Introduction Most analyses of world politics and studies of national security policies recognize the interdependence among the salient actors across the salient issues. Traditionally, international politics has been defined as the scope and extent of the relations among independent countries, thought to be the most important elements in world politics. This means that actors as well as their actions are strategically interdependent (Signorino 1999). Ignoring the interdependence among these phenomena would appear to be a serious oversight that plague attempts to understand, let alone predict, the course of national security policy and world politics more generally. With very few exceptions, quantitative, systematic studies of international relations and national security have assumed that the major actors and actions that comprise world politics consist of unconnected actions and actors. Game theoretic models are legion, but rarely deal with more than two actors at a time. Some beginning attempts to model the interdependency in international relations have appeared in the literature (Ward and Kirby 1987; Gleditsch and Ward 2001; Gleditsch and Ward 2001; Ward and Gleditsch 2002; Gleditsch 2002; Lofdahl 2002), but as yet network models have yet be widely applied in scholarly or policy work on international politics. This is somewhat surprising, since it is evident at first blush that international politics is about the interdependence that appears around the world. Social network analysis is one technique that has been developed to map and measure the relationships and flows among agents. The nodes in the network are the individuals and groups and the links among them illustrate their interdependencies, both in terms of structure and in terms of the flows of information from one node to others. Since the development of the sociogram (Moreno 1934), sociologists among others have been interested in analyzing the linkages among individuals and groups. An interesting early example is found in the early work of Coleman, Katz and Menzel (1957). Most early theoretical advances were based on graph theory as developed and advanced by Frank Harary and his students and collaborators (Harary 1959; Harary 1969; Harary, Norman and Cartwright 1965). The so-called “Columbia school” worked throughout the 1960s and beyond to further advance the substantive findings in this arena of sociology (White 1963; White, Boorman and Breiger 1976). Broader dissemination of these ideas came much more recently with didactic writings (Knoke and Kuklinski 1982; Scott 1991) as well as early 1
Peter Hoff’s research is supported by Office of Naval Research grant N00014-02-1-1011.
1
applications that are by now canonical (Padgett and Ansell 1993; Hansell 1983). Indeed, social network analysis has become even more fashionable as outside of sociology in technical fields, and has spread to the wider press as an important method for understanding an increasingly perplexing and complicated social environment (Garreau 2001). However, it is somewhat ironic that to date there are no published applications of network analysis to the study of international relations.2 Hoff, Raftery and Handcock (2002 in press) developed probabilistic models of links among actors based on latent positions of actors in an unobserved “social space.” We apply such a model a large database on international relations that is typical for the national security and international politics literatures, and discuss making predictive inference on links that are missing at random. In particular, we analyze the interactions among important social actors in Central Asia, using data taken from the Kansas Event Data Survey an automated textually oriented data generating process (Schrodt, Davis and Weddle 1994; Gerner, Schrodt, Francisco and Weddle 1994), specifically the CASIA database, available from the KEDS Web site at http://www.ku.edu/ keds/data.html. This database captures the daily ebb and flow of cooperative and conflictual events among important political and economic agents (typically called “actors” in the international relations literature) in the Central Asian region. Our main purpose is to illustrate the value in using a latent space approach to understanding network structure in an applied, international relations context.
Event Data on International Relations among Central Asian Countries Event data are nominal or ordinal codings of the recorded interactions of international actors.3 Berelson (1952) introduced the concept of content analysis to the social sciences, but it was North, Holsti, Zaninovich and Zinnes (1963) that pioneered its use in studies of world politics . Event data have been widely used in quantitative international relations research and in policy research for four decades, following their introduction, event data in international relations were widely used (North 1967; McClelland and Hoggard 1969; Azar 1980). Until the development of machine coding the World Event Interaction Survey (WEIS) and Conflict on Peace Databank (COPDAB) were the two dominant schema. The contemporary, state-of-the-art is found in the Kansas Event Data System (KEDS) which uses automated coding of English-language news reports to generate political event data (Schrodt 2000; Schrodt, Davis and Weddle 1994). According to Schrodt, there are three major steps involved in creating event data. 2
Steven J. Brams (1966; 1968) and later Schofield (1972) tried to estimate linkages among countries, but this line of research was not pursued. Some work with elementary graph theory in the field of international relations has appeared more recently (Lai 1995), but like most of the early work, this applies to a small number of actors, typically three. 3 This section is taken and adapted with permission from the KEDS Web site at http://www.ku.edu/ keds/intro.html.
2
1. First, a source of news is identified. Typically a news summary is used, ideally one that is already available in a machine readable format. The two current de facto publically available standards are the Reuters news service lead paragraphs or the Foreign Broadcast Information Service (FBIS)4 2. Second, a coding system is developed, or one of the extant coding systems such as the World Events Interaction Survey (aka WEIS), the Conflict and Peace Data Bank ¨ ur Yilmaz (COPDAB), or CAMEO (a KEDS coding schema (Gerner, Schrodt, Om¨ and Abu-Jabr 2002)) is chosen. This coding system must specify what types of interactions constitute an “event.” This requires the specification of which actors will be coded, for example, whether nonstate actors such as NATO and the United Nations or guerilla movements or salient individuals will be included. At the same time the coding rules must specify what basic issue areas will be included. The COPDAB data set includes a general “issue area” which describes whether an action is primarily military, economic, diplomatic or one of five other types of relationship. In contrast, WEIS also had a few specific “issue arenas” such as the Vietnam War, Arab- Israeli conflict, and SALT negotiations. 3. The coding rules themselves may be developed in terms of a manual that is given to human coders or more frequently is encapsulated in a computer program such as KEDS, which uses extensive dictionaries to identify actors and events and associate these with specific numerical codes. These dictionaries are developed theoretically by specification and tuned practically by coding a large number of test sentences from the actual data and adding the appropriate vocabulary when the machines makes an observed error. Table 1 shows a sample of the lead sentences of reports on the Reuters newswire that preceded Iraq’s invasion of Kuwait in August 1990. Generally each lead corresponds to a single event, though some sentences generate multiple events. For example, the lead sentence for July 23, 1990 is “Iraqi newspapers denounced Kuwait’s foreign minister as a U.S. agent Monday.” This corresponds to WEIS category 122, defined as “Denounce; denigrate; abuse”. In this event, Iraq is the source (actor) of the action and Kuwait is the target. Together, these generate the event record that corresponds to an event in which Iraq denounces Kuwait.5 The WEIS codes and associated Goldstein (1992) weights are given in 2 for some of the WEIS categories. Goldstein scores are psychometrically determined weights, where a positive weight means that the event has positive affect; conversely, a negative Goldstein score indicates negative affect. Table 3 shows the Reuters stories converted to WEIS events. Event data analysis relies on a large number of events to produce meaningful patterns of interaction. The information 4
FBIS is available at http://199.221.15.211/, while Reuters can be contacted via www.reuters.com. This gives “900723 IRQ KUW 122” where “900723” is the date of the event, IRQ is a standard code for Iraq, KUW is the code for Kuwait, and 122 is the WEIS category. 5
3
Table 1: Reuters Chronology of 1990 Iraq-Kuwait Crisis, adapted from Schrodt (http://www.ku.edu/ keds/intro.html), with permission. The Iraqi denunciation of Kuwati on July 23, 1990 is a typical conflict event. Date July 17, 1990
Headline RESURGENT IRAQ SENDS SHOCK WAVES THROUGH GULF ARAB STATES
July 23, 1990
IRAQ STEPS UP GULF CRISIS WITH ATTACK ON KUWAITI MINISTER
July 24, 1990
IRAQ WANTS GULF ARAB AID DONORS TO WRITE OFF WAR CREDITS
July 24, 1990
IRAQ, TROOPS MASSED IN GULF, DEMANDS $25 OPEC OIL PRICE
July 25, 1990
IRAQ TELLS EGYPT IT WILL NOT ATTACK KUWAIT
July 27, 1990
IRAQ WARNS IT WON’T BACK DOWN IN TALKS WITH KUWAIT
July 31, 1990
IRAQ INCREASES TROOP LEVELS ON KUWAIT BORDER
August 1, 1990
CRISIS TALKS IN JEDDAH BETWEEN IRAQ AND KUWAIT COLLAPSE
August 2, 1990
IRAQ INVADES KUWAIT, OIL PRICES SOAR AS WAR HITS PERSIAN GULF
4
Lead Sentence Iraq President Saddam Hussein launched an attack on Kuwait and the United Arab Emirates (UAE) Tuesday, charging they had conspired with the United States to depress world oil prices through overproduction. Iraqi newspapers denounced Kuwait’s foreign minister as a U.S. agent Monday, pouring oil on the flames of a Persian Gulf crisis Arab leaders are struggling to stifle with a flurry of diplomacy. (I.e., Iraq Denounces Kuwait.) Debt-burdened Iraq’s conflict with Kuwait is partly aimed at persuading Gulf Arab creditors to write off billions of dollars lent during the war with Iran, Gulf-based bankers and diplomats said. Iraq’s oil minister hit the OPEC cartel Tuesday with a demand that it must choke supplies until petroleum prices soar to $25 a barrel. Iraq has given Egypt assurances that it would not attack Kuwait in their current dispute over oil and territory, Arab diplomats said Wednesday. Iraq made clear Friday it would take an uncompromising stand at conciliation talks with Kuwait, saying its Persian Gulf neighbor must respond to Baghdad’s “legitimate rights” and repair the economic damage it caused. Iraq has concentrated nearly 100,000 troops close to the Kuwaiti border, more than triple the number reported a week ago, the Washington Post said in its Tuesday editions. Talks on defusing an explosive crisis in the Gulf collapsed Wednesday when Kuwait refused to give in to Iraqi demands for money and territory, a Kuwaiti official said. Iraq invaded Kuwait, ousted its leaders and set up a pro-Baghdad government Thursday in a lightning pre-dawn strike that sent oil prices soaring and world leaders scrambling to douse the flames of war in the strategic Persian Gulf.
Table 2: Selected WEIS action categories and Goldstein Scores. Yield (1.0) Retract (2.0) Comment (0.0) Neutral Comment (-0.2) Consult (1.0) Receive (2.8) Praise (3.4) .. . Kidnap, Jail (-2.5) Non-Injury Destruction (-8.3) Riot, Violent Clash (-7.0)
Surrender (0.6) Accommodate, Cease Fire (3.0) Decline Comment (-0.1) Optimist Comment (0.4) Meet (1.0) Vote, Elect (1.0) Endorse (3.6) .. . Spy (-5.0) Non-Military Destruction (-8.7) Assassinate Torture Execute (-9.0)
Retreat (0.6) Cede Power (5.0) Pessimist Comment (-0.4) Explain Position (0.0) Visit (1.9) Approve (3.5) Rally (3.8) .. . Force (-9.0) Military Engagement (-10.0) Coup Attempted (-8.0)
provided by any single event is very limited; single events are also affected by erroneous reports and coding errors. However, important events trigger other interactions throughout the system. For example while Iraq’s invasion of Kuwait by itself generates only a single event with WEIS code 223–military force–the invasion triggers an avalanche of additional activity throughout the international system as states and international organizations denounce, approve or comment, so the crisis is very prominent in the event record. This kind of implicit triggering is analyzed and described in Schrodt and Mintz (1988) and Ward and House (1988). Table 3: Coding of the 1990 Iraq-Kuwait Crisis, using WEIS coding scheme. These events appear in textual format in Table 1, above. Date 900717 900717 900723 900724 900724 900725 900727 900731 900801 900802
Actor Target IRQ KUW IRQ UAE IRQ KUW IRQ ARB IRQ OPC IRQ EGY IRQ KUW IRQ KUW KUW IRQ IRQ KUW
WEIS Action Code Type of Action 121 CHARGE 121 CHARGE 122 DENOUNCE 150 DEMAND 150 DEMAND 054 ASSURE 160 WARN 182 MOBILIZATION 112 REFUSE 223 MILITARY FORCE
Data generated in this fashion are exactly the same kind of data that are used to repre5
sent social networks. Yet, to date, despite the widespread use of such data in international relations, there are no published studies which analyze these kind of data from a social network perspective. We turn to the application of latent space analysis of social networks using these data in the following sections.
Latent Space Models of Network Structures Let yi,j denote the value of a relationship between agent i and agent j; these relationships may be measured discretely or continuously. The matrix Y is variously called a transaction matrix, a sociomatrix, or a spatial weights matrix. Let X comprise observed characteristics (co-variates) that can be specific to the agents i or j, or specific to their interaction i, j.6 The observed network is assumed to be a function of all relevant co-variates, observed or not observed. The presence of important non-observed co-variates often leads to dependencies in the network Y . The models of (Hoff, Raftery and Handcock 2002 in press) assume the dependencies in the data can be represented via a latent, unrealized position or characteristic zi for each node i, and that the network responses are conditionally independent given the set of latent positions. Given this assumption, we can express the probability of the given network conditional on the latent positions of the agents and their characteristics as Y P (yi,j |zi , zj , xi,j , θ, σ 2 ). P (Y |Z, X, θ) = (1) i6=j
Unconditional on the zi ’s, the data are dependent. If the data are binary, Equation (1) can be parameterized as a logistic regression model in which the probability of linkage depends on some projected closeness between the agents (zi and zj ) and covariates such that: 0
0
ηi,j = log odds(yi,j = 1|zi , zj , xi,j , α, β, σ 2 ) = α + β xi,j + zi zj ,
(2)
where zi and zj represent the projected positions of actors i and j in the latent space. Suppose that each actor i has an associated vector zi of characteristics. Each vector can be thought of as comprising a position on a k-dimensional sphere of unit radius (the direction of the zi ), as well as an “activity level” (the length of zi ). In the model above, agents i and j are more likely to have linkages if they have simliar locations on the sphere, and they are “active,” that is, if zi0 zj is large and positive. This leads to a (log) probability of the sociomatrix specified as: logP (Y |η) =
X 0 0 0 0 (yi,j (α + β xi,j + zi zj ) − log(1 + e(α+β xi,j +zi zj ) )).
(3)
i6=j 6
Most of the notation (but not necessarily the terminology) herein follows (Hoff, Raftery and Handcock 2002 in press).
6
Maximum likelihood and Bayesian estimates for the parameters in this model can be obtained in a straightforward way. First, the maximum likelihood estimates of the parameters are formed by direct maximization of Equation (3). Then, with this estimate as a starting value and with diffuse prior distributions over the model parameters, a Markov chain is constructed to generate samples of the parameters from the posterior distribution. Such a sample is generated by drawing proposal values from a symmetric proposal distribution, and accepting the proposal with an appropriate probability. For example, in sampling a new Z value at the kth stage of the chain, we sample a proposal value Z˘ from a proposal distribution J(Z|Zk ), where Zk is the most recently sampled value. The proposal is ac˘ p(Y |Z,α ,β ,σ 2 ,X)
˘
π(Z) cepted as the new value Zk+1 with probability p(Y |Z,αkk ,βkk ,σk2 ,X) π(Z , where π(Z) is the prior k) k distribution for Z. If the proposal is not accepted, then Zk+1 is set equal to Zk . This approach has been used by Hoff, Raftery and Handcock (2002 in press) to estimate several of the classic social network analysis data sets.7 The basic setup is quite general and can be even more widely employed.
Estimation of Network Links in CASIA database We use this framework to estimate the network structure of the political interactions of the primary actors in Central Asian politics over the period from 1989 through 1999. This region has a great deal of conflict and spotty coverage in English language media, despite its contemporary salience. Based on the CASIA database, there are 113 such actors which have been deemed by substantive experts to be significant. Of these, there are 51 country level actors that have interactions with one another during this eleven year period. We sum the paired interactions among these 51 countries across the eleven year period. A link is deemed to occur for any interaction between two countries during this period. Thus, our data is a 51 × 51 sociomatrix in which an entry is 1 if and only if there is an interaction between i and j in the CASIA database between 1989 and 1999; otherwise it is 0. We use a single covariate for this analysis: xi,j is the distance in thousands of kilometers between the capital city of each of the countries. Distance is widely employed as an indicator of interaction in international relations: countries closer together have higher probabilities of having linkages. We have glossed over the important content of the interactions. Some will have been cooperative and others highly conflictual. There are many debates in the national security literature about reciprocity. It turns out that countries that have high levels of cooperative interactions also tend to have high levels of conflictual interactions. So this seems a reasonable approximation, though it is certainly possible to disaggregate these data by event type, issues, and time. Treating all years in one aggregation is not optimal perhaps, but it does reduce considerably the sparseness of the data. We also recognize that some pairs of countries will have 7
These are the drosophila melanogaster of social network analysis, the so-called Monk data (Sampson 1968), as well as data on Florentine marriage patterns among Medici families (Padgett and Ansell 1993), and data on classroom friendship networks (Hansell 1983).
7
many more interactions. Examination of the histograms of the actual data suggested to us that most of the information about the linkages was captured in the dichotomy; most of the responses were zero and the second most likely value was 1. Equation 3 was estimated using direct optimization of the maximum likelihood to generate starting values for the MCMC. One million iterations of the chain were run to obtain estimates of the parameters α and β as well as the latent positions Z and their underlying variance σ 2 . The negative coefficient for the distance covariate indicates a lower probability of interaction at greater distances, consistent with many published results from different contexts. These estimates are presented in Table 4. Table 4: Maximum Likelihood and MCMC estimates of parameters for the sociogram of the 51 countries involved in Central Asian politics over the period from 1989-1999. Quantile based confidence intervals are provided for the MCMC estimates. 95% Confidence Interval Parameter MLE MCMC 2.5% 97.5% α -4.32 -4.20 -4.69 -3.06 β -0.26 -0.25 -0.40 -0.21 2 σ 5.82 4.48 10.53 ˆ and σ Figure 1 illustrates the trajectories of the log likelihood and the parameters α ˆ , β, ˆ2 over the 106 scans of the Markov chain. These plots suggest that the chain mixes reasonably well for all the estimated parameters. The density of these estimated distributions are
−0.40 −0.45
−5.0
−0.50
−470
4
−5.5
6
−460
8
−4.5
−450
−4.0
10
−440
−430
Figure 1: MCMC Diagnostic plots of parameter estimation via 106 scans of Markov Chain.
0
500
1000
1500
(a) MCMC L
2000
0
500
1000
1500
2000
0
(b) σˆ2
500
1000
(c) α ˆ
1500
2000
0
500
1000
1500
2000
(d) βˆ
presented in Figure 2. These represent the marginal posterior densities, with vertical lines representing the maximum likelihood estimate. Each of these densities presents a fairly narrow bandwidth. 8
8 4
Density
Density 2
4
6
8 N = 2000
10
12
Bandwidth = 0.2822
(a) σ ˆ
14
16
0
0.0
0.00
0.05
0.2
2
0.10
0.4
0.15
Density
0.6
0.20
6
0.8
0.25
1.0
0.30
Figure 2: Marginal Posterior Densities of the Estimated Parameters. Vertical lines present the MLE.
−6
−5
−4
N = 2000
Bandwidth = 0.08126
−3
−2
−0.5
−0.4
−0.3
N = 2000
(b) α ˆ
−0.2
Bandwidth = 0.00984
(c) βˆ
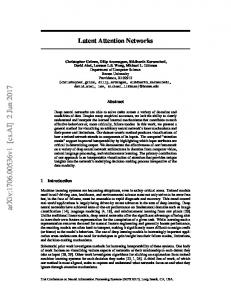
As interesting as these estimates and diagnostics are, the most interesting output of a latent space analysis is the position of the actors in the latent space. Figure 3 illustrates these positions for the 51 countries analyzed. Figure 4 displays the relative, latent positions of countries projected onto a circle. Countries that are close together on this circle have higher probability of sharing a link. Since this set of countries shares many ties, many countries are close to one another in latent space.
Imputation of Missing Network Linkages in CASIA Gauging whether a network is completely sampled is perhaps the holy grail of network analysis. As yet there is no simple solution to this perplexing problem. We offer no complete solution here. However, practically, it may be useful to use imputation methods along with the latent space estimates to gauge whether or not a link that does not turn up actually may be missing at random. We conduct an experiment using the CASIA database through the following procedure: 1. Randomly assign NA to 100 yi,j ’s , keeping track of the 100 actual values of these “missing” data; 2. Fit the model using the non missing data; 3. For each missing yi,j , use the parameter estimates to the calculate predicted probability pˆi,j that each missing value yi,j equals one, i.e. is a hidden links; 4. Compute the number of correct and incorrect predictions, using as a first cut a 0.5 threshold; 9
U
ni
te
d
St
at
es
8
an st ki Pa
ra
ea
A
or
C
-2
B
am
el
gi
bo d
ia
um
U
ni
te
d
K S Sr in g i L ap an o re ka
0
b PR E m C So N ir a hi u o Cr na In te Kth z ew s u d A c ha yTGa Cuw f ia Ir a L e R hn b aSiar i n R o b ae paQLznaiK a t ucda uaabnie n Ii mNY noY a u nbtlyaaa y a srAa r eal b N neiatgh os eSmicur R or e r la eEdna ia us th la v gny si KC n di a pt a ora nI ts a e A a dlyIr a us In a aq t d C ria M P o n y U e e Po p r ni a l ru s ia te i r tu us d A ga n K l go A in gd la u st om ra li a J F r ap an an Sw ce it z G er er A la m fg nd an ha y n
is
ta
n
6 4 2
L atent D im ension 2
-3
-2
-1
0
1
2
3
Latent Dimension 1
Figure 3: The Latent Positions of 51 Countries as a function of their interactions in Central Asia. The United States has links to many of the other countries, as do Pakistan, Afghanistan, China, Russia, and India.
5. Compute the Brier score (Brier 1950): (n(n − 1))−1
P
i,j i6=j (pˆ
− yi,j )2 .
6. Repeat the above steps 200 times; and finally, 7. Compare these results to a standard, logistic framework with the same covariates. The results of this experiment are quite supportive of using latent space to predict non-sampled or hidden network linkages. For the 200 runs, the average Brier score was 0.087, which is quite low. The proportion of correctly predicted observations was 0.88. The original sociomatrix has about four non-links for every link. This means that a modal guess of 0 would result in correctly predicting about 0.80 of the observations. Thus, the latent space approach improves significantly upon that result, garnering an additional 8 of the remaining 20 percent. Specifically, conditional on the true value being no linkage, the predicted value is 0 with probability of 0.95. Given that the true value is 1 (i.e., linkage), the predicted value is 1 with probability of 0.67. 10
ni te K o d A r ea ra b Em ir a Q at te ar P R s I nd So L e C ia h u b S a tPh Aan o C K ina u de r f n z e u w i Au r ic c h a i t ra a IRr ae p bi a KI sr n ubl e na e ic Ta yl U I ta ni n z Li a te ly an b y d Y i St Gh a a ug at Ru U o a es N s n n M s l av a ite Eg a si et a he li d y i a p r la Af P K t i a nd gh k ng A s a is d ng CuI r anqistat n om ol Ro a m ba an Po a In F r N Ye r tu ni a d o an or m ga J a th e n ne c e l p a AuC a n si a Ko S Au n str a d r e ud C S a a a B an w Se C a yp s tr Nli a e i tz lg ia G o ne mb r u iu er s ga o r e m la r m wa l dia nd an y y
U S r S in iL g a n a po k a re
Figure 4: The latent positions of countries is projected on a unit circle. Because many of the positions are very close to one another, the positions have been loosely jittered so that the overlap of country labels is reduced.
In comparison, a logistic model using the same geographic covariate, the average Brier score is almost twice as high (0.17); higher Brier scores indicate poorer predictive performance. A logistic model, as is typical of this approach, will correctly predict all the zeros and none of the links, because it, like the modal guess, always predicts 0. The upshot of this experiment is the important implication that if we sample network ties at random, then estimate the latent positions, this approach can be used to predict the yi,j that were not sampled. Although quantitative models in international relations that make actual predictions are themselves rare (Schrodt 2000; King and Zeng 2001; Ward and Gleditsch 2002) for a variety of reasons (Schrodt 2002), these results are strong in comparison. More broadly this approach identifies an effective way to sample networks.
11
Conclusion The latent space approach to social network analysis seems promising. It performs quite well in identifying observed, complete networks in the national security realm. It does so in a way that embraces the interdependence of the network data, rather than assuming that it is generated randomly. Moreover, the approach facilitates the presentation of network positions in an intuitively satisfying way, mapped into a small number of dimensions. These locations incorporate measures of uncertainty. Perhaps most importantly this approach is quite general, since it encapsulates a broader class of models. Specifically, a variety of discrete and continuous specifications can easily be adapted, depending upon the data generating process. Finally, our experiments on using the latent space positions to impute missing at random network links proved to be remarkably productive, especially given the absence of any substantive covariates. This leads to the exciting result that it may be possible to use this approach to sample network ties at random, then estimate the latent positions in order to predict network ties that were not initially sampled.
References Azar, Edward. 1980. “The Conflict and Peace Data Bank (COPDAB) Project.” Journal of Conflict Resolution 24:143–152. Berelson, Bernard. 1952. Content Analysis in Communication Research. Glencoe, IL: Free Press. Brams, Steven J. 1966. “Transaction Flows in the International System.” American Political Science Review 60:880–898. Brams, Steven J. 1968. “DECOMP: A Computer Program for the Condensation of a Directed Graph and the Hierarchical Ordering of Its Strong Components.” Behavioral Science 13:344–345. Brier, G.W. 1950. “Verification of forecasts expressed in terms of probabilities.” Bulletin American Meteorological Society 78:1–3. Coleman, James S., Elihu Katz and Herbert Menzel. 1957. “The Diffusion of an innovation among physicians.” Sociometry 20:253–70. Garreau, Joel. 2001. “Disconnect the Dots: Maybe We Can’t Cut Off Terror’s Head, but We Can Take Out Its Nodes.” Washington Post September 17:C–01. ¨ ur Yilmaz and Rajaa Abu-Jabr. 2002. Conflict Gerner, Deborah J., Philip A. Schrodt, Om¨ and Mediation Event Observations (CAMEO): A New Event Data Framework for a Post Cold War World. Annual Meetings of the American Political Science Association Boston, MA: . 12
Gerner, Deborah J., Philip A. Schrodt, Ronald Francisco and Judith L. Weddle. 1994. “The Analysis of Political Events using Machine Coded Data.” International Studies Quarterly 38:91–119. Gleditsch, Kristian S. and Michael D. Ward. 2001. “Measuring Space: A Minimum Distance Database and Applications to International Studies.” Journal of Peace Research 38(6):749–768. Gleditsch, Kristian Skrede. 2002. All International Politics is Local: The Diffusion of Conflict, Integration, and Democratization. Ann Arbor, MI: University of Michigan Press. Goldstein, Joshua. 1992. “A Conflict-Cooperation Scale for WEIS International Events Data.” Journal of Conflict Resolution 36(2):369–385. Hansell, Stephen. 1983. “Cooperative Groups, Weak Ties, and the Integration of Peer Friendships.” Social Psychology Quarterly 47(4):316–328. Harary, Frank. 1959. “Graph theoretic methods in the management sciences.” Management Science 5:387–403. Harary, Frank. 1969. Graph Theory. Reading, MA: Addison-Wesley. Harary, Frank, Robert Norman and Dorwin Cartwright. 1965. Structural Models. New York: Wiley. Hoff, Peter D., Adrian E. Raftery and Mark S. Handcock. 2002 in press. “Latent Space Approaches to Social Network Analysis.” Journal of the American Statistical Association tba(tba):tba. King, Gary and Langche Zeng. 2001. “Improving Forecasts of State Failure.” World Politics 53(4):623–658. Knoke, David and James H. Kuklinski. 1982. Network Analysis. Beverly Hills, CA: Sage. Lai, David. 1995. “A Structural Approach to Alignment: A Case Study of the ChinaSoviet-U.S. Strategic Triangle, 1971-1988.” International Interactions 20(4):349–374. Lofdahl, Corey L. 2002. Environmental Impacts of Globalization and Trade: A Systems Study. Cambridge, MA: The MIT Press. McClelland, Charles A. and Gary Hoggard. 1969. Conflict patterns in the interactions among nations. In International Politics and Foreign Policy, ed. James N. Rosenau. New York: The Free Press pp. 711–724. Moreno, Jakob L. 1934. Who Shall Survive? Disease Publishing Company. 13
Washington, D.C.: Nervous and Mental
North, Robert C. 1967. “Perception and Action in the 1914 Crisis.” Journal of International Affairs 21:103–122. North, Robert C., Ole R. Holsti, M. George Zaninovich and Dina A. Zinnes. 1963. Content Analysis: A Handbook with Applications for the Study of International Crisis. Chicago: Northwestern University Press. Padgett, John F. and Christopher K. Ansell. 1993. “Robust Action and the Rise of the Medici, 1400-1434.” American Journal of Sociology 98:1259–1319. Sampson, S.F. 1968. A Novitiate in a Period of Change: An Experimental and Case Study of Relationships, unpublished Ph. D. Dissertation, Department of Sociology, Cornell University, Itaca, NY. Schofield, Norman J. 1972. “A Topological Model of International Relations.” Peace Research Society, Papers 18:93–112. Schrodt, Philip A. 2000. “Forecasting conflict in the Balkans using Hidden Markov Models.” Presented at the Annual Meetings of the American Political Science Association, Washington, D.C. Schrodt, Philip A. 2002. Forecasts and Contingencies: From Methodology to Policy. Annual Meetings of the American Political Science Association Boston, MA: . Schrodt, Philip A. and Alex Mintz. 1988. “A Conditional Probability Analysis of Regional Interactions in the Middle East.” American Journal of Political Science 32(1):217–230. Schrodt, Philip A., Shannon G. Davis and Judith L. Weddle. 1994. “Political Science: KEDS-A Program for the Machine Coding of Event Data.” Social Science Computer Review 12(3):561–588. Scott, John. 1991. Social Network Analysis: a Handbook. Newbury Park, CA: Sage. Signorino, Curtis. 1999. “Strategic Interaction and the Statistical Analysis of International Conflict.” American Political Science Review 92(2):279–298. Ward, Michael D. and Andrew M. Kirby. 1987. “Re-examining Spatial Models of International Conflict.” Annals of the American Association of Geographers 77:86–105. Ward, Michael D. and Kristian Skrede Gleditsch. 2002. “Location, Location, Location: An MCMC Approach to Modeling the Spatial Context of War and Peace.” Political Analysis 10(3):244–260. Ward, Michael D. and Lewis L. House. 1988. “A Theory of Behavioral Power of Nations.” 32(1):3–36. White, Harrison. 1963. An Anatomy of Kinship: Mathematical Models for the Structure of Cumulated Roles. Englewoods Cliffs, NJ: Prentice Hall. 14
White, Harrison, Scott Boorman and Ronald Breiger. 1976. “Social Structure From Multiple Networks; Blockmodels of Roles and Positions.” American Journal of Sociology 81:730–799.
15