their DNS names, which include identifiable words such as. âcrawlerâ, âbotâ, âsearchâ ..... events and proposed a protection technique based on CDN simulation.
Identifying Low-Profile Web Server’s IP Fingerprint Mengjun Xie, Keywan Tabatabai, Haining Wang Computer Science Department The College of William and Mary Williamsburg, VA 23187-8795 {mjxie,kftaba,hnw}@cs.wm.edu Abstract With the immense success of World Wide Web, Web servers have become ubiquitous for all kinds of organizations, even for individuals. While most previous research has been conducted on high-profile Web servers, the majority of Web servers on the Internet are low-profile. In this paper, we focus on the low-profile Web servers inside a middle-sized campus network. We collect eight-month traces on ten departmental Web servers and investigate the dynamics of IP addresses of their remote clients. After analyzing accesses of remote clients to the monitored servers, we find that (1) the pool of 32-bit IP addresses seen by a server rarely converges to a stable set, i.e., there are always a large portion of unseen 32-bit IP addresses sighted in each weekly trace; (2) however, the group of frequent visitors to a server is relatively stable, and a simple clustering by 24-bit IP prefix further confirms this observation; (3) although the portion of frequent visitors is small, the volume of requests they issue dominates in total; (4) last but not least, each Web server has its own group of loyal clients excluding Web crawlers. We call such a relatively stable and unique pool of “loyal” clients for each low-profile Web server its IP fingerprint. Keywords — Measurement, Web servers, IP addresses.
1 Introduction After more than a decade of exponential growth, the World Wide Web has become part of people’s daily life with numerous Web servers on the Internet. A significant amount of research has been done on Web server workload characterization [3–7, 9, 12, 13]. The focus of previous work is on high-profile Web servers, i.e., the popular Web servers, such as CNN and MSNBC. However, high-profile Web servers are only a small portion of the World Wide Web, which mainly consists of low-profile Web servers used for all kinds
of organizations, such as small e-businesses, K-12 schools, and academic departments at universities. Most low-profile Web servers provide more specific but limited Web contents, and have much fewer clients than high-profile servers. At the same time, compared with highly dynamic Web contents on high-profile servers, the Web contents on low-profile servers are relatively stable. Therefore, intuitively, the domain of clients who have interest in a low-profile Web server may be relatively stable as well. However, as far as we know, not much research work on characterizing the client dynamics for low-profile web servers has been conducted yet. In this paper, we focus on the low-profile Web servers inside a middle-sized campus network, and aim to thoroughly investigate the IP address1 dynamics of their remote clients. We collect eight-month traces on ten departmental Web servers. After analyzing the remote accesses to these servers in the traces, we have the following findings. 1. Contrary to our intuition, the pool of full IP addresses in 32-bit seen by a server rarely converges to a stable set, i.e., there are always a large portion of unseen 32-bit IP addresses sighted in each weekly trace. In addition to the occasional come-and-go clients, we attribute this observation to the wide usage of DHCP (Dynamic Host Configuration Protocol) in cable modem and wireless accesses. 2. The pool of IP addresses of frequently-visiting clients fluctuates at lower ranges, implying that the group of frequent visitors to a low-profile server is relatively stable. A simple clustering by 24-bit IP prefix further confirms this observation. 3. Although the portion of frequent visitors is small, the volume of requests they issued dominates in total. 4. Last but not least, each Web server has its own group of loyal clients excluding Web crawlers, which has small overlap with others. 1 IP
address studied in this paper refers to IPv4 address only.
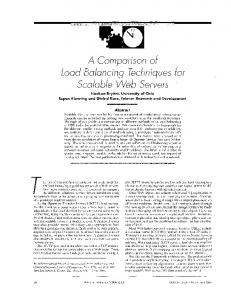
2 Data Collection We choose ten departmental Web servers at the College of William and Mary in this measurement study. The majority of these Web servers reside on different sub-networks of the college’s class B network. Since these servers attract Web accesses inside the college for sure, we are more interested in remote accesses originating from outside the campus network. So our collected Web server traces only include those remote accesses with focus on their source IP addresses. To investigate the dynamics of remote clients for these low-profile Web servers, we use Cisco Pix Firewall deployed on the gateway that connects the campus network to the Internet to log the remote accesses. One day’s log starts at 4:00 am in the morning and lasts twenty-four hours until 4:00 am of the following day. No content information is logged for the privacy concern. The IP addresses of remote clients, whose packets go to TCP port 80 (HTTP) of the monitored Web servers, are recorded with their access time. To capture the Web session information at the IP layer, each IP address is only recorded once within 20 seconds2 , which means after the moment being logged, the address won’t be repeatedly logged within the next 19 seconds. So, the number of Web requests from a specific IP address can be expressed by the number of appearance of that IP address in the log file. The data collection lasts eight months, from August 1st, 2004 (week 1) to March 12th, 2005 (week 32). Table 1 lists the monitored Web servers and the total number of IP addresses and requests seen by each server. We further divide these ten Web servers into different groups according to their locations (academic department or 2 According to [14], most TCP connections last 12-19s in Web sessions.
Class Academic
AS CC Chem
Non−aca
We call such a relatively stable and unique pool of “loyal” clients for each low-profile Web server its IP fingerprint. Although the concept of IP fingerprint is derived from the observations of ten local Web servers, we believe that it may exist universally for most low-profile Web servers, due to their common “low-profile” nature. This IP fingerprint feature can be utilized in many aspects of management for low-profile Web servers such as Web QoS [2], admission control [8], and security protection [10], etc. The remainder of the paper is organized as follows. Section 2 briefly describes the procedure of data collection. Section 3 gives a broad view of the spectrum of the recorded IP addresses. Section 4 details the dynamics of the client IP addresses of ten low-profile Web servers and proposes the concept of IP fingerprint. Section 5 discusses potential applications of IP fingerprint. Section 6 surveys related work. Finally, Section 7 concludes the paper.
CS
Swem IT
SIN 0
Phy
BS
Math
30K
60K
90K
IP addr number
Figure 1. Classification of monitored Web servers
non-academic department) and the total number of their visitors (distinct remote IP addresses), which is shown in Figure 1. We find that the Web servers belonging to the same group have quite similar characteristics in terms of measurement results, which will be described later. For the ease of presentation, we choose only one Web server from each group with multiple members as representative in Section 4. Those Web servers are marked with name-in-rectangle in Figure 1.
3 Spectrum of Observed IP Addresses By analyzing weekly traces for all monitored Web servers, we observe that the recorded IP addresses can be roughly classified into five distinct clusters over the entire 32-bit IPv4 address space. Each cluster is separated from others by a big chunk of contiguous /8 address blocks, in which few or no IP address is recorded. The majority of these unrecorded address blocks are reserved by IANA [1], for instance, blocks from 92.0.0.0/8 to 120.0.0.0/8 and from 173.0.0.0/8 to 187.0.0.0/8. Figure 2 shows the spectrum of recorded IP addresses with their corresponding requests observed in week 20 (left) and in all 32 weeks (right). The IP address spectrums observed in other weeks are similar to that in week 20. As shown in Figure 2, starting from the lowest end of IP address space, the first cluster lies approximately in the range from 4.0.0.0/8 to 24.0.0.0/8, in which the majority of client IP addresses belong to three class A networks 4.0.0.0/8 owned by Level 3, 12.0.0.0/8 owned by AT&T, and 24.0.0.0/8 owned by multiple Cable ISPs (Internet Service Providers), respectively. IP address range from 60.0.0.0/8 to 72.0.0.0/8 forms the second cluster, in which most IP addresses belong to second-tier ISPs, such as AOL, Verizon DSL, and Cox Cable. It makes sense that a plethora of Website hits are from these residential locations, due to
Department Computer Science (CS) Physics (Phy) Business School (BS) Swem Library (Swem) Information Technology (IT) Mathematics (Math) Student Information Network (SIN) Applied Science (AS) Chemistry (Chem) Computational Cluster (CC)
Host Names zimbo.cs.wm.edu spiffy.physics.wm.edu business.wm.edu intranet.swem.wm.edu it.wm.edu mathserver.wm.edu sin.wm.edu dm.as.wm.edu pooh.chem.wm.edu compsci.wm.edu
IP addresses 173,679 98,142 88,523 75,134 74,821 45,500 24,615 22,598 21,300 20,475
Requests 1,113,497 761,069 914,349 693,941 631,250 237,571 525,082 147,475 109,748 150,312
Table 1. Ten monitored Web servers
Week 20
All 32 weeks 100000 10000
1000
# of Requests
# of Requests
10000
100
10 5 2 1
1000 100 10 5 2 1
0
64
128
192
224
0
IP Address Space
64
128
192
224
IP Address Space
Figure 2. Spectrum of observed IP addresses in week 20 (Left) and in all 32 weeks (Right) the fact that off-campus students and faculty members may access the Web servers from their homes. In addition, perspective students in high schools may also access their interested Web servers from home. Note that the IP addresses of multiple Web crawlers are also in this range, which can easily be recognized by their extraordinary request volumes. The range of the third cluster is quite small, from 80.0.0.0/8 to 85.0.0.0/8, in which IP addresses are allocated to multiple European ISPs. The fourth cluster covers a large range of class B IP address space, starting from 128.0.0.0/8 and ending at 172.0.0.0/8. This category mainly consists of enterprise networks as well as educational campus networks. It is no surprise that many observed IP addresses belong to other university networks or high-school domains. Requests from enterprise networks may have multiple reasons, including company recruiting, alumni revisiting, research collaboration, etc. The last cluster spans the whole range of class C IP address space. We are also interested in the geographic locations of those recorded IP addresses. Instead of pinpointing the exact location of each IP address, we attempt to outline the
geographic scope by locating its top-level IP address registry (i.e., ARIN, RIPE, APNIC, etc). Based on [1], for each recorded /8 IP address block, we randomly pick several recorded IP addresses and query WHOIS databases to get their top-level address registries. If the results are consistent, the registry is assigned to that block; Otherwise we mark the registry of the block “MISC”. We sum up the IP addresses in each block and group all blocks together according to their registries. ARIN 336879 (63.8%)
RIPE 89136 (16.9%)
APNIC 54327 (10.3%)
LACNIC 14663 (2.8%)
MISC 33246 (6.3%)
Table 2. IP addresses in top-level registries
The emphasis of this classification is not for precisely identifying the top registry for each IP address, but for grabbing a rough overview of the geographic distribution of the
clients. Table 23 shows that around 63.8% IP addresses are in North America.
4 Analysis of Client Dynamics One noticeable feature of high-profile Web servers such as MSNBC is high dynamics of their clients. Intuitively, we conjecture that remote clients for low-profile Web servers may have much less dynamics. In this section, we detail the analysis of the dynamics of remote clients with the resolution of IP address for low-profile Web servers. Due to widely-used NAT boxes and DHCP, the one-toone mapping between an Internet host and an IP address does not hold any more. However, IP address information is still fundamental to conduct various network management tasks. Profiling the dynamics of client IP address is essential for system administrators to operate Web servers properly under the circumstances of heavy workloads or malicious attacks.
4.1
Terminology and Notation
For ease of presentation, we first define a few terms as follows. • IP cluster: an IP cluster is a group of IP addresses that share the same 24-bit prefix, and we label those IP clusters as “CLU”. • Clustered requests: clustered requests refer to those requests from the same IP cluster, and they are labeled as “CLU-REQ”. • Frequently-visiting (FV) IP address: an IP address is called a frequently-visiting IP address if the number of requests from it is equal to or greater than a given threshold during a period of time (one week). Frequently-visiting IP addresses are labeled as “IP-FVn” and the requests originated from them are labeled as “REQ-FV-n”, where n is the threshold. • Frequently-visiting IP cluster: an IP cluster is called a frequently-visiting IP cluster if the number of requests from it is equal to or greater than a given threshold during a period of time. Frequently-visiting IP clusters are labeled as “CLU-FV-n” and the requests originated from them are labeled as “CLU-REQ-FVn”, where n is the threshold. 3 The sum of all numbers in the table is less than the sum of unique IP addresses in table 2 due to the overlap among different servers. The sum of percentages is not exactly 100 due to number rounding.
4.2
Dynamics of Client IP Addresses
Based on weekly traces, we build an IP address pool for each monitored Web server in an accumulative way. The pool holds all IP addresses seen in the previous weeks. Thus, its size grows week-by-week with incorporation of newly-collected traces. Given a certain IP address pool, one key metric of this measurement study is the ratio of “new” (or “old”) IP addresses within the current weekly trace. The “new” IP addresses here refer to those that have never appeared before. The “old” are those IP addresses that are already in the address pool. With the weekly growth of address pools, Figure 3 shows the dynamics of the ratio of new IP addresses in weekly traces for the chosen six Web servers, respectively. As we have stated before, the other four Web servers have similar results as their intra-group peers. Contrary to our intuition, all curves with label “IP” (i.e., 32-bit IP address) in Figure 3 hardly converge over time. Even in the 32nd week, more than half of IP addresses are still “new”. In addition to the occasional come-and-go clients, we attribute this observation to the wide usage of DHCP in ISPs and wireless access environments. Considering two categories of clients—frequentlyvisiting clients and come-and-go clients, we divide the IP addresses in one weekly trace into two groups based on their request numbers. The IP addresses with request numbers equal to or greater than a given threshold belong to group “FV”, otherwise they belong to group “INFV”. Then, we calculate the ratio of new IP addresses in the group FV and draw their dynamics in Figure 3 with label “IP-FV-n”, where n is the threshold. Note that the same IP address pool is used. In comparison with those for all IP addresses, the ratio curves for frequently-visiting IP addresses converge much faster within the first six weeks. While fluctuating at the rest of weeks, the ratios of “new” IP addresses in FV group are significantly decreased. For example, for the curves with label “IP-FV-20”, their ratios of new addresses drop below 0.3 after only five weeks. It can also be observed that the FV ratio curves for Math and CC fluctuate much stronger than others, which is understandable given their much smaller bases of frequently-visiting clients. The “IP-n” rows in Table 3 show the average ratios between the frequentlyvisiting IP addresses and all IP addresses in 32 weekly traces for six chosen Web servers, respectively. The small ratios manifest that the majority of clients for these lowprofile Web servers are occasional come-and-go clients. As DHCP is widely used by ISPs to dynamically assign IP addresses to residential and mobile clients, the same client may use different IP addresses at different time. We use the simple clustering by 24-bit IP prefix to reduce such DHCP effect. Each IP cluster is identified by its unique 24-
CS
BS
1
1 IP IP−FV−5 IP−FV−20
0.9
0.8
0.7
0.7
0.5 0.4 0.3
Ratio of New to All
0.8
0.7 0.6
0.6 0.5 0.4 0.3
0.6 0.5 0.4 0.3
0.2
0.2
0.2
0.1
0.1
0.1
0 1
4
8
12
16 Week
20
24
28
0 1
32
4
8
12
Math
16 Week
20
24
28
0 1
32
1
0.7
0.5 0.4 0.3
0.6 0.5 0.4 0.3
0.2
0.2
0.1
0.1 16 Week
20
24
28
0 1
32
Ratio of New to All
0.8
0.7
Ratio of New to All
0.8
0.6
16 Week
20
24
28
32
IP IP−FV−5 IP−FV−20
0.9
0.7
12
12
1 IP IP−FV−5 IP−FV−20
0.9
0.8
8
8
CC
1 IP IP−FV−5 IP−FV−20
4
4
SIN
0.9
0 1
IP IP−FV−5 IP−FV−20
0.9
0.8 Ratio of New to All
Ratio of New to All
0.9
Ratio of New to All
Swem
1 IP IP−FV−5 IP−FV−20
0.6 0.5 0.4 0.3 0.2 0.1
4
8
12
16 Week
20
24
28
0 1
32
4
8
12
16 Week
20
24
28
32
Figure 3. The ratio of new FV IP addresses to all FV IP addresses in weekly traces CS
BS
1
1 CLU CLU−FV−5 CLU−FV−20
0.9
0.8
0.7
0.7
0.5 0.4 0.3
0.6 0.5 0.4 0.3
0.2
0.2
0.1
0.1
0 1
4
8
12
16 Week
20
24
28
0 1
32
Ratio of New to All
0.8
0.7 0.6
0.6 0.5 0.4 0.3 0.2 0.1
4
8
12
Math
16 Week
20
24
28
0 1
32
0.9
0.9
0.7
0.5 0.4 0.3
Ratio of New to All
0.8
0.7
Ratio of New to All
0.8
0.6
0.6 0.5 0.4 0.3
0.2 0.1
28
32
32
4
8
12
16 Week
20
24
28
CLU CLU−FV−5 CLU−FV−20
0.3
0.1 24
28
0.4
0.1 20
24
0.5
0.2
16 Week
20
0.6
0.2
0 1
16 Week
0.9
0.7
12
12
1 CLU CLU−FV−5 CLU−FV−20
0.8
8
8
CC
1 CLU CLU−FV−5 CLU−FV−20
4
4
SIN
1
0 1
CLU CLU−FV−5 CLU−FV−20
0.9
0.8 Ratio of New to All
Ratio of New to All
0.9
Ratio of New to All
Swem
1 CLU CLU−FV−5 CLU−FV−20
32
0 1
4
8
12
16 Week
Figure 4. The ratio of new FV IP clusters to all FV IP clusters in weekly traces
20
24
28
32
IP-5 IP-10 IP-20 CLU-5 CLU-10 CLU-20
CS 0.17 0.09 0.05 0.16 0.08 0.05
BS 0.27 0.15 0.08 0.27 0.15 0.09
Swem 0.24 0.19 0.07 0.22 0.12 0.07
Math 0.15 0.08 0.05 0.15 0.08 0.06
SIN 0.42 0.24 0.12 0.44 0.29 0.17
CC 0.18 0.09 0.05 0.19 0.09 0.06
REQ-5 REQ-10 REQ-20 REQ-CLU-5 REQ-CLU-10 REQ-CLU-20
CS 0.67 0.55 0.45 0.72 0.63 0.55
BS 0.76 0.63 0.48 0.82 0.72 0.61
Swem 0.73 0.59 0.47 0.81 0.73 0.66
Math 0.61 0.48 0.38 0.69 0.59 0.52
SIN 0.87 0.74 0.58 0.93 0.86 0.77
CC 0.69 0.57 0.41 0.75 0.66 0.59
Table 3. The average ratios of frequentlyvisiting clients to all clients in weekly traces
Table 4. The average ratios of requests from FV clients to all requests in weekly traces
bit prefix of IP address. The curves with label “CLU” in Figure 4 show the weekly dynamics of the ratio of “new” IP clusters, and the curves with label “CLU-FV-n” display the weekly dynamics of the ratio of “new” IP clusters in frequently-visiting IP clusters for six chosen Web servers, respectively. Those curves have similar shapes and trends to, but smaller values than those curves in Figure 3. This further confirms that the pool of overall IP clients doesn’t converge over time. However, the pool of frequently-visiting IP clients has a much faster convergence speed at first several weeks, while fluctuating at bottom ranges later on. The “CLU-n” rows in Table 3 show the average ratios between the frequently-visiting IP clusters and all IP clusters in 32 weekly traces, respectively. The values only slightly differ from their corresponding ones in “IP-n ” rows. Although the clustering-by-first-24-bit method is rather simple and inaccurate on client clustering compared with [11], it is already sufficient to capture the essence of client dynamics in this measurement study.
IP clients in the frequently-visiting group using 32 weekly traces. Figure 5 and 6 show the dynamics of such percentages for IP-FV and CLU-FV for six chosen Web servers, respectively. Compared with the corresponding curves for IP addresses in previous figures, the curves for requests have smaller values and less fluctuation except for CC, implying that the average number of requests per “old” IP client is higher than that per “new” IP client. Especially, the curves for clustered requests converge quickly and remain fairly stable at bottom ranges.
4.3
Dynamics of Client Requests
Table 3 shows that frequently-visiting IP clients only take a small portion (under 20% for “FV-20”) of IP clients. However, these frequently-visiting IP clients generate the majority of requests. Table 4 presents the average ratios between the requests from frequently-visiting clients and all requests in 32 weekly traces for six chosen Web servers, respectively. More than 50% of all requests are from “FV10” IP clients. Although less than 10% of IP clients (except SIN Web server) issue at least 20 requests per week, the number of requests generated by those “FV-20” IP clients are greater than 40% of all requests. Among the dominant requests from frequently-visiting IP clients, we are interested in how many requests are from “new” IP clients and how many are from “old” IP clients. Then, the percentage of requests from “new” IP clients in the total workload generated by frequently-visiting clients can further reveal the inherent client dynamics. We compute the percentage of requests issued by “new”
4.4
Client Comparisons Among Different Web Servers
Intuitively, due to their specific and limited Web contents, different low-profile Web servers may have different client groups. The less similar two Web servers are in terms of contents and location, the less common clients they may attract. We find that this intuition is valid for the ten Web servers we monitored. For each Web server, we first sort client IP addresses descendantly based on their request numbers in all 32 weeks. Then, we compare the top1000 frequently-visiting IP addresses pairwisely among all ten Web servers. It turns out that the largest overlap of common clients happens between BS and Swem, which is 348 out of 1000. After further analyzing the results, we observe the omni-presence of Web crawlers (or search engines) in all traces. Many Web crawlers can be easily recognized by their DNS names, which include identifiable words such as “crawler”, “bot”, “search”, etc. Thus, we can determine if an IP address is used by a Web crawler by examining its DNS name. Of course, certain Web crawlers, which have no DNS names or use non-identifiable names, will be missed by this method. In general, for the total 32-week traces of all Web servers, Web crawlers appear 51 times in top-100 IP addresses. For BS and Swem, on average Web crawlers take 13 and 43 seats in their top-100 frequently-visiting addresses, respectively. Being a university library and sharing many on-line resources with the public, it may explain why Swem attracts a much higher percentage of Web crawlers’
CS
BS
100
100 REQ REQ−FV−5 REQ−FV−20
90
70 60 50 40 30 20 10
80 70 60 50 40 30 20 10
4
8
12
16 Week
20
24
28
0 1
32
4
8
12
20
24
28
70 60 50 40 30 20 10
40 30 20
4
8
12
20
24
28
32
20
24
28
32
REQ REQ−FV−5 REQ−FV−20
90
80 70 60 50 40 30 20
0 1
16 Week
100 REQ REQ−FV−5 REQ−FV−20
10 16 Week
50
0 1
32
Percentage of New Requests
80
12
60
CC
90 Percentage of New Requests
Percentage of New Requests
16 Week
100 REQ REQ−FV−5 REQ−FV−20
90
8
70
SIN
100
4
80
10
Math
0 1
REQ REQ−FV−5 REQ−FV−20
90 Percentage of New Requests
80
Percentage of New Requests
Percentage of New Requests
90
0 1
Swem
100 REQ REQ−FV−5 REQ−FV−20
80 70 60 50 40 30 20 10
4
8
12
16 Week
20
24
28
0 1
32
4
8
12
16 Week
20
24
28
32
Figure 5. The percentage of requests from new IP addresses in all FV IP addresses in weekly traces CS
BS
100
100 CLU−REQ CLU−REQ−FV−5 CLU−REQ−FV−20
90
70 60 50 40 30 20 10
80 70 60 50 40 30 20 10
4
8
12
16 Week
20
24
28
0 1
32
8
12
20
24
28
60 50 40 30 20 10
40 30 20
4
8
12
20
24
28
32
20
24
28
32
CLU−REQ CLU−REQ−FV−5 CLU−REQ−FV−20
90
80 70 60 50 40 30 20
0 1
16 Week CC
10 16 Week
50
100
Percentage of New Requests
Percentage of New Requests
70
12
60
0 1
32
CLU−REQ CLU−REQ−FV−5 CLU−REQ−FV−20
90
80
8
70
SIN
90 Percentage of New Requests
16 Week
100 CLU−REQ CLU−REQ−FV−5 CLU−REQ−FV−20
4
80
10 4
Math 100
0 1
CLU−REQ CLU−REQ−FV−5 CLU−REQ−FV−20
90 Percentage of New Requests
80
Percentage of New Requests
Percentage of New Requests
90
0 1
Swem
100 CLU−REQ CLU−REQ−FV−5 CLU−REQ−FV−20
80 70 60 50 40 30 20 10
4
8
12
16 Week
20
24
28
32
0 1
4
8
12
16 Week
20
24
28
Figure 6. The percentage of requests from new IP clusters in all FV IP clusters in weekly traces
32
CS vs. Others
Swem vs. Others 50
Percentage of Overlap
Percentage of Overlap
50
40
30
20
10
0
40
30
20
10
Math Phy CC Chem AS Swem IT
SIN BS
0
CS Math Phy CC Chem AS
IT
SIN BS
Figure 7. The overlap of top-1000 FV addresses between CS/Swem and other Web servers hits than BS. We are more interested in the comparisons between groups of frequently-visiting normal clients, i.e., the clients excluding Web crawlers. The implication of this differentiation will be discussed in Section 5. After removing Web crawlers, we conduct the pairwise comparisons again using 32-week long traces to figure out the overlaps of top-1000 frequently-visiting IP addresses among ten servers. Table 5 shows the percentages of overlap for all ten monitored Web servers. The table clearly demonstrates the uniqueness of frequently-visiting clients for each server. It is interesting to notice that the three highest overlap percentages (right-bottom in Table 5 with rectangle) all occur between non-academic Web servers. They are SIN for student information Web server, Swem for library Web server, and IT for information technology Web server. The high overlap percentages between these Web servers may be attributed to their common characteristics of being a public facility to all academic departments and having the same Web portal. It is also observable that the BS Web server presents a much higher overlap percentage with those non-academic Web servers than any other academic departmental Web servers. The plausible reasons are (1) BS Web server is the only one for a non-science department among all academic Web servers; (2) unlike science departments, business school does not have its individual library; (3) more proxy (including NAT) clients are found in BS and three non-academic Web servers’ traces. Figure 7 shows the percentages of overlap of top-1000 clients for CS (left) and Swem (right) Web servers, respectively. Here we choose CS Web server, instead of BS, due to its stronger academic connectivity with other science departments, and choose Swem Web server due to its highest overlap with other departmental Web servers.
Overall, the overlaps among different Web servers are quite small, although they reside in the same campus network. Therefore, being analogous to human fingerprint which is stable and unique for every individual, we call the IP addresses of these loyal (i.e., “frequently-visiting and old”) clients of a Web server the IP fingerprint of that server. Although IP fingerprint is derived from the analysis of client accesses to ten departmental Web servers located in the same campus network, we believe that its existence may prevail on many low-profile Web servers.
5 Discussion In the previous section, we have manifested the existence of IP fingerprint for a low-profile Web server. Now we discuss the potential applications of IP fingerprint. First, the characteristic of stability naturally associates IP fingerprint with Web server QoS and protection. In essence, IP fingerprint is a network-layer profile of Web requests. Thus, it can be directly applied to service differentiation, admission control, or overload protection at Web servers. The clients in the IP fingerprint of a server may be assigned higher priorities in request scheduling when the server is heavily loaded so as to ensure acceptable response time for those loyal customers. Compared with other schemes to achieve service differentiation and admission control, IP fingerprint is much light-weighted, favors human clients, and is totally complementary to other schemes. IP fingerprint can also be used in application-layer QoS to augment the capability of service differentiation based on the profile of Web content requests. Second, IP fingerprint can assist in anomaly detection. On one hand, the stability of IP fingerprint implies that after a relatively long period of time, the most frequently-visiting
CS Phy Math AS Chem CC BS Swem IT SIN
CS * 10.2 19.3 15.6 7.7 12.4 11.8 14.6 8.8 10.8
Phy 10.2 * 11 9.8 5.7 7 5.7 10.8 4.4 5
Math 19.3 11 * 17.5 7.1 8.5 12.2 17.9 9 12.1
AS 15.6 9.8 17.5 * 8.9 10.6 15.4 15.9 11 12.7
Chem 7.7 5.7 7.1 8.9 * 5.8 6.1 8.4 4.9 5.6
CC 12.4 7 8.5 10.6 5.8 * 7.3 7.5 5 4.3
BS 11.8 5.7 12.2 15.4 6.1 7.3 * 23.3 19.2 22.4
Swem 14.6 10.8 17.9 15.9 8.4 7.5 23.3 * 28.2 27.8
IT 8.8 4.4 9 11 4.9 5 19.2 28.2 * 27.1
SIN 10.8 5 12.1 12.7 5.6 4.3 22.4 27.8 27.1 *
Table 5. Percentage of overlap in top-1000 frequently-visiting IP addresses among ten Web Servers
clients are quite stable. So, the dramatic change of most frequently-visiting clients may indicate the occurrence of request anomaly on the Web server. On the other hand, the uniqueness of IP fingerprint helps Web server farm to detect request anomaly as well. Nowadays, many low-profile Web servers are hosted on the same machine or cluster, which is called the server farm. Based on the uniqueness of IP fingerprint, a server farm may implement a coarse-grained anomaly detection mechanism on its gateway or network perimeter firewall which can monitor the change of IP fingerprint of hosted Web servers and alert system administrators when two servers with very different IP fingerprints suddenly share a large portion of frequently-visiting clients. Of course, this detection method can also be applied to a customer network which hosts different low-profile Web servers, such as campus and enterprise networks.
6 Related Work Substantial research efforts have been paid to Web server workload characterization and their implications to caching systems and Web server performance. Across six Web servers from three different environments, [5] observed the ten invariants in Web server workloads. In [4], the authors analyzed the workload of 1998 World Cup Web site with the conclusion that Web caching systems need a better consistency mechanism. In [9], the authors studied the workload of 1998 Olympic Games Web site and developed a general methodology based on time-series analysis to characterize the access patterns of Web server requests. In [13], the authors presented an intensive analysis of the content and access dynamics of MSNBC news site and discussed their implication to Web caching, Web prefetching, or server-side “push”. In [7], the paper distinguishes itself from previous characterization work by having comprehensive analysis of Web server workloads across a large number of Web sites and simulation of CDN benefits for most Web sites. In [3], a 17 month traffic measurement at a Web server
has been conducted, with the focus on the network path properties and the implementation status of various protocol options and mechanisms at the client side. Many other studies analyzed Web accesses from a client-centric point of view such as [6, 15]. The purpose of their studies on client behavior is to improve the performance of Web caching proxies. Based on BGP routing table information, a “network-aware” client clustering method [11] has been proposed to provide support for effective content delivery and proxy positioning. In [8], the authors proposed a transparent admission control and request scheduling method for multi-tier ECommerce Web sites. It externally observes execution costs of requests, performs overload protection and preferential scheduling. In [10], the authors studied two types of events, namely flash crowds and Denial of Service (DoS) attacks that may overload Web servers. Through trace analysis, they revealed the characteristics that can distinguish the two events and proposed a protection technique based on CDN simulation.
7 Conclusion This paper presents the measurement study on characterizing client dynamics for low-profile Web servers. We have collected and analyzed 32-week long traces that record remote accesses to ten departmental Web servers in a middlesized campus network. Based on the trace analysis, we have observed that for any monitored Web server, without differentiating the client’s access frequency, its client pool hardly converges to a stable set. This is mainly due to the large number of occasional come-and-go clients. However, the pool of frequently-visiting clients exhibits much quicker convergence in the beginning and fluctuates at bottom ranges later on. A simple IP address clustering technique is used to counter the DHCP effect on the dynamics of clients. The IP cluster results not only conform to the observations found at the IP address level, but also suggest
that IP fingerprint, if exists, be more distinctive and stable at the IP cluster level. In spite of a small portion of total clients, the frequently-visiting clients dominate in issuing requests. Moreover, the loyal (i.e., “frequently-visiting and old”) clients dominate in frequently-visiting clients, with respect to both numbers and requests. Finally, we compare the group of loyal clients excluding Web crawlers of one Web server with those of other servers and find that the overlaps are relatively small. We argue that the IP addresses (clusters) of these loyal clients of one low-profile Web server constitute its IP fingerprint.
8 Acknowledgments We would like to thank IT department at the College of William and Mary for assistance with data collection.
References [1] Internet protocol v4 address space. http://www.iana. org/assignments/ipv4-address-space. [2] T. Abdelzaher, K. G. Shin, and N. Bhatti. Performance guarantees for web server end-systems: A control-theoretical approach. IEEE Transactions on Parallel and Distributed Systems, 13(1), January 2002. [3] M. Allman. A web server’s view of the transport layer. ACM Computer Communication Review, 30(5), October 2000. [4] M. Arlitt and T. Jin. Workload characterization of the 1998 world cup web site. Technical Report HPL-1999-35R1, 1999. [5] M. F. Arlitt and C. L. Williamson. Internet web servers: workload characterization and performance implications. IEEE/ACM Transactions on Networking, 5(5), October 1997. [6] P. Barford, A. Bestavros, A. Bradley, and M. Crovella. Changes in web client access patterns: Characteristics and caching implications. World Wide Web, Special Issue on Characterization and Performance Evaluation, 2(1), 1999. [7] L. Bent, M. Rabinovich, G. M. Voelker, and Z. Xiao. Characterization of a large web site population with implications for content delivery. In Proc. of the 13th International World Wide Web Conference, 2004. [8] S. Elnikety, E. Nahum, J. Tracey, and W. Zwaenepoel. A method for transparent admission control and request scheduling in e-commerce web sites. In Proc. of the 13th International World Wide Web Conference, 2004. [9] A. Iyengar, M. S. Squillante, and L. Zhang. Analysis and characterization of large-scale web server access patterns and performance. World Wide Web, 2(1-2), June 1999. [10] J. Jung, B. Krishnamurthy, and M. Rabinovich. Flash crowds and denial of service attacks: Characterization and implications for cdns and web sites. In Proc. of the 11th International World Wide Web Conference, May 2002. [11] B. Krishnamurthy and J. Wang. On network-aware clustering of web clients. In Proc. of ACM SIGCOMM 2000, August 2000.
[12] B. Krishnamurthy and C. Wills. Improving web performance by client characterization driven server adaptation. In Proc. of the 11th International World Wide Web Conference, May 2002. [13] V. N. Padmanabhan and L. Qiu. The content and access dynamics of a busy web site: findings and implicatins. In Proc. of ACM SIGCOMM 2000, August 2000. [14] K. Thompson, G. J. Miller, and R. Wilder. Wide-area internet traffic patterns and characteristics. IEEE Network, 11(6), November/December 1997. [15] A. Wolman, G. M. Voelker, N. Sharma, N. Cardwell, A. R. Karlin, and H. M. Levy. On the scale and performance of cooperative web proxy caching. In Proc. of ACM SOSP, 1999.


![TCP/IP Illustrated - Computer Science [PDF]](https://m.moam.info/img/260x300/tcp-ip-illustrated-computer-science-pdf_64e325c6098a9eb4368b4608.jpg)


![Guidelines on Securing Public Web Servers - NIST Computer Security ... [PDF]](https://m.moam.info/img/260x300/guidelines-on-securing-public-web-servers-nist-com_647db14d098a9e653e8b456e.jpg)


