Geosci. Model Dev., 5, 257–268, 2012 www.geosci-model-dev.net/5/257/2012/ doi:10.5194/gmd-5-257-2012 © Author(s) 2012. CC Attribution 3.0 License.
Geoscientific Model Development
Identifying the causes of differences in ozone production from the CB05 and CBMIV chemical mechanisms R. D. Saylor1 and A. F. Stein2,* 1 National
Oceanic and Atmospheric Administration, Air Resources Laboratory, Atmospheric Turbulence and Diffusion Division, Oak Ridge, TN, USA 2 Earth Resources Technology, Inc., Laurel, MD, USA * on assignment to: National Oceanic and Atmospheric Administration, Air Resources Laboratory, Silver Spring, MD, USA Correspondence to: R. D. Saylor (
[email protected]) Received: 30 August 2011 – Published in Geosci. Model Dev. Discuss.: 19 October 2011 Revised: 19 January 2012 – Accepted: 27 January 2012 – Published: 21 February 2012
Abstract. An investigation was conducted to identify the mechanistic differences between two versions of the carbon bond gas-phase chemical mechanism (CB05 and CBMIV) which consistently lead to larger ground-level ozone concentrations being produced in the CB05 version of the National Air Quality Forecasting Capability (NAQFC) modeling system even though the two parallel forecast systems utilize the same meteorology and base emissions and similar initial and boundary conditions. Box models of each of the mechanisms as they are implemented in the NAQFC were created and a set of 12 sensitivity simulations was designed. The sensitivity simulations independently probed the conceptual mechanistic differences between CB05 and CBMIV and were exercised over a 45-scenario simulation suite designed to emulate the wide range of chemical regimes encountered in a continental-scale atmospheric chemistry model. Results of the sensitivity simulations indicate that two sets of reactions that were included in the CB05 mechanism, but which were absent from the CBMIV mechanism, are the primary causes of the greater ozone production in the CB05 version of the NAQFC. One set of reactions recycles the higher organic peroxide species of CB05 (ROOH), resulting in additional photochemically reactive products that act to produce additional ozone in some chemical regimes. The other set of reactions recycles reactive nitrogen from less reactive forms back to NO2 , increasing the effective NOx concentration of the system. In particular, the organic nitrate species (NTR), which was a terminal product for reactive nitrogen in the CBMIV mechanism, acts as a reservoir species in CB05 to redistribute NOx from major source areas to potentially NOx sensitive areas where additional ozone may be produced in areas remote from direct NOx sources.
1
Introduction
The NOAA National Air Quality Forecasting Capability (NAQFC) is a modeling system established in 2004 to provide ground-level ozone (O3 ) forecasts for the conterminous US (CONUS) (Eder et al., 2009). The NAQFC utilizes the North American Mesoscale (NAM) meteorological model run of the Nonhydrostatic Mesoscale Model (NMM) core of the Weather Research and Forecasting (WRF) system (WRF-NMM) (Janjic, 2003) to provide meteorological fields to drive the US Environmental Protection Agency’s (EPA) Community Multiscale Air Quality (CMAQ) version 4.6 modeling system (Byun and Schere, 2006) which generates 48-h forecast fields of ground-layer O3 . The CMAQ portion of the NAQFC system uses 12 km horizontal grid spacing and 22 vertical layers from the surface to 100 hPa. Emission inputs use the latest available EPA National Emissions Inventory with electric generating units (EGUs) updated with Continuous Emission Monitoring (CEM) data and projections to the current forecast year using data from the Department of Energy’s Annual Energy Outlook. Further details of the operational NAQFC implementation and evaluations of its performance can be obtained from Eder et al. (2009), Otte et al. (2005), and Yu et al. (2010). Since its inception, the operational version of the NAQFC has used a modified implementation of the Carbon Bond Mechanism version IV (CBMIV, Gery et al., 1989) as its gasphase chemical mechanism. An experimental version of the NAQFC has been run in parallel with the operational track to provide a testbed for planned upgrades to the operational system. Since 2008, the experimental NAQFC has employed the updated 2005 version of the Carbon Bond Mechanism (CB05, Yarwood et al., 2005) as its gas-phase mechanism. The two parallel NAQFC tracks use identical emissions base
Published by Copernicus Publications on behalf of the European Geosciences Union.
258
1 R. D. Saylor and A. F. Stein: Identifying the causes of differences in ozone production
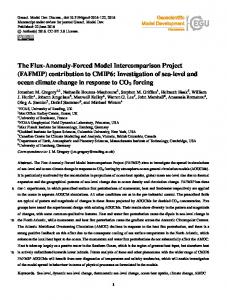
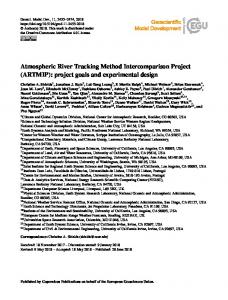
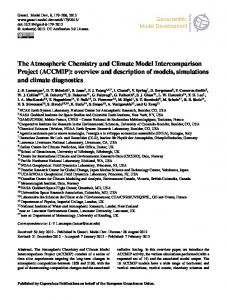
inventories (with volatile organic carbon compounds speciated appropriately for each mechanism), identical meteorological fields from NAM, and similar initial and boundary conditions. Figure 1 presents a comparison of domainwide daily average O3 biases for 2009 from the two parallel NAQFC systems as compared to US Environmental Protection Agency Air Quality System (AQS) measurements (http://www.epa.gov/ttn/airs/airsaqs/). Both versions of the NAQFC exhibit similar biases throughout the year, climbing from near zero in April to a peak positive bias (i.e., model – measurement) in September. The inherent, similar biases of both NAQFC versions are likely due to a variety of factors, possibly involving anthropogenic or biogenic emissions uncertainties, meteorological input biases, dry or wet deposition processes, or chemical processes common to both CB05 2 and CBMIV. However, the motivation of the work described 3 4 here is to understand the causes of the relatively consistent 5 difference between the operational and experimental NAQFC 6 7 versions, given that the emissions and input data for both sys- 8 tems are identical and that they differ only in the gas-phase10 9 chemical mechanisms employed. Since the input data to both11 the CB05 and CBMIV versions of the NAQFC are essentially12 13 the same, it is somewhat surprising that the CB05 version14 consistently produces higher O3 surface concentrations. The15 16 purpose of the work reported here was to identify the mecha-17 18 nistic reasons for these differences so that future work can be19 undertaken to improve the forecast performance of the CB0520 21 version of the NAQFC with respect to observations. 22 Previous investigations (Luecken et al., 1999; Sarwar et23 24 al., 2008; Luecken et al., 2008) have also observed the dif-25 ferences in O3 produced from CMAQ simulations for the two mechanisms. These studies have identified mechanistic differences that might have some potential impact on O3 production, but no overriding explanatory cause emerged. As noted in Luecken et al. (2008), O3 photochemistry is complex and in the framework of a three-dimensional model simulation, numerous temporally- and spatially-varying factors may contribute to the observed differences in O3 fields between the two mechanisms. Consequently, in this work we attempt to focus solely on mechanism differences without the confounding effects of additional model processes (e.g., advection, turbulent diffusion, wet and dry deposition, etc.) that may obscure the underlying mechanistic reasons for the observed differences in O3 concentrations. Using this approach, and recognizing that CB05 is, in some sense, a “modified” version of CBMIV, a relatively simple comparison of the mechanisms was undertaken by performing sensitivity studies with box model versions of each to identify which mechanistic differences between CB05 and CBMIV may account for the O3 differences observed in full CMAQ simulations. In subsequent sections of this paper, we describe the box model implementation of the mechanisms and the sensitivity studies that were designed to probe mechanism differences and then we present selected results from those sensitivity runs to demonstrate our findings. Geosci. Model Dev., 5, 257–268, 2012
Figure 1. Mean bias of ground-‐level ozone from parallel versions of the NAQFC. Ozone Fig. 1. Mean ofUground-level ozone from versions of measurements are fbias rom the . S. EPA Air Quality System (AQS) parallel measurement network. Operational NAQFC (red) ameasurements nd experimental Nare AQFC (black) iases (Air ppbv) calculated the NAQFC. Ozone from themean USbEPA Quality as a CONUS-‐wide average of (model – AQS) site biases. System (AQS) measurement network. Operational NAQFC (red) and experimental NAQFC (black) mean biases (ppbv) calculated as a CONUS-wide average of (model – AQS) site biases. Methods 2 2.1 Box model description A box model of the convectively well-mixed boundary layer was constructed for each mechanism, CB05 and CBMIV, us
ing a modified implementation of the Kinetic Preprocessor of Sandu and Sander (2006). It should be noted that the ver sions of CB05 and CBMIV that are used in the NAQFC have been altered from the mechanisms as they were originally published. In this paper, we are only concerned with and refer to CB05 and CBMIV as they have been implemented in the NAQFC system. The mechanism definition files as implemented in the NAQFC are provided as a Supplement to this paper. After Seinfeld and Pandis (1998), but neglecting surface removal by dry deposition and mixing with background air, the concentration of a gas-phase species in a well-mixed, constant depth boundary layer is given by dCi qi = + Ri dt H
(1)
where Ci is the concentration of species i in the boundary layer, qi is the emission rate of species i into the boundary layer, H is the boundary layer depth, and Ri is the chemical production (or destruction) rate of species i. The box model for each mechanism consists of a set of equations of the form (1) for each mechanism species. In an approach fashioned after that of Zaveri and Peters (1999), a suite of 45 box model simulation scenarios was created to exercise the mechanisms across a broad range of chemical regimes, with varying NOx www.geosci-model-dev.net/5/257/2012/
23
1
2 R. D. Saylor and A. F. Stein: Identifying the causes of differences in ozone production 3
259
Table 1. Environmental and initial conditions for each simulation scenario. Fixed Temperature Pressure Relative Humidity CO CH4
298 K 1 atm 50 % 100 ppbv 1600 ppbv
Initial O3 NOx All NMHCs
10 ppbv 0 0
(NO + NO2 ) and hydrocarbon (HC) emission rates. Environmental conditions and initial chemical concentrations were the same for all scenarios (Table 1) so that the results from each are driven primarily by the specified emission rates (Table 2). The scenarios were designed to have emission rates and HC to NOx ratios that span conditions from urban to rural environments that might be encountered in a CONUS domain simulation of a three-dimensional model. For simplicity, emission rates were constrained to vary diurnally in proportion to the cosine of the zenith angle (night = 0 and 4 5 emission rate maximum, E0 , at solar noon) for a summer, 6 mid-latitude location near ground level. Each simulation sce7 nario was run for ten days to allow the system to obtain8 a 9 quasi-stationary chemical state. 10 11 The total anthropogenic non-methane hydrocarbon emission rate of each scenario was calculated according to the NMHC:NOx ratio given in Table 2 and then apportioned among specific NMHC species in each mechanism as presented in Table 3. Care was taken to ensure that emissions rates of NMHC species were consistent for both CB05 and CBMIV versions of the box models. For species that are unchanged between the two mechanisms, the apportioning is the same in each (e.g., ETH, OLE, TOL, XYL and HCHO). In CB05, the two carbon ethane (ETHA) species was explicitly included, so PAR emissions in CB05 simulations were reduced equal to 2× the ETHA emissions as compared to the base CBMIV simulation. In CB05, the ALD2 species explicitly represents acetaldehyde and ALDX represents all other higher aldehydes; however, in CBMIV the ALD2 species alone represents acetaldehyde and other higher aldehydes. Consequently, the ALD2 emissions used in the base CBMIV simulations account for both the ALD2 and ALDX emissions included in CB05 simulations. Furthermore, emissions of the internal olefin species, IOLE, are treated as 2× ALD2 in the base CBMIV simulation (assuming 2-butene as the internal olefin). As a result, ALD2 emissions in the base CBMIV simulation are calculated as (ALD2+ALDX)CB05 + 2× (IOLE)CB05 . www.geosci-model-dev.net/5/257/2012/
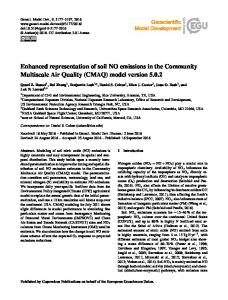
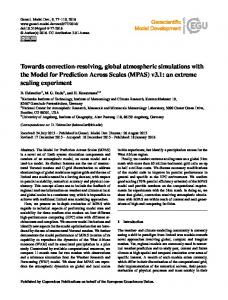
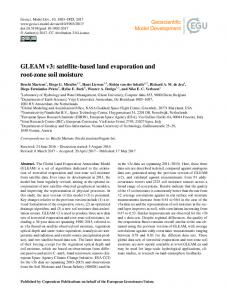
Fig. 2. Example scenario results from the simulation suite. Ozone Figure 2. Example scenario results from the simulation suite. Ozone mixing ratios (ppbv) mixing ratios (ppbv) for (the base CB05 (red) CBMIV (black) for the base CB05 (red) and CBMIV black) mechanisms over tand he 240 hr simulation period. mechanisms over the 240 h simulation period.
Figure 2 presents results from several example scenarios from the box model simulation suite, illustrating how for a given set of emissions rates, the CB05 mechanism almost invariably produces higher O3 values by the end of the 10day simulation period. The behavior illustrated here from the box model versions of CBMIV and CB05 is consistent with the behavior observed from the parallel versions of the NAQFC system. 2.2
Sensitivity tests
Beyond routine updates of reaction rate coefficients, the mechanistic differences between CB05 and CBMIV are extensive but can be summarized briefly into 11 conceptual groups: (1) addition of molecular hydrogen reactions to improve odd-hydrogen chemistry in the upper troposphere; (2) addition of reactions involving odd-oxygen and oddhydrogen to provide a more complete description of hydroxyl radical (OH) chemistry; (3) addition of nitrate radical (NO3 ) reactions to improve the representation of nocturnal chemistry in the boundary layer; (4) addition of inorganic NOx recycling reactions that slowly recycle HNO3 , HO2 NO2 , and N2 O5 back into NO2 ; (5) addition of reactions Geosci. Model Dev., 5, 257–268, 2012
24
260
R. D. Saylor and A. F. Stein: Identifying the causes of differences in ozone production
Table 2. Scenario Maximum Emission Rates (E0 ) for the Box Model Simulation Suite (hourly emission rate = E0 × cos(θz ); θz = zenith angle). Scenario
NOx (µmol m−2 h−1 )
RNMHC (mol NMHC/mol NOx )
ISOP (µmol m−2 h−1 )
TERP (µmol m−2 h−1 )
5 20 40 5 20 40 5 20 40 1 5 10 1 5 10 1 5 10 1 5 10 1 5 10 1 5 10 5 20 40 5 20 40 5 20 40 1 5 10 1 5 10 1 5 10
1 1 1 10 10 10 100 100 100 0.1 0.1 0.1 1 1 1 10 10 10 0.1 0.1 0.1 1 1 1 10 10 10 1 1 1 10 10 10 100 100 100 0.1 0.1 0.1 1 1 1 10 10 10
0 0 0 0 0 0 0 0 0 50 50 50 50 50 50 50 50 50 50 50 50 50 50 50 50 50 50 0 0 0 0 0 0 0 0 0 0 0 0 0 0 0 0 0 0
0 0 0 0 0 0 0 0 0 0 0 0 0 0 0 0 0 0 10 10 10 10 10 10 10 10 10 1 1 1 1 1 1 1 1 1 1 1 1 1 1 1 1 1 1
s01 s02 s03 s04 s05 s06 s07 s08 s09 s10 s11 s12 s13 s14 s15 s16 s17 s18 s19 s20 s21 s22 s23 s24 s25 s26 s27 s28 s29 s30 s31 s32 s33 s34 s35 s36 s37 s38 s39 s40 s41 s42 s43 s44 s45
that recycle the lumped organic nitrate species (NTR) back to HNO3 and NO2 ; (6) substitution of explicit chemistry for methane (CH4 ) oxidation and the introduction of the methylperoxy radical (CH3 O2 ) instead of the highly parameterized representation in CBMIV; (7) addition of a reaction
Geosci. Model Dev., 5, 257–268, 2012
for OH oxidation of ethane (ETHA) rather than lumping with the PAR species; (8) introduction of a new higher aldehyde species that separates the lumped CBMIV aldehyde species into acetaldehyde (ALD2) and the higher aldehyde (ALDX) and introduces related species such as peroxyacyl radicals
www.geosci-model-dev.net/5/257/2012/
R. D. Saylor and A. F. Stein: Identifying the causes of differences in ozone production Table 3. Nonmethane Hydrocarbon (NMHC) species apportionment. CBMIV
mol mol−1 NMHC
PAR
0.860
ETH OLE
0.050 0.005
TOL XYL HCHO ALD2
0.030 0.020 0.010 0.030
CB05 PAR ETHA ETH OLE IOLE TOL XYL HCHO ALD2 ALDX
OH + O OH + OH OH + OH OH + HO2 HO2 + O H2 O2 + O
xH2
Two reactions were added to the CB05 mechanism that do not appear in CBMIV to account for molecular hydrogen reactions (all reaction numbers refer to the mechanisms as implemented in the NAQFC as provided in the Supplement) O(1 D) + H2 (+O2 ) → OH + HO2 OH + H2 → HO2
(R38) (R39)
For sensitivity test xH2, these reactions were removed from CB05, leaving all other reactions as in the base CB05 www.geosci-model-dev.net/5/257/2012/
xoddH&O
Six reactions were included in the CB05 mechanism which do not appear in CBMIV in order to better represent oddoxygen and odd-hydrogen chemistry
0.845 0.0075 0.050 0.005 0.005 0.030 0.020 0.010 0.015 0.005
(CXO3), peroxynitrates (PANX), carboxylic acids (AACD) and peroxycarboxylic acids (PACD); (9) separation of the CBMIV alkene species into a lumped internal olefin (IOLE) and other olefins (OLE); (10) addition of higher organic peroxides (ROOH) were added to improve the overall representation of peroxide species which are important in aqueous sulfate production; and (11) addition of a new species (TERP) to represent terpene chemistry more explicitly. The full CB05 mechanism represents the combined impact of these 11 mechanistic updates. Based upon these groups, 12 sensitivity simulations, described in the following sections, were designed to probe the impact of individual differences on overall O3 production between the CB05 and CBMIV mechanisms. Each sensitivity test was designed to probe how (or if) each particular mechanistic update of CBMIV impacted O3 concentrations over the wide range of chemical regimes typically encountered in a regional-tocontinental scale simulation. As described below, each sensitivity test attempts to return one of the mechanistic updates to its previous representation in CBMIV. By then comparing O3 concentrations from the base CB05, the base CBMIV, and the sensitivity test (i.e., the CB05 mechanism with one particular update rolled back to its CBMIV representation) for each scenario in the simulation suite, we obtain an indication of which particular mechanism change or changes may account for the observed larger O3 produced by CB05. 2.2.1
mechanism. No emissions changes were made in the scenario suite. 2.2.2
mol mol−1 NMHC
261
→ → → → → →
HO2 O + H2 O H2 O2 H2 O + O2 OH + O2 OH + HO2
(R40) (R41) (R42) (R43) (R44) (R45)
For sensitivity test xoddH&O, these reactions were removed from CB05, leaving all other reactions as in the base CB05 mechanism. No emissions changes were made to the scenario suite. 2.2.3
xNO3night
Six reactions were introduced into the CB05 mechanism that are not included in CBMIV in order to better represent NO3 radical chemistry in the nocturnal boundary layer NO3 + O NO3 + OH NO3 + HO2 NO3 + O3 NO3 + NO3 NO3 + ETH
→ → → → → →
NO2 + O2 NO2 + HO2 HNO3 NO2 + 2O2 2NO2 NO2 + XO2 + 2HCHO
(R46) (R47) (R48) (R49) (R50) (R123)
For sensitivity test xNO3night, these reactions were removed from CB05, leaving all other reactions as in the base CB05 mechanism. No emissions changes were made to the scenario suite. 2.2.4
xETHA
A reaction was introduced in CB05 to account for the explicit reaction of ethane (ETHA) with OH ETHA + OH → 0.991ALD2 + 0.991XO2 +0.009XO2N + HO2
(R155)
In sensitivity test xETHA, this reaction was removed and all ETHA emissions in the scenario suite were converted to the equivalent PAR emissions as in CBMIV. 2.2.5
xALDX
In CBMIV, the ALD2 species represents acetaldehyde (CH3 CHO) and all C3 and higher aldehydes. However, in CB05, ALD2 explicitly represents only acetaldehyde while a Geosci. Model Dev., 5, 257–268, 2012
262
R. D. Saylor and A. F. Stein: Identifying the causes of differences in ozone production
new species, ALDX, is included to represent C3 and higher aldehydes. In CB05, ALDX produces C3 and higher acylperoxy radicals, CXO3, in reactions which are analogous to the explicit production of acetylperoxy, C2O3. ALD2 + NO → C2O3 + OH ALD2 + OH → C2O3 ALD2 + NO3 → C2O3 + HNO3 ALD2 + hν → MEO2 + CO + HO2
(R83) (R84) (R85) (R86)
ALDX + NO → CXO3 + OH ALDX + OH → CXO3 ALDX + NO3 → CXO3 + HNO3 ALDX + hν → MEO2 + CO + HO2
(R98) (R99) (R100) (R101)
3. PAN chemistry is converted to the CBMIV representation by removing reactions where PANX or CXO3 (C3 and higher acylperoxy radicals) are reactants (R102, R103, R104, R105, R106, R107, R108, R109, R110, and R111) and all CXO3 products are replaced by the CBMIV representation of higher acylperoxy radicals, C2O3 (R141, R143, R145, R147, and R151); and, 4. all ALDX emissions are replaced by ALD2 emissions. 2.2.6
The acylperoxy radicals may then proceed to react with NO2 to produce a C3 and higher peroxyacyl nitrate species, PANX, again in a manner analogous to the explicit acetylperoxy radical, allowing PAN to explicitly represent only peroxyacetyl nitrate. C2O3 + NO → MEO2 + NO2 C2O3 + NO2 → PAN CXO3 + NO → ALD2 + NO2 + HO2 + XO2 CXO3 + NO2 → PANX
(R87) (R88)
→ C2O3 + NO2 → C2O3 + NO2
(R89) (R90)
PANX → CXO3 + NO2 PANX + hν → CXO3 + NO2
(R104) (R105)
Additionally, PANX may react with OH radical to recycle nitrogen back to NO2 . PANX + OH → ALD2 + NO2
In CB05, the explicit chemistry of the methylperoxy radical (MEO2) was introduced CH4 + OH → MEO2 MEO2 + NO → HCHO + HO2 + NO2 MEO2 + HO2 → MEPX MEO2 + MEO2 → 1.37HCHO + 0.74HO2 + 0.63MEOH MEPX + OH → 0.7MEO2 + 0.3XO2 + 0.3HO2 MEPX + hv → HCHO + HO2 + OH MEOH + OH → HCHO + HO2
(R106)
For sensitivity test xALDX, the higher aldehyde chemistry of CB05 is converted back to the CBMIV representation, thus requiring that ALD2 represent both acetaldehyde and the C3 and higher aldehydes. This was accomplished in CB05 by the following four steps:
(R69) (R70) (R71) (R72)
C2O3 + MEO2 → 0.9MEO2 + 0.9 HO2 + HCHO + 0.1AACD
(R92)
CXO3 + MEO2 → 0.9ALD2 + 0.9XO2 + HO2 + 0.1AACD + 0.1HCHO
(R108)
to better represent remote tropospheric chemistry. In sensitivity test xexCH4, the products of the CH4 + OH Reaction (R66) are returned to the CMBIV representation, where MEO2 is replaced by HCHO + XO2 + HO2 , CH4 + OH → HCHO + XO2 + HO2 .
(R66’)
and Reactions (R66), (R67), (R68), (R69), (R70), (R71), (R72), (R92) and (R108) are removed. In additional reactions where MEO2 is a product (Reactions R86, R87, R92, R96, R97, R101, and R111), MEO2 is also replaced with HCHO + XO2 + HO2 (i.e., these reactions are returned to their CBMIV representation).
1. in reactions where ALDX is a product (R61, R62, R63, R64, R112, R113, R116, R117, R118, R119, R121, R124, R125, R126, R127, R137, R143, R144, R145, R147, R149, R150, R151, R152, R154, and R156), ALDX is replaced by ALD2, ensuring the total stoichiometric production of higher aldehydes is conserved;
2.2.7
2. reactions where ALDX is a reactant are removed (R98, R99, R100, and R101);
XO2 + HO2 → ROOH XO2N + HO2 → ROOH
Geosci. Model Dev., 5, 257–268, 2012
(R66) (R67) (R68)
(R102) (R103)
In CB05, both PAN and PANX may decompose back to the peroxy radical and NO2 via thermal or photolytic processes. PAN PAN + hν
xexCH4
xROOH
In CB05, a lumped organic peroxide species (ROOH) was introduced. It is formed as a product of each of the peroxy operator species, XO2 and XO2N, reacting with hydroperoxyl radical (HO2 ) (R56) (R57)
www.geosci-model-dev.net/5/257/2012/
R. D. Saylor and A. F. Stein: Identifying the causes of differences in ozone production In CBMIV, these two reactions produced only an inert product; however, in CB05 the ROOH species can react via ROOH + OH → XO2 + 0.5ALD2 + 0.5ALDX ROOH + hv → OH + HO2 + 0.5ALD2 + 0.5ALDX
(R63)
2.2.8
Table 4. Description of box model sensitivity tests. Name
Brief Description
xH2
Reactions involving molecular hydrogen removed
xoddH&O
Additional odd H and odd O reactions removed
xNO3night
Additional NO3 radical reactions removed
xETHA
Explicit ethane chemistry removed; ETHA emissions as PAR
xALDX
Higher aldehyde chemistry converted back to CBMIV representation; all ALDX emissions converted to ALD2
xexCH4
Explicit methane chemistry removed and replaced with CBMIV representation
xROOH
Organic peroxide destruction reactions removed
xIOLE
Internal olefin chemistry removed; all olefin emissions as OLE
xTERP
Explicit TERP chemistry removed; terpene emissions apportioned as PAR, OLE and ALD2
xiNOxrecycle
New inorganic NOx recycling reactions removed
xNTRrecycle
NTR recycling reactions removed
xallNOxrecycle
Both NTR and inorganic NOx recycling reactions removed
(R64)
to produce photochemically active products. In sensitivity test xROOH, the Reactions (R63) and (R64) were removed from CB05, leaving all other reactions as in the base CB05 mechanism. By removing these two reactions from the mechanism, Reactions (R56) and (R57) produce an inert product as in CBMIV. No emissions changes were made to the scenario suite. xIOLE
In CB05, an internal alkene species (IOLE) was introduced to better represent the chemistry of these species. IOLE + O IOLE + OH IOLE + O3
IOLE + NO3
(R124) → 1.24ALD2 + 0.66ALDX + 0.1HO2 + 0.1XO2 + 0.1CO + 0.1PAR → 1.3ALD2 + 0.7ALDX + HO2 (R125) + XO2 → 0.65ALD2 + 0.35ALDX (R126) + 0.25HCHO + 0.25CO + 0.5O + 0.5OH + 0.5HO2 → 1.18ALD2 + 0.64ALDX + HO2 + NO2 (R127)
In CBMIV, the chemistry of internal alkenes is approximated by the direct emission of the aldehyde products (as ALD2) that are formed in their oxidation reactions. In sensitivity test xIOLE, the IOLE Reactions (R124), (R125), (R126) and (R127) are removed and the oxidation reactions of the original alkene species (OLE) (Reactions R116, R117, R118, and R119) are replaced by their CBMIV versions OLE + O
OLE + OH OLE + O3
OLE + NO3
→ 0.63ALD2 + 0.38HO2 (R116’) + 0.28XO2 + 0.3CO + 0.2HCHO + 0.02XO2N + 0.22PAR + 0.2OH → HCHO + ALD2 + HO2 + XO2 − PAR (R117’) → 0.5ALD2 + 0.74HCHO (R118’) + 0.33CO + 0.1OH + 0.44HO2 + 0.22XO2 + 0.2FACD + 0.2AACD − PAR → 0.91XO2 + ALD2 + HCHO + 0.09XO2N + NO2 −PAR (R119’)
and the emissions of IOLE are replaced by emissions of 2× ALD2 (assuming that all of the IOLE represented 2-butene). www.geosci-model-dev.net/5/257/2012/
263
2.2.9
xTERP
In CB05, the TERP species was introduced to represent terpene chemistry more explicitly. Four reactions of TERP were included TERP + O TERP + OH
TERP + O3
TERP + NO3
(R149) → 0.15ALDX + 5.12PAR → 0.75HO2 + 1.25XO2 (R150) + 0.25XO2N + 0.28HCHO + 1.66PAR + 0.47ALDX → 0.57OH + 0.07HO2 + 0.76XO2 (R151) + 0.18XO2N + 0.24HCHO + 0.001CO + 7.0PAR + 0.21ALDX + 0.39CXO3 → 0.47NO2 + 0.28HO2 + 1.03XO2(R152) + 0.25XO2N + 0.47ALDX + 0.53NTR
In the sensitivity test xTERP, these reactions were removed from CB05, leaving all other reactions as in the base CB05. TERP emissions of the scenario suite were converted Geosci. Model Dev., 5, 257–268, 2012
1 2
3 4 5 6 7 8 9 10
264
R. D. Saylor and A. F. Stein: Identifying the causes of differences in ozone production
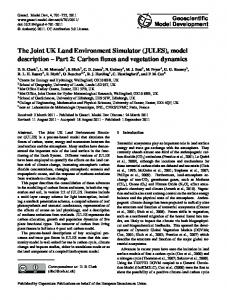
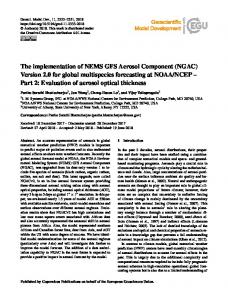
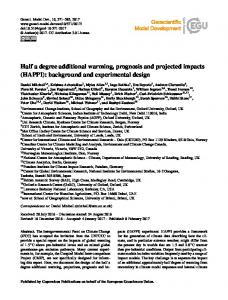
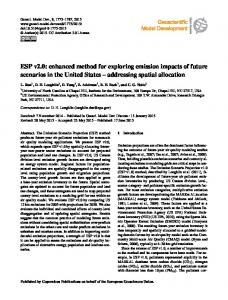
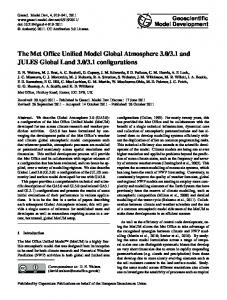
1 2 Fig. 3. Example scenario results for sensitivity test xALDX. Ozone Fig. Example scenario for sensitivity xexCH4. Ozone Figure 3. Example scenario results for sensitivity test xALDX. Ozone mixing ratios (3 ppbv) Figure 4. E4. xample scenario results fresults or sensitivity test xexCH4. test Ozone mixing ratios (ppbv) for the base CB05 (red), base Cfor BMIV nd sensitivity xALDX (violet) over 4 the 2for 40 the mixing ratios (ppbv) the(black) baseaCB05 (red),test base CBMIV (black) mixing ratios (ppbv) the baseaCB05 (red),test base CBMIV (black) base CB05 (red), base Cfor BMIV (black) nd sensitivity xexCH4 (violet) over the hr simulation period. 5 240 hand r simulation period. and sensitivity test xALDX (violet) over the 240 hr simulation pesensitivity test xexCH4 (violet) over the 240 h simulation pe 6 riod. riod. 7 8
9
to the equivalent CBMIV representation as 1 TERP = 10 1.5 ALD2 + 0.5 OLE + 6.0 PAR. 2.2.10
Three reactions were introduced into the CB05 mechanism that are not included in CBMIV which provide a pathway for recycling of reactive nitrogen species
(R51) (R52) (R53)
For sensitivity test xiNOxrecycle, these reactions were removed from CB05, leaving all other reactions as in the base CB05 mechanism. No emissions changes were made to the scenario suite. 2.2.11
xNTRrecycle
The chemistry of lumped organic nitrate (NTR) was altered substantially in CB05. The yield of NTR production from Geosci. Model Dev., 5, 257–268, 2012
the reaction of toluene-hydroxyl radical adduct (TO2) with was reduced from 1 to 0.1, while an additional production reaction of NTR involving the new species TERP with NO3 was introduced. Other reactions producing NTR were unchanged and so the overall production of this species is similar between the two mechanisms. However, in CB05 two NTR recycling reactions were introduced
25 NO
xiNOxrecycle
HO2 NO2 + hν → 0.61HO2 + 0.61NO2 + 0.39OH + 0.39NO3 HNO3 + hν → OH + NO2 → NO2 + NO3 N2 O5 + hν
NTR + OH → HNO3 + HO2 + 0.33HCHO (R61) + 0.33ALD2 + 0.33ALDX − 0.66PAR NTR + hν → NO2 + HO2 + 0.33HCHO (R62) + 0.33ALD2 + 0.33ALDX − 0.66PAR In CBMIV, NTR is an irreversible sink of reactive nitrogen species, acting to permanently remove odd-oxygen from the system. In CB05, NTR is no longer a terminal species for reactive nitrogen, but can play a role similar to peroxyacetylnitrate (PAN) to transport and redistribute reactive nitrogen far from its original source location. For sensitivity test xNTRrecycle, the NTR recycling Reactions (R61 and R62) were removed from CB05, leaving all other reactions as in the base CB05 mechanism. No changes in emissions were made to the scenario suite. www.geosci-model-dev.net/5/257/2012/
26
R. D. Saylor and A. F. Stein: Identifying the causes of differences in ozone production
1 2 3 4 5 6 7 8
265
1 2 Fig. 5. Example scenario results for sensitivity test xIOLE. Ozone Figure 5. Example scenario results for sensitivity test xIOLE. Ozone mixing ratios (3 ppbv) Fig. 6. Example scenario results for sensitivity test xTERP. Ozone for tmixing he base Cratios B05 (red), base Cfor BMIV nd sensitivity est xIOLE (violet) (black) over 4 the 2Figure 40 (ppbv) the(black) base aCB05 (red), tbase CBMIV 6. Example scenario results for sbase ensitivity test (red), xTERP. base Ozone mixing ratios (ppbv) mixing ratios (ppbv) for the CB05 CBMIV (black) hr simulation period. test xIOLE (violet) over the 240 h simulation period. 5 for the base CB05 (red), base CBMIV (black) and sensitivity test xTERP (violet) over the 240 and sensitivity and sensitivity test xTERP (violet) over the 240 h simulation period. 6 hr simulation period. 7 8
2.2.12
xallNOxrecycle
9 10 11
Sensitivity test xallNOxrecycle is a combination of tests xiNOxrecycle and xNTRrecycle where all of the newly introduced reactive nitrogen recycling Reactions (R51, R52, R53, R61 and R62) were removed from CB05, leaving all other reactions as in the base CB05 mechanism. No emissions changes were made to the scenario suite. 3
Results and discussion
The goal of this investigation was to understand the mechanistic reasons why the CB05 chemical mechanism tends to produce higher O3 concentrations than the CBMIV mechanism, especially in the context of the NAQFC system. Because of this relatively narrow focus, in this discussion we concentrate only on O3 and its precursors and how the sensitivity tests shed light on the higher O3 concentrations produced by CB05. Results from the sensitivity tests can be grouped into three categories. First, five of the sensitivity tests (xH2, xoddH&O, xNO3night, xETHA and xALDX) demonstrated little or no impact on O3 concentrations. In other words, the mechanism www.geosci-model-dev.net/5/257/2012/
updates exercised by these five sensitivity tests did not account for the observed larger O3 produced by CB05. An example of this is presented in Fig. 3, where selected simula27 tion scenario results for sensitivity test xALDX are compared with the base CB05 and CBMIV results for ozone. Ozone concentrations from xALDX were only slightly less for most of the scenarios than for the base CB05 runs. Results for xH2, xoddH&O, xNO3night, and xETHA were similarly negative. Consequently, none of the mechanism changes probed by these sensitivity tests account for the higher O3 obtained from CB05. The second group of sensitivity tests (xexCH4, xIOLE, and xTERP) exhibited a more substantial change in O3 concentrations (Figs. 4–6), but either in the wrong direction to explain the observed differences between CB05 and CBMIV or only exhibited the changes for a limited subset of scenarios. Figure 4 presents results from sensitivity test xexCH4. Removing the explicit CH4 chemistry and returning the mechanism to the CBMIV representation resulted in most simulation scenarios, e.g., s04, s10, s16 and s26, exhibiting little change in O3 concentrations. In a few of the scenarios, e.g., s01 and s37, O3 concentrations actually moved further away from the CBMIV results, in cases with Geosci. Model Dev., 5, 257–268, 2012
28
1 2
3 4 5 6 7 8 9
1 Figure 7. Example scenario results for sensitivity test xROOH. Ozone mixing ratios (2 ppbv) Fig. 7.CExample test xROOH. 8. Example scenario results for sensitivity test xiNOxrecycle. for the base B05 (red), bscenario ase CBMIV results (black) afor nd ssensitivity ensitivity test xROOH (violet) Ozone over 3 the 2Figure 40 Fig. 8. Example scenario results for sensitivity test xiNOxrecycle. Ozone mixing ratios mixing pratios hr simulation eriod. (ppbv) for the base CB05 (red), base CBMIV (black) 4 (ppbv) for the base CB05 (red), base CBMIV (black) and sensitivity test xiNOxrecycle Ozone mixing ratios (ppbv) for the base CB05 (red), base CBMIV(violet) 5 over (black) the 240 hand r simulation period. test xiNOxrecycle (violet) over the 240 h and sensitivity test xROOH (violet) over the 240 h simulation pesensitivity 6 riod. simulation period. 7
266
R. D. Saylor and A. F. Stein: Identifying the causes of differences in ozone production
8 9 10 11 higher
low NOx emissions where Reaction (R66’) produces overall concentrations of peroxy radicals than does the explicit representation of MEO2. Figure 5, for sensitivity test xIOLE, presents similar results. Scenarios s01, s10 and s37 showed little change in O3 concentrations, while scenarios s04, s16 and s26 exhibited increases in O3 , again moving further away from the CBMIV results. In these cases, the removal of explicit internal olefin chemistry resulted in a decrease in the amount of reactive nitrogen tied up in HNO3 and NTR, allowing greater O3 production. Finally, in Fig. 6, results from sensitivity test xTERP are presented. These results demonstrate that converting the explicit TERP chemistry introduced in CB05 back into the CBMIV representation (accounting for terpenes as a combination of ALD2, OLE and PAR) actually slightly increases O3 production in most chemical regimes. Thus, the introduction of the explicit TERP chemistry in CB05 effectively reduced O3 production as compared to CBMIV for a given terpene emissions rate and the higher observed O3 produced by CB05 cannot be accounted for by the introduction of explicit TERP chemistry. The third group of sensitivity tests (xROOH, xiNOxrecycle, xNTRrecycle, and xallNOxrecycle) demonstrated the Geosci. Model Dev., 5, 257–268, 2012
29 most
relevant changes in O3 concentrations to the observed differences between CB05 and CBMIV. First, results for sensitivity test xROOH are presented in Fig. 7. In most simulation scenarios, removing Reactions (R63) and (R64) (thus returning ROOH to an inert end product species) reduces the amount of O3 produced in the simulations. The introduction of Reactions (R63) and (R64) in CB05 increases the pool of peroxy radicals through direct production of HO2 and XO2 and indirectly through the production of additional higher aldehydes. However, as seen in Fig. 7, this mechanism change alone only partially accounts for the higher observed CB05 concentrations. The sensitivity tests xiNOxrecycle and xNTRrecycle (Figs. 8 and 9) are similar to each other in that in each nitrogen is recycled from more stable forms (HO2 NO2 , HNO3 and N2 O5 and NTR) back to the more reactive forms NO2 and/or NO3 . As can be seen from the selected simulation scenario results for these tests, the introduction of these reactive nitrogen recycling reactions in CB05 has a significant impact on the production of O3 . For xiNOxrecycle (Fig. 8), the urban-like scenarios (e.g., s01 and s04) exhibit the largest impacts since the concentrations of the inorganic nitrogen www.geosci-model-dev.net/5/257/2012/
30
R. D. Saylor and A. F. Stein: Identifying the causes of differences in ozone production
1 2 3 4 5 6 7 8 9 10
267
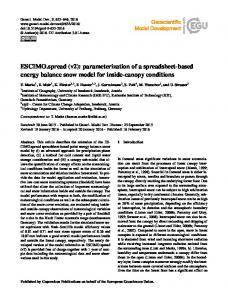
1 Figure 9. Example scenario results for sensitivity test xNTRrecycle. Ozone mixing r2 atios Fig. 9. Example scenario results for sensitivity test xNTRrecycle. Fig. 10. Example scenario results for sensitivity test allNOxrecycle. (ppbv) for the base CB05 (red), base CBMIV (black) and sensitivity test xNTRrecycle 3 (violet) Figure 10. Example scenario results for sensitivity test allNOxrecycle. Ozone mixing ratios ratios (ppbv) for the base CB05 (red), base CBMIV Ozone ratios (ppbv) for the base CB05 (red), base CBMIV over Ozone the 240 hmixing r simulation period. 4 (ppbv) for the mixing base CB05 (red), base CBMIV (black) and sensitivity test allNOxrecycle 5 (violet) over the 240 sensitivity hr simulation period. (black) and sensitivity test xNTRrecycle (violet) over the 240 h sim(black) and test allNOxrecycle (violet) over the 240 h 6 ulation period. simulation period. 7 8 9
compounds are larger in these than in the rural-like scenarios (e.g., s10 and s16). On the other hand, for xNTRrecycle (Fig. 9), the lack of NO2 recycling from NTR has a significant impact in most of the scenarios, except those in which little NTR is produced initially (e.g., s01). The combination of the two sets of mechanism changes is tested with xallNOxrecycle, shown in Fig. 10, and demonstrates that these nitrogen recycling pathways as a group have a large impact on O3 production in all chemical regimes. In CBMIV, the lack of these recycling pathways (Reactions R51, R52, R53 and R62) effectively reduces the total amount of reactive nitrogen available in the system through which O3 can be produced by tying up a fraction of emitted NOx in HO2 NO2 , HNO3 , N2 O5 and especially NTR. Inclusion of these pathways in CB05 enhances the effective pool of reactive nitrogen for a given fixed emissions scenario. These results clearly indicate that introducing these recycling pathways has a large impact on O3 production in the system and can substantially account for the higher production of CB05 as compared to CBMIV.
www.geosci-model-dev.net/5/257/2012/
4 31
Conclusions and implications
A box model investigation of mechanistic differences between CB05 and CBMIV was conducted to determine the underlying reasons why CB05 has been observed to consistently produce higher O3 concentrations than CBMIV for a given set of simulation conditions. By performing sensitivity tests to isolate the conceptual groupings of mechanism differences between CB05 and CBMIV, this study has identified two sets of reactions that are the primary causes of the greater O3 production observed in CB05. First, the introduction of Reactions (R63) and (R64) in CB05, where the higher organic peroxide species reacts to produce peroxy radicals directly (as HO2 and XO2) and indirectly (via production of higher aldehydes) results in higher O3 concentrations in most chemical regimes. Second, the introduction in CB05 of recycling pathways for reactive nitrogen (via Reactions R51, R52, R53 and R62) effectively increases the amount of NOx available in the system for a given emissions rate. In the context of a large-scale three-dimensional air quality simulation such as the NAQFC, the reactive nitrogen recycling reactions are particularly effective in producing larger Geosci. Model Dev., 5, 257–268, 2012
32
268
R. D. Saylor and A. F. Stein: Identifying the causes of differences in ozone production
O3 concentrations throughout the model domain. In particular, the organic nitrate species, NTR, plays a role much as the PAN species, serving as a temporary reservoir of reactive nitrogen. NTR can be formed efficiently through a variety of pathways in the CB05 mechanism (Reactions R55, R115, R129, R133, R144, R147, R152, R156) and is formed at the highest rates near significant NOx sources. Since the lifetime of NTR with respect to its most significant chemical loss process (Reaction R62) is about 4 days, it can be transported relatively long distances away from major sources before NO2 is regenerated. If this recycling process occurs in NOx -sensitive areas, significant additional O3 can be produced. Through this process, NOx , which is emitted from large sources in NOx -saturated chemical regimes where it may not produce much additional O3 , can be redistributed to more remote locations which may be NOx -sensitive, thereby increasing the O3 -production efficiency of each emitted NOx molecule. As previous studies have indicated (Yarwood et al., 2005; Sarwar et al., 2008; Luecken et al., 2008), the CB05 mechanism is a better representation of the state-of-the-science (as of 2005) of gas phase chemistry than is the CBMIV mechanism. The fact that the NAQFC operational version, which uses the CBMIV mechanism, produces ground-level O3 concentrations which have smaller biases with respect to measurements (Fig. 1) than does the CB05 version implies that the operational NAQFC system contains other compensating errors that allow it to produce better results for O3 . In order to move the NAQFC system forward to further improve its forecasting capabilities, these compensating errors need to be uncovered and corrected. Supplementary material related to this article is available online at: http://www.geosci-model-dev.net/5/257/2012/ gmd-5-257-2012-supplement.pdf. Acknowledgements. The authors thank current and former members of the NOAA Air Resources Laboratory air quality modeling group (Pius Lee, Tianfeng Chai, Yunsoo Choi, Yunhee Kim, HyunCheol Kim, Hsin-Mu Lin, Fantine Ngan and Daniel Tong) for many useful discussions during the conduct of this work. RS also thanks Golam Sarwar of the US Environmental Protection Agency for helpful discussions and insight into the issues investigated here. The authors dedicate this manuscript to the memory of Daewon Byun (1956–2011), who inspired the initiation of this investigation. Edited by: A. Kerkweg
Geosci. Model Dev., 5, 257–268, 2012
References Byun, D. and Schere, K. L.: Review of the governing equations, computational algorithms, and other components of the Models3 Community Multiscale Air Quality modeling system, Appl. Mech. Rev., 59, 51–77, 2006. Eder, B., Kang, D., Mathur, R., Pleim, J., Yu, S., Otte, T., and Pouliot, G.: A performance evaluation of the National Air Quality Forecast Capability for the summer of 2007, Atmos. Environ., 43, 2312–2320, 2009. Gery, M. W., Whitten, G. Z., Killus, J. P., and Dodge, M. C.: A photochemical mechanism for urban and regional scale computer modeling, J. Geophys. Res., 94, 12925–12956, 1989. Janjic, Z. I.: A nonhydrostatic model based on a new approach, Meteorol. Atmos. Phys., 82, 271–285, 2003. Luecken, D. J., Tonnesen, G. S., and Sickles II, J. E.: Differences in NOy speciation predicted by three photochemical mechanisms, Atmos. Environ., 33, 1073–1084, 1999. Luecken, D. J., Phillips, S., Sarwar, G., and Jang, C.: Effects of using the CB05 vs. SAPRC99 vs. CB4 chemical mechanism on model predictions: ozone and gas-phase photochemical precursor concentrations, Atmos. Environ., 42, 5805–5820, 2008. Otte, T., Pouliot, G., Pleim, J., Young, J., Schere, K., Wong, D., Lee, P., Tsidulko, M., McQueen, J., Davidson, P., Mathur, R., Chuang, H.-Y., DiMego, G., and Seaman, N.: Linking the Eta model with the Community Multiscale Air Quality (CMAQ) modeling system to build a national air quality forecasting system, Weather Forecast., 20, 367–384, 2005. Sandu, A. and Sander, R.: Technical note: Simulating chemical systems in Fortran90 and Matlab with the Kinetic PreProcessor KPP-2.1, Atmos. Chem. Phys., 6, 187–195, doi:10.5194/acp-6187-2006, 2006. Sarwar, G., Luecken, D., Yarwood, G., Whitten, G., and Carter, W. P. L.: Impact of an updated carbon bond mechanism on predictions from the CMAQ modeling system: preliminary assessment, J. Appl. Meteorol. Climatol., 47, 3–14, 2008. Seinfeld, J. H. and Pandis, S. N.: Atmospheric Chemistry and Physics: From Air Pollution to Climate Change, John Wiley & Sons, Inc., New York, 1998. Yarwood, G., Rao, S., Yocke, M., and Whitten, G. Z.: Updates to the Carbon Bond Chemical Mechanism: CB05, RT-04-00675, Final Report to US Environmental Protection Agency, Yocke and Company, Novato, CA, December 2005. Yu, S., Mathur, R., Sarwar, G., Kang, D., Tong, D., Pouliot, G., and Pleim, J.: Eta-CMAQ air quality forecasts for O3 and related species using three different photochemical mechanisms (CB4, CB05, SAPRC-99): comparisons with measurements during the 2004 ICARTT study, Atmos. Chem. Phys., 10, 3001– 3025, doi:10.5194/acp-10-3001-2010, 2010. Zaveri, R. and Peters, L. K.: A new lumped structure photochemical mechanism for large-scale applications, J. Geophys. Res., 104, 30387–30415, 1999.
www.geosci-model-dev.net/5/257/2012/