The artifacts the SSM may generate are spurious sideband instability (SI) [2] and four-wave mixing (FWM) [3] tones. The novel method we present is based on a ...
IEEE PHOTONICS TECHNOLOGY LETTERS, VOL. 12, NO. 5, MAY 2000
489
Suppression of Spurious Tones Induced by the Split-Step Method in Fiber Systems Simulation G. Bosco, Student Member, IEEE, A. Carena, Member, IEEE, V. Curri, Member, IEEE, R. Gaudino, Member, IEEE, P. Poggiolini, Member, IEEE, and S. Benedetto, Fellow, IEEE
Abstract—Numerical approximations involved in solving the nonlinear Schrödinger equation using the split-step method may cause the generation of spurious spectral peaks which can be seen as fictitious four-wave mixing. In this letter, we present a new method for reducing and controlling such simulation artifacts by properly choosing the spatial step size. Index Terms—Fiber optics, simulation, wavelength-division multiplexing.
I. INTRODUCTION
F
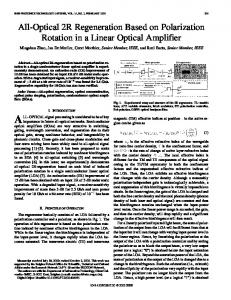
IBER propagation of optical signals is governed by the well-known nonlinear Schrödinger equation (NLSE), whose solution must be derived employing numerical methods. The most commonly used algorithm is the split-step method (SSM) [1], which is based on the partition of the fiber span into several spatial steps. Over each step, the nonlinear (Kerr effect) and linear (chromatic dispersion) operators of the NLSE are applied separately, therefore these phenomena are supposed to act independently over each step. The numerical solution of the NLSE through the SSM converges to the exact solution when the step-size tends to zero [1]. But, since the smaller is the step amplitude, the higher is the requested computational time, a trade-off between these two opposite requirements must be found. To achieve this goal, the simulation artifacts induced by a wrong step-size choice must be recognized, and a law to choose a proper step-size distribution to reduce and to control these effects must be found. The artifacts the SSM may generate are spurious sideband instability (SI) [2] and four-wave mixing (FWM) [3] tones. The novel method we present is based on a logarithmic step-size distribution, and allows the quantitative control on the simulation artifacts. The signal-to-artifacts ratio can be imposed a priori, and results can be better interpreted. In Fig. 1, simulation results of a system configuration that theoretically should not excite FWM are presented. Considering the same number of steps (K = 20), when the uniform step-size distribution is employed, the ouput spectrum [Fig. 1(a)] presents spurious tones much higher than the one [Fig. 1(b)] obtained through the simulation based on the logarithmic step-size distribution. Unequally spaced channels have been considered to better show the FWM products.
Fig. 1. Power spectrum at the fiber output. Simulation parameters: L = 50 km, P = 4 mW/channel, = 2 W01 km01 , 2 = 2 ps2 /km, � = 0:25 dB/km, f0 = 193 THz. Number of steps: K = 20. Step-size distribution: (a) uniform and (b) logarithmic. Carriers are unequally spaced.
The presented analysis is based on an equally spaced channels scenario representing a worst-case situation in terms of FWM impairments. In [5], similar results for the uniform step-size distribution have been presented, but, to our knowledge, this is the first time a quantitative study is described for the nonuniform step-size distribution. II. FWM EFFICIENCY We have considered a WDM system composed by Nc CW equally spaced carriers. The propagating signal can be written as
XN c
A(z; T )
=
i=1 Manuscript received June 1, 1999; revised January 28, 2000. The authors are with the Dipartimento di Elettronica, Politecnico di Torino, 10129 Torino, Italy. Publisher Item Identifier S 1041-1135(00)03603-X.
Ai (z )e
|2�fi T
(1)
where fi is the frequency of the ith carrier. If we propagate this signal through a fiber span, the generation of tones (FWM products) at the frequencies fikh = fi + fk 0 fh (1 � i; k; h � Nc )
1041–1135/00$10.00 © 2000 IEEE
490
IEEE PHOTONICS TECHNOLOGY LETTERS, VOL. 12, NO. 5, MAY 2000
can be observed. Since carriers are equally spaced, the number of FWM products at each fikh frequency can be more than one. The power of each FWM product can be expressed as [6]
Pikh(L) = Pi(0)Pk (0)Ph (0)e02�L (Djkh =3)2 2 L2e �
(2)
where
Le L � Djkh
nonlinearity coefficient effective length equal to 0 e02�L = fiber length loss coefficient equalto3if fj fk 6 fh ,equalto 6if fj
) 2�
(1
= =
6= fk 6= fh :
� is the FWM efficiency
4�2 4e02�L sin2(1 L=2) (3) 1 + 4�2 + 1 2 (1 0 e02�L)2 where 1 = 4�2 2 jfj 0 fh j 1 jfk 0 fh j is the phase mismatch. �=
�
�
We have then considered the NLSE operator splitting induced by the SSM [1], in order to obtain an exact formula for the FWM efficiency, when the SSM is applied to simulate fiber propagation. A uniform step-size ( z ) distribution has been analyzed, and the propagation of signal (1) through the cascade of steps has been studied. Since signal (1) is a comb of CW carriers, its propagation through both the linear and nonlinear operators has an analytical solution. Therefore, we were able to theoretically obtain the resulting signal at the output of a fiber span, propagated through the numerical SSM. Analyzing the FWM products, we get the following FWM efficiency altered by the SSM algorithm:
1
�0 =
1 + e04� 1z 0 2e02� 1z 0 1 + e 4� 1z 0 2e02� 1z cos 1 1z 04�L 2e02�L cos 1 L 1 1 + e1 + e004�L 0 2e02�L :
(4)
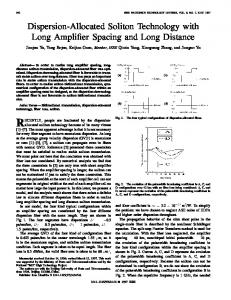
For the first time, to our knowledge, an analytical exact formula characterizing the altered FWM efficiency �0 due to the SSM with uniform step-size distribution has been derived. Fig. 2 shows the FWM efficiency versus the channel separation f after the propagation through a fiber span. The two curves report the theoretical FWM efficiency � and the fictitious one �0 , evaluated using the SSM with uniform z distribution, versus f . For f up to 40 GHz, �0 follows � , but for f greater than 40 GHz, �0 grows again, presenting several peaks. The first peak ( f fp1 ) is around 90 GHz, which means whatever (signal or noise) is at that spectral distance from a carrier acts like an unrealistic pump for spurious tones. The same phenomenon may take place for the other peaks of �0 .
1
1
1 1 1 =
1
III. LOGARITHMIC STEP-SIZE The phenomenon of fictitious FWM induced by a wrong choice of the SSM step-size can be detrimental for the reliability of simulation results. A possible countermeasure is choosing such a small p z that the first peak of �0 , whose = � z j 2j can be obtained from spectral position fp1 (4), falls outside the simulation bandwidth BW . In this way, there are no spectral regions in the simulation bandwidth that
1 = 1 (2 1
)
Fig. 2. FWM efficiency versus channel spacing: theoretical (solid line) and altered by the SSM with number of steps K = 50 (dashed line). Parameters: L = 50 km, 2 = 2 ps2 /km, � = 0:25 dB/km.
may act as pumps for the altered FWM. This criterion requires 2 . Unfortunately, fp1 > BW , that yields: z � = �j 2 jBW this result can be achieved only choosing a very small step-size, seriously compromising the simulation speed. For instance, in the previously presented scenario, the step-size should m. Another way to choose z with uniform be z � distribution is the evaluation of the smallest step permitting a 10% accuracy on all in-band FWM products [5]. Following this criterion, the uniform SSM step-size can be increased up m. to z Usually, instead of the uniform step-size choice, a nonuniform law increasing the step-size as power decreases is used. It is based on the maximum allowed nonlinear phase-shift, that means zPp < NL jmax , where Pp is the instantaneous optical peak power [4]. Moreover, a maximum limit in the enlarging of the step-size is usually fixed. Following this criterion, the suppression of spurious tones is not under quantitative control, thus reducing the reliability of the results and the possibility of trading off between accuracy and computational time. This is the reason why we devised a technique to obtain the altered FWM efficiency for the case of a generic nonuniform step-size choice. The FWM efficiency at the end of a fiber span of length L, subdivided into K generic sections z1; 1 1 1 ; zK is
1
1
1 (2
)
100
1
1 = 400 1
8
1
�00 =
1
(1 0 e02�L)2
K X
1
n=1
�n
2
e|�n
where
�n =(1 0 e02�1zn ) exp
(
nX 01
02�
i=1
1zi
)
(5)
; �n =01
X1 n
zi :
i=1
Therefore, employing the generic formula (5), the altered FWM efficiency for any step-size distribution can be easily derived and put under a quantitative control. The next goal was to derive a step-size distribution inducing a FWM efficiency function �00 f without peaks and with a
(1 )
BOSCO et al.: SUPPRESSION OF SPURIOUS TONES INDUCED BY THE SPLIT-STEP METHOD
491
of FWM contributions on the center channel of the equally spaced comb has been considered, that means M = Nc2 . It is possible to find the number of steps K that makes the power (7) of the spurious terms be x-dB below the carriers level, that means to impose
=3 4
PFWM < 10(0x=10) : P e02�L
(8)
It corresponds to the following condition for the number of steps with logarithmic step-size distribution:
K > 34 Nc2 2 L2e P 210(x=10)
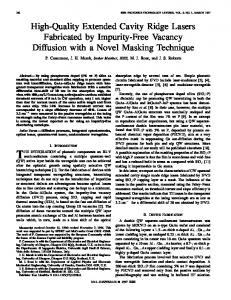
Fig. 3. Comparison between FWM altered efficiencies � 0 (solid line) and � 00 for the logarithmic step-size distribution (dashed line), evaluated with number of steps K = 50. Parameters: L = 50 km, 2 = 2 ps2 /km, � = 0:25 dB/km. The flat line is the 1=K high floor.
monotone behavior to put under control the level of spurious tones. Imposing in (5) that �n = �; 8 n and that phases �n f are statistically independent and uniformly distributed random processes, the average value of �00 tends to the floor =K . The spurious level floor depends on the number of steps only. If we impose constant values for �n terms, we obtain the following logarithmic step-size distribution:
(1 )
1
� � 1zn = 0 21� ln 1 01(0n 0n�1)� ;
= (1
)
n = 1; 1 1 1 ; K
= 1 ln(1
)2
1
1 = 50 1
1
PFWM =
M 2 L2e e02�LP 3 K
where Nc is the number of transmitted carriers. To show the capability of our technique in suppressing SSM artifacts, we have used the logarithmic step-size distribution in the same scenario of Fig. 1(a). A 20-dB level of spurious tones suppression has been imposed, implying 20 steps only (CPU) ), against the 600 steps (CPU time � TLSSD (CPU time (CPU) 1 TLSSD ) required to make all the spurious tones to fall outside the simulation bandwidth, and the 125 steps (CPU time (CPU) ) required to obtain a 10% accuracy on all in-band � 1 TLSSD FWM powers evaluation as in [5]. In Fig. 1(b), the power spectrum at the fiber output is shown for the logarithmic step-size distribution (6). The level of spurious terms is kept under the required suppression level, confirming the presented method works properly for unequally spaced channels systems also.
=
30
6
IV. CONCLUSION (6)
0 e02�L =K , and K is the number of steps. where � 0 n� = � for Phases �n are thus defined as �n n ; 1 1 1 ; K . Deriving (5) for this case and analyzing its behavior versus f , we obtained that �00 follows � until it reaches the =K level, then �00 keeps this value. This means that the phases �n turn out to behave as if they were sufficiently randomized, when f grows. As an example, in Fig. 3, a comparison between the FWM altered efficiencies �0 and for �00 are . �00 presents the expected floor. The theoshown, with K retical floor level =K is also shown. The next step was to put under control the level of spurious tones with respect to the carrier power. A signal as in (1), with each carrier of power P , has been considered. Then, �00 obtained for the logarithmic step-size distribution has been substituted to � in the (2). �00 is supposed to be equal to the floor value =K , independently by the frequency, to evaluate the worst case in terms of level of spurious FWM. The total power of spurious FWM, at a certain frequency, is thus obtained, when the SSM is used with the logarithmic step-size distribution. Its expression is
=1 1
(9)
(7)
where M is the number of generated FWM terms at the considered frequency. To perform a worst-case evaluation, the number
For the first time, an analytical evaluation of altered FWM efficiency by the SSM has been derived. On its basis, a novel method to choose the step-size distribution in the SSM is described. It allows to reduce and to control the impact in simulations of the spurious phenomenon called fictitious FWM generation. It has been shown that it yields a strong reduction of the number of steps required to obtain a certain error level, and is thus suitable for reliable and fast simulation of optical links. One of the main strengths of the proposed method is its independency of 2 , 3 , or of the simulation bandwidth, as well as of the channel spacing. The analysis has been carried on in the single polarization case, thus the final step-size formula (9) is based on a worst-case evaluation over all possible polarizations. REFERENCES [1] G. P. Agrawal, Nonlinear Fiber Optics. New York: Academic, 1995. [2] F. Matera et al., “Sideband instability induced by periodic power variation in long-distance fiber links,” Opt. Lett., vol. 18, no. 18, Sept. 1993. [3] F. Forghieri, “Modeling of wavelength multiplexed lightwave systems,” in Proc. OFC’97, Dallas, TX, Feb. 1997, paper TuG1. [4] R. W. Tkach et al., “Four-photon mixing and high speed WDM systems,” J. Lightwave Technol., vol. 13, pp. 841–849, May 1995. [5] C. Francia, “Constant step-size analysis in numerical simulation for correct four-wave-mixing power evaluation in optical fiber transmission systems,” IEEE Photon. Technol. Lett., vol. 11, pp. 69–71, Jan. 1999. [6] N. Shibata, R. P. Braun, and R. G. Waarts, “Phase-mismatch dependence of efficiency of wave generation through four-wave mixing in a single-mode optical fiber,” IEEE J. Quantum Electron., vol. QE–23, pp. 1205–1210, July 1987.