IMAGE COMPRESSION USING 2-D MULTIPLE-LEVEL DISCRETE WAVELET TRANSFORM (DWT) İbrahim Öz
Cemil Öz
Nejat Yumuşak
e-mail:
[email protected] e-mail:
[email protected] e-mail:
[email protected] Sakarya University, Faculty of Engineering, Department of Electrical & Electronics Engineering, Sakarya, Turkey Key words: Wavelet, multiple-level decomposition, image, compression, coding. ABSTRACT Wavelet is a recently developed compression technique in image compression. In this study, after multiple level 2-D wavelet transform of images, approximation and detail coefficients are obtained. These coefficients are quantized that more important coefficients are represented with higher accuracy and retained coefficients are represented with less accuracy or they are neglected. Afterward the quantized coefficient (symbols) are coded in a bit stream using recursive splitting Huffman coding. The quality of reconstructed images are measured with PSNR value, and compression ratio is calculated using given formula. Generally wavelet performs better compression than other compression methods. I. INTRODUCTION During last decade there has been enormous increase in digital images. This type of information gives rise to high transmission and storage cost. To store these images or make them available over networks, compression techniques are needed. To illustrate the need for compression , some examples are given: • To store a color image of moderate size, e.g. 512x512 pixels, one needs 0.75 MB of disk space. • A 35 mm slide digitized with a resolution of 12 μm requires 18 MB disk space. • One second of digital PAL video requires 27 MB. Digital images can be compressed by eliminating redundant information. There are three types of redundancy that can be exploited by image compression systems. • Spatial redundancy; in almost all natural images the values of neighboring pixels are strongly correlated. • Spectral redundancy; in images composed of more than one spectral band the spectral values for the same pixel location are often correlated. • Temporal redundancy; Adjacent frames in video sequence often show very little change.
Therefore, the development of reliable and fast compression techniques for several quality levels has become an important research topic. Many algorithm have been proposed in literature and some of them have been standardized. Mainly compression methods can be divided into two classes; lossless and lossy compression techniques: • Lossless compression guarantees that the original signal can be reconstructed without any errors. This is important for application like compression of text or medical images. • Lossy compression gives higher compression rates. But exact data can not be reconstructed. Human visual system is not sensitive or has low sensitivity to some kind of errors. That’s why the compression potential is much higher when small reconstruction errors are allowed. II. IMAGE QUALTY MEASUREMENT Throughout this paper numbers are given for two measures of compression performance compression ratio (CR) and peak signal to noise ratio (PSNR). Compression ratio is defined as: number of bits in compressed image CR = 100 - [ ] * 100 number of bits in original image The peak signal to noise ratio in decibels (dB) is defined as:
PSNR = 20 log10
MAX RMSE
where,MAX is the image depth. In this study 8 pixels depth image are used so MAX=28-1=255 RMSE is the root mean square error and defined as:
RMSE =
1 NM
N
M
∑∑ [ f ( x, y) − fˆ ( x, y )]
2
x =1 y =1
where, N and M are the width and height of the images in pixels. ƒ is the original image and fˆ is the reconstructed image.
III. WAVELET ANALYSIS Perhaps the most well-known mathematical technique for analyzing signal is the Fourier analysis which breaks down a signal into constituent sinusoids of different frequencies. For many signals, Fourier analysis is extremely useful but Fourier analysis has serious drawback if signal has non-stationary characteristics[1]. So another efficient analyzing technique is needed. Wavelet were developed independently in the fields of mathematics, quantum physics, electrical engineering, and seismic geology. Interchanges between these fields during the last ten years have led to many new wavelet applications. Wavelet are mathematical functions that cut up data into different frequency components and then study each component with resolution matched to its scale. They have advantage over traditional Fourier methods in analyzing physical situations where the signal contains discontinuities and sharp spikes. Wavelet transform can be formulated as follows;
Figure 2. Two-dimensional DWT
f = ∑ a iψ i i
IV. DISCRETE WAVELET TRANSFORM Calculating the wavelet coefficients at every possible scale generates a lot of awful data. If scales and positions based on powers of 2 –called dyadic scales and positions- are chosen then analysis become more efficient and accurate. Such an analysis obtained from the discrete wavelet transform(DWT) [2,3]. The analysis start from signal s and results in the coefficients C(a,b). C ( a, b) = C ( j , k ) =
∑ s ( n) g
j , k ( n)
n∈Z
For many signals, the low frequency content is the most important part. It identifies the signal. The high frequency content has less importance.
Figure 3. Two level two-dimensional DWT V. MULTIPLE-LEVEL DECOMPOSITION The composition process can be iterated with successive approximations being decomposed in turn , so that one signal is broken down into many lower resolution components. This is called multiple-level wavelet decomposition.
Figure 1. The original signal passes through two complementary filters and produces two signals.
Figure 4. Wavelet decomposition tree.
VI. INVERSE DISCRETE WAVELET TRANSFORM The synthesis starts from the coefficients C(a,b) and reconstructs signal s [4]. Synthesis is reciprocal operation of analysis. s (t ) =
∑∑ C ( j, k )ψ
j , k (t )
j∈Z k∈Z
Figure 5. Two- dimensional IDWT
VIII. QUANTISATION Quantisation takes input values and maps them to output values, based on particular threshold levels. There are several types of quantisation method. In this study uniform scaler quantisation is used [8,9]. IX. HUFFMAN CODING Huffman coding creates variable length codes each represented by an integer number of bits. Symbols with higher probabilities get shorter codewords. Huffman coding is the best coding scheme when codewords are restricted to integer length, and it is not too complicated to implement [10]. In this study recursive splitting Huffman coding is used and this coding scheme does considerably better than straightforward Huffman coding and usually better than jpeg like Huffman coding for both real world signal and synthetic signal [11]. X. RESULTS AND DISCUSSION
VII. IMAGE COMPRESSION
Figure 6. Block diagram of wavelet based image coders A wide variety of wavelet based image compression scheme have been reported in the literature ranging from simple entropy coding to more complex techniques such as vector quantisation [5] adaptive transform [6] tree encoding [7] edge based coding and Huffman coding. All of these schemes can be described in terms of general framework which shown in figure 6. In this study, after wavelet transform of images, approximation and detail coefficients are obtained. These coefficients are quantised that more important coefficients are represented with higher accuracy and retained coefficients are represented with less accuracy or they are neglected. After that the quantised coefficient (symbols) are coded in a bit stream using recursive splitting Huffman coding and compressed data is obtained. To decompress images, compressed data is decoded and then dequantised (inverse quantised). In this step wavelet coefficients are obtained. Using inverse discrete wavelet transform original image reconstructed with some errors. The quality of reconstructed images are measured with PSNR value, and compression ratio is calculated using given formula.
Figure 7. Wavelet 2-D image decomposition at level1
Figure 8. Wavelet 2-D image decomposition at level 2
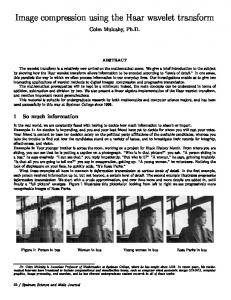
Figure 12. Reconstructed Lenna images. Only level 3 approximation coefficients are used. CR=98.43 and Psnr=20.78 dB Figure 9. Wavelet 2-D image decomposition at level 3. 32 coif5
PSNR
31 dmey
30
db10
29
bior6.8
sym3 rbio5.5
28 27 70
75
80
85
90
95
% CR
Figure 13. Performance of reconstructed Lenna images for different wavelet families. Only level 1 approximation coefficients are used. Figure 10. Reconstructed Lenna images. Only level 1 approximation coefficient are used.
41 dmey PSNR
39.5 sym3 db10
38
rbio5.5
36.5
coif5 bior6.8
35 65
70
75
80
85
90
% CR
Figure14. Performance of reconstructed Lenna images for different wavelet families. Level 1 approximation and detail coefficients are used. Figure 11. Reconstructed Lenna images. Only level 2 approximation coefficients are used. CR=93.75 and Psnr=22.29 dB
Various wavelet families (db10, sym3, coif5, bior6.8, rbio5.5, dmey) have been applied to lossy image compression. For evaluation standard test image Lenna is used. In level 1 decomposition of image, to reconstruct image only approximation coefficient used for various threshold value and as shown in figure 13, 75%-90% compression ratio, 29-31 dB psnr value obtained. When detail coefficient are added, the compression ratio decreased to 70%-85% but psnr value increased to 35-40 dB as shown in figure 14. Compression performance varies according to wavelet family. Generally wavelet family with more analysing vanishing moment performs better compression. In level 2 decomposition of image, when only level 2 approximation coefficients are used, very high compression ratio about 93.75% obtained but psnr value decreased to 22.29 dB. If level 2 detail coefficients are added then performance becomes the same as level 1 decomposition. In level 3 decomposition of image when only level 3 approximation coefficients are used compression ratio increases to 98.43% but psnr value decreases to 20.78 dB. If level 3 detail coefficients are added than performance becomes the same as level 2 decomposition. In all wavelet families and all level, it is possible to increase compression ratio by increasing quantization threshold value but if threshold value increased psnr value decreases. V. CONCLUSION Basic and applied research in the field of wavelets has made tremendous progress in the last decade. Image compression schemes based on wavelets are rapidly gaining maturity and have already began to appear in commercial software/hardware systems. The reconstruction quality of wavelet images has become better than Jpeg which is the current international standard for image compression. In this study multiple-level decomposition of images and compression of images using different wavelet families have been showed. The results is found that wavelet has better performance in image compression than known standards. That’s why wavelet becomes new international standards for image compression. 1. 2. 3.
4. 5.
REFERENCES Michel M., Misiti Y.,Openhein G. “Wavelet Toolbox for use with Matlab”, Version 2. Daubechihes I. (1992), “Ten Lectures on Wavelets”, SIAM Mallat S. (1989), “A theory of multiresolution signal decomposition; the wavelet representation”, IEEE Pattern Anal. And Machine Intel., vol.11, no:7, pp.674-693 Strang G., Nguyan T. (1992), “Wavelets and Filter Banks”, Wellesley-Cambridge Press. Antonini M., Barlaud M., Daubechies I., “Image coding using wavelet transform”, IEEE Trans Image Processing, pp.205-209.
6.
Wickerhauser M. “Acoustic signal compression with wavelet packets” Academic Press San Diego pp.679-700 7. Shapiro J. “Embedded image coding using zerotrees of wavelet coefficient.” IEEE Trans signal Processing pp. 3445-3462. 8. Gersho A., Gray M. (1992), “ Vector quantization and Signal Compression”, Kluwer Academic Publishers, Boston 9. Nelson M., Gailly J. (1996), “The data Compression Book”, M&T Books, New york, USA 10. Sketting K., Hokan J., “Improved Huffman Coding Using Recursive Splitting” 11. William B., Joan L.(1992), “Still Image Data Compression Standard”, Van Nostrand Reinhold, New York.